You are not logged in.
This means you
CAN ONLY VIEW reports that were published prior to Sunday, March 30, 2025.
You
MUST UPGRADE YOUR MEMBERSHIP if you want to see any current reports.
AFTER MARKET UPDATE - WEDNESDAY, DECEMBER 15TH, 2021
Previous After Market Report Next After Market Report >>>
|
|
|
|
DOW |
+383.25 |
35,927.43 |
+1.08% |
|
Volume |
1,130,486,228 |
+8% |
|
Volume |
5,263,250,900 |
+10% |
|
NASDAQ |
+327.94 |
15,565.58 |
+2.15% |
|
Advancers |
2,136 |
65% |
|
Advancers |
2,722 |
63% |
|
S&P 500 |
+75.76 |
4,709.85 |
+1.63% |
|
Decliners |
1,140 |
35% |
|
Decliners |
1,595 |
37% |
|
Russell 2000 |
+35.56 |
2,195.21 |
+1.65% |
|
52 Wk Highs |
69 |
|
|
52 Wk Highs |
56 |
|
|
S&P 600 |
+17.06 |
1,363.13 |
+1.27% |
|
52 Wk Lows |
230 |
|
|
52 Wk Lows |
641 |
|
|
New buying efforts can be made in stocks meeting all key criteria of the fact-based investment system after the big gain today from the Nasdaq Composite Index (+2.1%) with higher volume and an expansion in leadership (stocks hitting new 52-week highs) established a new confirmed uptrend for the market (M criteria).
|
 |
Major Averages Confirm Uptrend With Big Gains With Higher Volume
Kenneth J. Gruneisen - Passed the CAN SLIM® Master's Exam
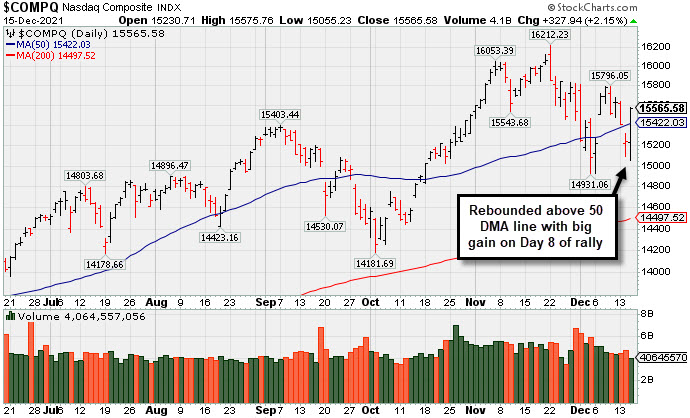
The Dow rallied 383 points, while the S&P 500 jumped 1.6%. The Nasdaq Composite reversed a more than 1% drop to end the session 2.2% higher. The volume totals reported were higher than the prior session on the NYSE and on the Nasdaq exchange, indicative of improved institutional buying demand. Breadth was clearly positive as advancers led decliners by almost a 2-1 margin on the NYSE and by a 5-3 margin on the Nasdaq exchange. There were 23 high-ranked companies from the Leaders List that hit new 52-week highs and were listed on the BreakOuts Page, more than tripling the total of 7 on the prior session. New 52-week lows totals still outnumbered new 52-week highs totals on the NYSE and on the Nasdaq exchange. Solid gains signaled a new confirmed uptrend for the market (M criteria), opening the door again to new buying efforts under the fact-based investment system.
 PICTURED: The Nasdaq Composite Index posted a solid gain with higher volume (final total not shown on graph) on Wednesday, Day 8 of its rally attempt, rebounding above its 50-day moving average (DMA) line. The confirming gain coupled with an increase in stocks hitting new 52-week highs met the definition of a proper follow-through day.
U.S. stocks turned firmly higher on Wednesday as investors parsed the latest Federal Reserve (Fed) policy decision. Treasuries modestly weakened, with the yield on the 10-year note up two basis points (0.02%) to 1.46% and the more Fed-sensitive two-year note rate rising one basis point (0.01%) to 0.66%.
As widely anticipated, the Fed announced plans to double the pace of tapering its bond buying program amid ongoing price pressures. During the post-meeting press conference, Fed Chair Jerome Powell noted that the pandemic-era asset purchases would likely end in March, opening the door for subsequent rate hikes. The U.S. central bank also published economic projections alongside their statement. The so-called “dot plot” showed a majority of policymakers expected three or more 25 basis point (0.25%) rate increases next year, a shift from the previous release in September indicating Fed officials were evenly split for a rate lift-off in 2022 or 2023. On the data front, U.S. retail sales increased 0.3% in November, the smallest gain in four months and trailing estimates of a 0.8% advance.
Ten of 11 S&P 500 sectors ended in positive territory, with Technology stocks pacing the gains. Chipmakers provided a tailwind with Advanced Micro Devices (AMD +8.04%) rallying from support at its 50 DMA line. Health Care shares also outperformed, with Eli Lilly (LLY +10.39%) challenging its all-time high following a boost to its forward guidance. The Energy group was the lone decliner despite WTI crude adding 1.2% to $71.58/barrel following a larger-than-forecasted drawdown in weekly domestic stockpiles. |
 Kenneth J. Gruneisen started out as a licensed stockbroker in August 1987, a couple of months prior to the historic stock market crash that took the Dow Jones Industrial Average down -22.6% in a single day. He has published daily fact-based fundamental and technical analysis on high-ranked stocks online for two decades. Through FACTBASEDINVESTING.COM, Kenneth provides educational articles, news, market commentary, and other information regarding proven investment systems that work in good times and bad.
Comments contained in the body of this report are technical opinions only and are not necessarily those of Gruneisen Growth Corp. The material herein has been obtained from sources believed to be reliable and accurate, however, its accuracy and completeness cannot be guaranteed. Our firm, employees, and customers may effect transactions, including transactions contrary to any recommendation herein, or have positions in the securities mentioned herein or options with respect thereto. Any recommendation contained in this report may not be suitable for all investors and it is not to be deemed an offer or solicitation on our part with respect to the purchase or sale of any securities. |
|
 |
Broker/Dealer, Tech, and Retail Indexes Rose
Kenneth J. Gruneisen - Passed the CAN SLIM® Master's Exam
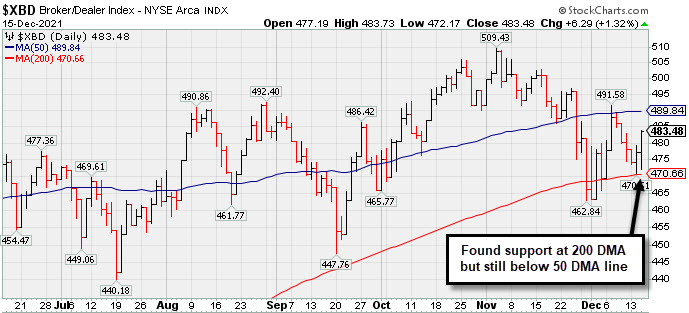
The tech sector saw solid gains from the Semiconductor Index ($SOX +3.69%), Networking Index ($NWX +3.06%), and the Biotech Index ($BTK +2.59%). The Retail Index ($RLX +1.91%) and Broker/Dealer Index ($XBD +1.32%) both provided a positive influence on the major averages while the Bank Index ($BKX +0.18%) posted a smaller gain. The Oil Services Index ($OSX +0.17%) and Integrated Oil Index ($XOI +0.10%) both inched higher, meanwhile, the Gold & Silver Index ($XAU -1.52%) slumped and was a standout decliner.
PICTURED: The Broker/Dealer Index ($XBD +1.32%) found support above its 200-day moving average (DMA) line but remains below its 50 DMA line. Subsequent improvement above the 50 DMA line would be a reassuring sign. Meanwhile, and damaging losses would raise serious concerns, especially since the financial indexes have served as reliable "leading indicators" for the broader market.
| Oil Services |
$OSX |
51.92 |
+0.09 |
+0.17% |
+17.12% |
| Integrated Oil |
$XOI |
1,150.29 |
+1.12 |
+0.10% |
+45.15% |
| Semiconductor |
$SOX |
3,934.46 |
+140.05 |
+3.69% |
+40.74% |
| Networking |
$NWX |
934.56 |
+27.74 |
+3.06% |
+30.32% |
| Broker/Dealer |
$XBD |
483.48 |
+6.29 |
+1.32% |
+28.04% |
| Retail |
$RLX |
4,291.54 |
+80.50 |
+1.91% |
+20.44% |
| Gold & Silver |
$XAU |
120.43 |
-1.86 |
-1.52% |
-16.48% |
| Bank |
$BKX |
131.81 |
+0.24 |
+0.18% |
+34.62% |
| Biotech |
$BTK |
5,482.14 |
+138.39 |
+2.59% |
-4.48% |
|
|
|
 |
Closed Above 50-Day Average After Big Gain With Light Volume
Kenneth J. Gruneisen - Passed the CAN SLIM® Master's Exam
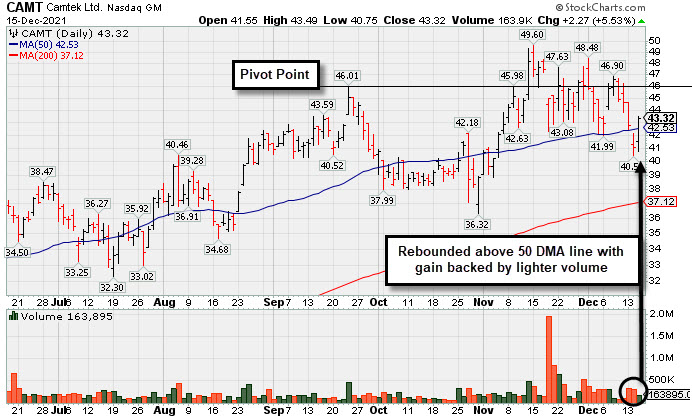
Camtek Ltd (CAMT +$2.27 or +5.53% to $43.32) rebounded above its 50-day moving average (DMA) line ($42.53) helping its outlook improve, but there was lighter than average volume behind today's gain. It still faces some near-term resistance due to overhead supply up to the $49 level.
Fundamentals remain strong. Recently it reported Sep '21 quarterly earnings +150% versus the year ago period, continuing its strong earnings track record. That marked its 5th strong quarterly comparison well above the +25% minimum guideline (C criteria) and showing impressive sequential acceleration. This Israeli Electronics firm has a strong annual earnings (A criteria) history. It has a 98 Earnings Per Share Rating.
CAMT was first highlighted in yellow with pivot point cited based on its 4/13/21 high plus 10 cents in the 4/28/21 mid-day report (read here). A new pivot point was cited based on its 9/23/21 high as it showed resilience after shown in this FSU section on 11/05/21 with an annotated graph included under the headline, "Rebound Above 50-Day Moving Average Helped Outlook".
The number of top-rated funds owning its shares rose from 48 in Jun '20 to 109 on Sep '21 a reassuring sign concerning the I criteria. Its current Up/Down Volume Ratio of 0.6 is an unbiased indication its shares have been under distributional pressure over the past 50 days. It completed a new Public Offering on 11/19/20. Still, its small supply of only 43.7 million shares outstanding (S criteria) can contribute to greater price volatility in the event of institutional buying or selling. It has a Timeliness Rating of A and a Sponsorship Rating of C. |
|
|
Color Codes Explained :
Y - Better candidates highlighted by our
staff of experts.
G - Previously featured
in past reports as yellow but may no longer be buyable under the
guidelines.
***Last / Change / Volume data in this table is the closing quote data***
Symbol/Exchange
Company Name
Industry Group |
PRICE |
CHANGE
(%Change) |
Day High |
Volume
(% DAV)
(% 50 day avg vol) |
52 Wk Hi
% From Hi |
Featured
Date |
Price
Featured |
Pivot Featured |
|
Max Buy |
 BLDR
-
NYSE
BLDR
-
NYSE
Builders Firstsource Inc
Bldg-Constr Prds/Misc
|
$78.26
|
+1.62
2.11% |
$78.36
|
2,834,965
125.00% of 50 DAV
50 DAV is 2,268,000
|
$80.95
-3.32%
|
8/12/2021
|
$52.38
|
PP = $54.09
|
|
MB = $56.79
|
Most Recent Note - 12/10/2021 5:00:43 PM
G - Perched at its all-time high after today's 5th consecutive volume-driven gain, very extended from any sound base. Reported Sep '21 quarterly earnings +308% on +140% sales revenues versus the year ago period. It is well above its 50 DMA line ($64.17). See the latest FSU analysis for more details and a new annotated graph.
>>> FEATURED STOCK ARTICLE : Perched at Record High After +52% Rally in 4 Months - 12/10/2021 |
View all notes |
Set NEW NOTE alert |
Company Profile |
SEC
News |
Chart |
Request a new note
C
A
S
I |
KFRC
-
NASDAQ
Kforce Inc
Comml Svcs-Staffing
|
$74.40
|
+2.79
3.90% |
$74.70
|
123,524
113.32% of 50 DAV
50 DAV is 109,000
|
$81.47
-8.68%
|
9/10/2021
|
$59.53
|
PP = $64.48
|
|
MB = $67.70
|
 Most Recent Note - 12/15/2021 5:43:11 PM
G - Posted a solid gain today with average volume, finding prompt support at its 50 DMA line ($71.67). Recently reported Sep '21 quarterly earnings +8% on +10% sales revenues versus the year ago period, below the +25% minimum earnings guideline (C criteria), raising fundamental concerns.
>>> FEATURED STOCK ARTICLE : Extended From Base and Latest Quarter Earnings Growth Sub Par - 11/19/2021 |
View all notes |
Set NEW NOTE alert |
Company Profile |
SEC
News |
Chart |
Request a new note
C
A
S
I |
REGN
-
NASDAQ
Regeneron Pharmaceutical
DRUGS - Biotechnology
|
$657.93
|
-13.04
-1.94% |
$662.63
|
841,242
109.39% of 50 DAV
50 DAV is 769,000
|
$686.62
-4.18%
|
12/13/2021
|
$647.95
|
PP = $686.72
|
|
MB = $721.06
|
Most Recent Note - 12/13/2021 1:00:05 PM
Y - Color code is changed to yellow with new pivot point cited based on its 9/01/21 high plus 10 cents. Gapped down today yet it remains perched within striking distance of its all-time high. Subsequent gains above the pivot point backed by at least +40% above average volume may trigger a technical buy signal. Its Relative Strength rating has improved to 90, well above the 80+ minimum guideline for buy candidates. Found support at its 200 DMA line and rebounded since dropped from the Featured Stocks List on 10/01/21. The market direction (M criteria) remains a concern regarding any new buying until a new confirmed rally with a follow-through day."
>>> FEATURED STOCK ARTICLE : Consolidating Near All-Time High With Little Resistance Remaining - 12/13/2021 |
View all notes |
Set NEW NOTE alert |
Company Profile |
SEC
News |
Chart |
Request a new note
C
A
S
I |
CAMT
-
NASDAQ
Camtek Ltd
ELECTRONICS - Scientific and Technical Instrum
|
$43.32
|
+2.27
5.53% |
$43.49
|
163,895
63.77% of 50 DAV
50 DAV is 257,000
|
$49.60
-12.66%
|
11/9/2021
|
$45.43
|
PP = $46.11
|
|
MB = $48.42
|
Most Recent Note - 12/15/2021 5:37:10 PM
G - Prompt gain above its DMA line ($42.53) today with lighter volume helped its outlook improve. Faces resistance due to overhead supply up to the $49 level. Fundamentals remain strong. See the latest FSU analysis for more detailed analysis and a new annotated graph.
>>> FEATURED STOCK ARTICLE : Closed Above 50-Day Average After Big Gain With Light Volume - 12/15/2021 |
View all notes |
Set NEW NOTE alert |
Company Profile |
SEC
News |
Chart |
Request a new note
C
A
S
I |
AMD
-
NASDAQ
Advanced Micro Devices
ELECTRONICS - Semiconductor - Broad Line
|
$146.50
|
+10.90
8.04% |
$146.69
|
71,847,699
130.35% of 50 DAV
50 DAV is 55,117,000
|
$164.46
-10.92%
|
10/27/2021
|
$124.91
|
PP = $122.59
|
|
MB = $128.72
|
Most Recent Note - 12/13/2021 5:21:43 PM
G - Suffered another big loss today with below average volume, testing its 50 DMA line ($132.54) which defines important support to watch. Fundamentals remain strong after it reported Sep '21 quarterly earnings +78% on +54% sales revenues versus the year ago period.
>>> FEATURED STOCK ARTICLE : AMD Pulling Back After Considerable Rally - 12/1/2021 |
View all notes |
Set NEW NOTE alert |
Company Profile |
SEC
News |
Chart |
Request a new note
C
A
S
I |
Symbol/Exchange
Company Name
Industry Group |
PRICE |
CHANGE
(%Change) |
Day High |
Volume
(% DAV)
(% 50 day avg vol) |
52 Wk Hi
% From Hi |
Featured
Date |
Price
Featured |
Pivot Featured |
|
Max Buy |
UMC
-
NYSE
United Microelectrnc Adr
ELECTRONICS - Semiconductor - Integrated Cir
|
$11.47
|
+0.39
3.52% |
$11.47
|
7,632,023
92.95% of 50 DAV
50 DAV is 8,211,000
|
$12.68
-9.54%
|
12/1/2021
|
$12.60
|
PP = $12.72
|
|
MB = $13.36
|
Most Recent Note - 12/15/2021 5:50:25 PM
Y - Posted a 2nd consecutive gain today, finding prompt support at its 50 DMA line ($11.06). More damaging losses would raise concerns. A gain and solid close above the pivot point may help clinch a proper new (or add-on) technical buy signal. Reported Sep '21 quarterly earnings +100% on +30% sales revenues versus the year ago period.
>>> FEATURED STOCK ARTICLE : Rebound Above 50-Day Moving Average Showed Resilience - 11/30/2021 |
View all notes |
Set NEW NOTE alert |
Company Profile |
SEC
News |
Chart |
Request a new note
C
A
S
I |
ENTG
-
NASDAQ
Entegris Inc
ELECTRONICS - Semiconductor Equipment and Mate
|
$142.54
|
-0.68
-0.47% |
$143.03
|
4,352,023
420.89% of 50 DAV
50 DAV is 1,034,000
|
$158.00
-9.78%
|
8/4/2021
|
$125.33
|
PP = $126.51
|
|
MB = $132.84
|
Most Recent Note - 12/15/2021 12:21:29 PM
G - Gapped down today violating its 50 DMA line ($141) with a big volume-driven loss triggering a technical sell signal. Fundamentals remain strong after it recently reported Sep '21 quarterly earnings +37% on +20% sales revenues versus the year ago period.
>>> FEATURED STOCK ARTICLE : Best Ever Close After Volume-Driven Gain - 11/29/2021 |
View all notes |
Set NEW NOTE alert |
Company Profile |
SEC
News |
Chart |
Request a new note
C
A
S
I |
SKY
-
NYSE
Skyline Champion Corp
Bldg-Mobile/Mfg andamp; RV
|
$75.91
|
-1.42
-1.84% |
$77.20
|
1,085,279
263.42% of 50 DAV
50 DAV is 412,000
|
$85.92
-11.65%
|
11/3/2021
|
$72.19
|
PP = $66.92
|
|
MB = $70.27
|
Most Recent Note - 12/14/2021 5:26:51 PM
G - Suffered a 2nd consecutive volume-driven loss today, encountering distributional pressure. Its 50 DMA line ($71.72) defines important near-term support to watch above prior highs in the $66 area. Fundamentals remain strong. See the latest FSU analysis for more details and a new annotated graph.
>>> FEATURED STOCK ARTICLE : Pulling Back From All-Time High After Recent Rally - 12/14/2021 |
View all notes |
Set NEW NOTE alert |
Company Profile |
SEC
News |
Chart |
Request a new note
C
A
S
I |
DHI
-
NYSE
D R Horton Inc
MATERIALS and CONSTRUCTION - Residential Construction
|
$107.37
|
+2.63
2.51% |
$107.60
|
6,699,611
261.70% of 50 DAV
50 DAV is 2,560,000
|
$110.45
-2.79%
|
12/6/2021
|
$104.40
|
PP = $106.99
|
|
MB = $112.34
|
Most Recent Note - 12/14/2021 1:03:39 PM
Y - Pulling back with higher volume after reaching a new all-time high with its 12/10/21 gain backed by +31% above average volume. Highlighted in yellow with pivot point cited based on its 5/10/21 high plus 10 cents in the 12/06/21 mid-day report. Reported Sep '21 earnings +68% on +27% sales revenues versus the year-ago period, its 8th strong quarterly comparison above the +25% minimum guideline (C criteria). Annual earnings growth (A criteria) has been strong. The market direction (M criteria) remains a concern regarding any new buying until a new confirmed rally with a follow-through day.
>>> FEATURED STOCK ARTICLE : Builder Built a Solid Base And Challenged Prior High - 12/6/2021 |
View all notes |
Set NEW NOTE alert |
Company Profile |
SEC
News |
Chart |
Request a new note
C
A
S
I |
TITN
-
NASDAQ
Titan Machinery Inc
SPECIALTY RETAIL
|
$33.08
|
+0.17
0.52% |
$33.40
|
214,468
131.58% of 50 DAV
50 DAV is 163,000
|
$38.58
-14.26%
|
11/23/2021
|
$36.22
|
PP = $35.34
|
|
MB = $37.11
|
Most Recent Note - 12/13/2021 5:23:25 PM
G - Suffered another loss today on higher (near average) volume, still slumping back into the prior base. Reported Oct '21 quarterly earnings +81% on +26% sales revenues over the year ago period, its 4th strong quarterly comparison.
>>> FEATURED STOCK ARTICLE : Strong Close With Gain Backed by +467% Above Average Volume - 11/23/2021 |
View all notes |
Set NEW NOTE alert |
Company Profile |
SEC
News |
Chart |
Request a new note
C
A
S
I |
Symbol/Exchange
Company Name
Industry Group |
PRICE |
CHANGE
(%Change) |
Day High |
Volume
(% DAV)
(% 50 day avg vol) |
52 Wk Hi
% From Hi |
Featured
Date |
Price
Featured |
Pivot Featured |
|
Max Buy |
CLFD
-
NASDAQ
Clearfield Inc
TELECOMMUNICATIONS - Cables / Satalite Equipment
|
$70.51
|
+4.45
6.74% |
$70.79
|
148,154
116.66% of 50 DAV
50 DAV is 127,000
|
$72.00
-2.07%
|
7/23/2021
|
$40.23
|
PP = $43.74
|
|
MB = $45.93
|
Most Recent Note - 12/15/2021 5:39:55 PM
G - Posted a 2nd consecutive big gain today with near average volume and managed a best-ever close. Recently found support well above its 50 DMA line ($60.48) when consolidating. Reported Sep '21 quarterly earnings +141% on +66% sales revenues above the year ago period.
>>> FEATURED STOCK ARTICLE : Perched Near High Extended From Any Sound Base - 11/22/2021 |
View all notes |
Set NEW NOTE alert |
Company Profile |
SEC
News |
Chart |
Request a new note
C
A
S
I |
ODFL
-
NASDAQ
Old Dominion Fght Line
TRANSPORTATION - Trucking
|
$353.57
|
+1.49
0.42% |
$356.44
|
540,960
91.69% of 50 DAV
50 DAV is 590,000
|
$373.58
-5.36%
|
12/7/2021
|
$365.61
|
PP = $364.17
|
|
MB = $382.38
|
Most Recent Note - 12/13/2021 5:17:35 PM
Y - Hovering in a tight range near its all-time high. Subsequent volume-driven gains are needed to clinch a buy signal, and the broader market direction (M criteria) remains a concern until a follow-through day. Reported earnings +44% on +32% sales revenues for the Sep '21 quarter, its 5th consecutive comparison above the +25% minimum guideline (C criteria).
>>> FEATURED STOCK ARTICLE : Perched at All Time High After Tight Consolidation Several Weeks - 12/7/2021 |
View all notes |
Set NEW NOTE alert |
Company Profile |
SEC
News |
Chart |
Request a new note
C
A
S
I |
SMPL
-
NASDAQ
Simply Good Foods Co
Food-Confectionery
|
$37.84
|
-0.08
-0.21% |
$38.04
|
366,977
99.18% of 50 DAV
50 DAV is 370,000
|
$41.35
-8.49%
|
10/25/2021
|
$38.30
|
PP = $38.60
|
|
MB = $40.53
|
Most Recent Note - 12/14/2021 5:28:42 PM
G - Still sputtering near its 50 DMA line ($37.83). The prior low and 200 DMA line ($35.37) define the next important support.
>>> FEATURED STOCK ARTICLE : Consolidating Above Prior High Following Recent Technical Breakout - 11/15/2021 |
View all notes |
Set NEW NOTE alert |
Company Profile |
SEC
News |
Chart |
Request a new note
C
A
S
I |
WDAY
-
NYSE
Workday Inc Cl A
Computer Sftwr-Enterprse
|
$279.22
|
+5.87
2.15% |
$280.45
|
1,733,803
108.93% of 50 DAV
50 DAV is 1,591,600
|
$307.81
-9.29%
|
9/7/2021
|
$275.69
|
PP = $282.87
|
|
MB = $297.01
|
Most Recent Note - 12/14/2021 1:46:25 PM
G - Color code is changed to green after slumping below its 50 DMA line ($279) with today's big loss. Prior low ($258.22 on 12/06/21) and 200 DMA line ($253.25) define the next important support to watch. Reported Oct '21 quarterly earnings +28% on +20% sales revenues versus the year ago period. Fundamentals remain strong.
>>> FEATURED STOCK ARTICLE : Getting Extended From Previously Noted Base - 11/16/2021 |
View all notes |
Set NEW NOTE alert |
Company Profile |
SEC
News |
Chart |
Request a new note
C
A
S
I |
CTLT
-
NYSE
"Catalent, Inc"
DRUGS - Biotechnology
|
$127.08
|
+4.70
3.84% |
$127.77
|
1,016,202
111.23% of 50 DAV
50 DAV is 913,600
|
$142.62
-10.90%
|
8/25/2021
|
$128.72
|
PP = $127.78
|
|
MB = $134.17
|
Most Recent Note - 12/15/2021 5:41:38 PM
G - Posted a solid gain today with +11% above average volume. A rebound above its 50 DMA line ($129) is still needed for its outlook to improve. Prior low ($119) and 200 DMA line ($118) define important near-term support to watch. More damaging losses would raise greater concerns. Its Relative Strength Rating is 78, below the 80+ minimum guideline for buy candidates. Fundamentals remain strong after it reported Sep '21 quarterly earnings +65% on +21% sales revenues versus the year ago period, continuing its strong earnings track record.
>>> FEATURED STOCK ARTICLE : Recent Violation of 50-Day Moving Average Triggered Sell Signal - 11/11/2021 |
View all notes |
Set NEW NOTE alert |
Company Profile |
SEC
News |
Chart |
Request a new note
C
A
S
I |
Symbol/Exchange
Company Name
Industry Group |
PRICE |
CHANGE
(%Change) |
Day High |
Volume
(% DAV)
(% 50 day avg vol) |
52 Wk Hi
% From Hi |
Featured
Date |
Price
Featured |
Pivot Featured |
|
Max Buy |
TTD
-
NASDAQ
The Trade Desk Inc Cl A
Comml Svcs-Advertising
|
$91.43
|
+3.10
3.51% |
$92.16
|
4,358,660
82.41% of 50 DAV
50 DAV is 5,289,000
|
$114.09
-19.86%
|
11/9/2021
|
$95.16
|
PP = $90.00
|
|
MB = $94.50
|
Most Recent Note - 12/15/2021 5:48:07 PM
G - Posted a gain today with below average volume. Found prompt support after briefly undercutting the prior high ($90) and testing its 50 DMA line ($87.65) which defines important support to watch.
>>> FEATURED STOCK ARTICLE : Powerful Volume-Driven Gains for New Highs - 11/9/2021 |
View all notes |
Set NEW NOTE alert |
Company Profile |
SEC
News |
Chart |
Request a new note
C
A
S
I |
MEDP
-
NASDAQ
Medpace Holdings Inc
Medical-Research Eqp/Svc
|
$210.32
|
+7.82
3.86% |
$210.63
|
144,783
91.63% of 50 DAV
50 DAV is 158,000
|
$231.00
-8.95%
|
9/10/2021
|
$196.32
|
PP = $196.22
|
|
MB = $206.03
|
Most Recent Note - 12/15/2021 5:44:54 PM
G - Posted a solid gain today and rebounded above its 50 DMA line ($208.34) helping its outlook improve. Prior highs in the $199 area define important near-term support to watch. More damaging losses may trigger a worrisome technical sell signal. Recently noted repeatedly - "Sep '21 earnings rose +18% on +28% sales revenues versus the year ago period, below the +25% minimum earnings guideline (C criteria), raising fundamental concerns.
>>> FEATURED STOCK ARTICLE : Medpace Hovering at High With Volume Totals Cooling - 11/17/2021 |
View all notes |
Set NEW NOTE alert |
Company Profile |
SEC
News |
Chart |
Request a new note
C
A
S
I |
JEF
-
NYSE
Jefferies Financial Grp
Finance-Invest Bnk/Bkrs
|
$38.57
|
+0.07
0.18% |
$38.68
|
841,402
55.32% of 50 DAV
50 DAV is 1,521,000
|
$44.47
-13.27%
|
6/28/2021
|
$31.81
|
PP = $34.42
|
|
MB = $36.14
|
Most Recent Note - 12/9/2021 5:56:09 PM
G - Still sputtering with volume totals cooling, meanwhile, a rebound above the 50 DMA line ($40.83) is needed for its outlook to improve. Reported Aug '21 quarterly earnings +40% on +20% sales revenues versus the year ago period. See the latest FSU analysis for more details and a new annotated graph.
>>> FEATURED STOCK ARTICLE : Volume Totals Cooling While Lingering Below 50-Day Moving Average - 12/9/2021 |
View all notes |
Set NEW NOTE alert |
Company Profile |
SEC
News |
Chart |
Request a new note
C
A
S
I |
AVTR
-
NYSE
Avantor Inc
Medical-Research Eqp/Svc
|
$39.75
|
+1.42
3.70% |
$39.81
|
6,408,102
176.53% of 50 DAV
50 DAV is 3,630,000
|
$44.37
-10.41%
|
6/10/2021
|
$32.94
|
PP = $34.09
|
|
MB = $35.79
|
Most Recent Note - 12/15/2021 5:46:34 PM
G - Posted a solid volume-driven gain today rebounding above its 50 DMA line ($39) helping its technical stance improve. Faces overhead supply up to the $44 level. Prior lows in the high $36 area define important near-term support. Reported Sep '21 quarterly earnings +46% above the year ago period. Completed a Secondary Offering on 9/13/21.
>>> FEATURED STOCK ARTICLE : Faces Resistance While Sputtering Below 50 DMA Line - 11/12/2021 |
View all notes |
Set NEW NOTE alert |
Company Profile |
SEC
News |
Chart |
Request a new note
C
A
S
I |
MIME
-
NASDAQ
Mimecast Limited
Computer Sftwr-Security
|
$79.36
|
-0.10
-0.13% |
$79.67
|
5,026,398
483.77% of 50 DAV
50 DAV is 1,039,000
|
$85.48
-7.16%
|
10/18/2021
|
$68.17
|
PP = $71.55
|
|
MB = $75.13
|
Most Recent Note - 12/15/2021 12:42:40 PM
G - Holding its ground after a gap up on 12/07/21 M&A news. Found prompt support at its 50 DMA line ($75.14). More damaging losses would raise concerns and trigger technical sell signals.
>>> FEATURED STOCK ARTICLE : Extended From Latest Base While Fundamentals Remain Strong - 11/26/2021 |
View all notes |
Set NEW NOTE alert |
Company Profile |
SEC
News |
Chart |
Request a new note
C
A
S
I |
Symbol/Exchange
Company Name
Industry Group |
PRICE |
CHANGE
(%Change) |
Day High |
Volume
(% DAV)
(% 50 day avg vol) |
52 Wk Hi
% From Hi |
Featured
Date |
Price
Featured |
Pivot Featured |
|
Max Buy |
|
|
|
THESE ARE NOT BUY RECOMMENDATIONS!
Comments contained in the body of this report are technical
opinions only. The material herein has been obtained
from sources believed to be reliable and accurate, however,
its accuracy and completeness cannot be guaranteed.
This site is not an investment advisor, hence it does
not endorse or recommend any securities or other investments.
Any recommendation contained in this report may not
be suitable for all investors and it is not to be deemed
an offer or solicitation on our part with respect to
the purchase or sale of any securities. All trademarks,
service marks and trade names appearing in this report
are the property of their respective owners, and are
likewise used for identification purposes only.
This report is a service available
only to active Paid Premium Members.
You may opt-out of receiving report notifications
at any time. Questions or comments may be submitted
by writing to Premium Membership Services 665 S.E. 10 Street, Suite 201 Deerfield Beach, FL 33441-5634 or by calling 1-800-965-8307
or 954-785-1121.
|
|
|