You are not logged in.
This means you
CAN ONLY VIEW reports that were published prior to Sunday, March 30, 2025.
You
MUST UPGRADE YOUR MEMBERSHIP if you want to see any current reports.
AFTER MARKET UPDATE - MONDAY, DECEMBER 6TH, 2021
Previous After Market Report Next After Market Report >>>
|
|
|
|
DOW |
+646.95 |
35,227.03 |
+1.87% |
|
Volume |
1,054,033,040 |
-4% |
|
Volume |
5,066,382,000 |
-13% |
|
NASDAQ |
+139.68 |
15,225.15 |
+0.93% |
|
Advancers |
2,425 |
74% |
|
Advancers |
2,887 |
63% |
|
S&P 500 |
+53.24 |
4,591.67 |
+1.17% |
|
Decliners |
839 |
26% |
|
Decliners |
1,666 |
37% |
|
Russell 2000 |
+44.17 |
2,203.48 |
+2.05% |
|
52 Wk Highs |
53 |
|
|
52 Wk Highs |
42 |
|
|
S&P 600 |
+32.35 |
1,374.16 |
+2.41% |
|
52 Wk Lows |
137 |
|
|
52 Wk Lows |
657 |
|
|
Concerns have grown as the major indices are now in a market correction (M criteria). Disciplined investors know to preserve capital by following sell rules designed to lock in gains and limit losses. New buying efforts should avoided until there is a new confirmed rally marked by a solid follow-through day.
|
 |
Major Indices Rose With Lighter Volume Totals on Exchanges
Kenneth J. Gruneisen - Passed the CAN SLIM® Master's Exam
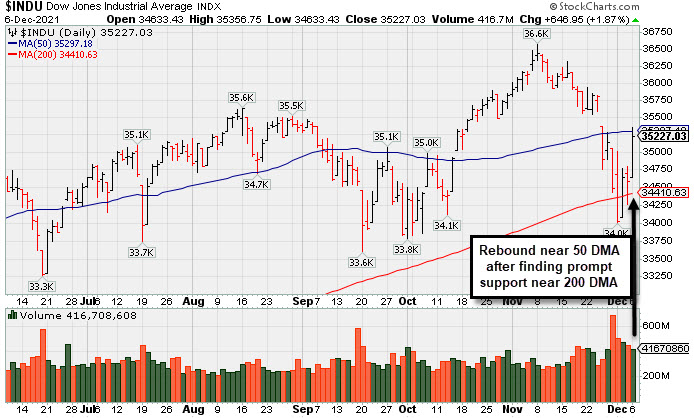
The Dow jumped 646 points, while the S&P 500 increased 1.2%, with both benchmarks recouping last week’s decline. The tech-heavy Nasdaq Composite rebounded 0.9% after suffering a 2.6% weekly slide. The volume totals for Monday's session were lower than the prior session on the NYSE and on the Nasdaq exchange, revealing lackluster institutional buying demand. Breadth was positive as advancers led decliners by almost a 3-1 margin on the NYSE and 7-4 on the Nasdaq exchange. There were 19 high-ranked companies from the Leaders List that hit new 52-week highs and were listed on the BreakOuts Page versus 13 on the prior session. New 52-week lows totals solidly outnumbered new 52-week highs totals on the NYSE and on the Nasdaq exchange. Noted weakness has signaled a more worrisome market correction (M criteria). Investors are reminded to avoid new buying efforts and raise cash levels by selling stocks that weaken on a case-by-case basis as dictated by the rules of the fact-based investment system.
PICTURED: The Dow Jones Industrial Average rebounded near its 50-day moving average (DMA) line after finding prompt support near its 200 DMA line. Gains have been backed by lighter volume after damaging volume-driven losses.
U.S. stocks bounced higher in a broad-based relief rally on Monday. The more cyclical-oriented stocks outperformed on encouraging pandemic headlines. Preliminary data suggested the Omicron COVID-19 variant appeared to cause relatively milder infections than originally thought. All 11 S&P 500 sectors closed in positive territory. Stocks tied to economic reopenings outperformed, with shares of airlines, cruise line operators, and casinos among the standouts. The Health Care group lagged on a relative basis, with Moderna (MRNA -13.49%) creating a big drag and pressuring the Nasdaq Biotech Index to its lowest level since November 2020.
Treasuries weakened, with the yield on the 10-year note spiking eight basis points (0.08%) to 1.44%. In commodities, WTI crude advanced 5.5% to $69.89/barrel amid the prospect of higher demand. Elsewhere, Bitcoin stabilized near $49,000 after falling as low as $42,000 over the weekend.
Recent market turbulence has been driven by uncertainty surrounding the latest Omicron coronavirus strain, along with a perceived hawkish pivot from Federal Reserve (Fed) Chair Jerome Powell. Also clouding the outlook, Friday’s jobs report showed non-farm payrolls rose by the smallest margin of the year in November, though the unemployment rate fell to a pandemic low of 4.2%. This week, an update on consumer prices will highlight the docket data docket (Friday), while the Fed remains in a “quiet period” ahead of next week’s meeting—during which time officials could announce plans to expedite their tapering timeline in light of persistent inflation. |
 Kenneth J. Gruneisen started out as a licensed stockbroker in August 1987, a couple of months prior to the historic stock market crash that took the Dow Jones Industrial Average down -22.6% in a single day. He has published daily fact-based fundamental and technical analysis on high-ranked stocks online for two decades. Through FACTBASEDINVESTING.COM, Kenneth provides educational articles, news, market commentary, and other information regarding proven investment systems that work in good times and bad.
Comments contained in the body of this report are technical opinions only and are not necessarily those of Gruneisen Growth Corp. The material herein has been obtained from sources believed to be reliable and accurate, however, its accuracy and completeness cannot be guaranteed. Our firm, employees, and customers may effect transactions, including transactions contrary to any recommendation herein, or have positions in the securities mentioned herein or options with respect thereto. Any recommendation contained in this report may not be suitable for all investors and it is not to be deemed an offer or solicitation on our part with respect to the purchase or sale of any securities. |
|
 |
Financial, Retail, and Commodity-Linked Groups Led Rebound
Kenneth J. Gruneisen - Passed the CAN SLIM® Master's Exam
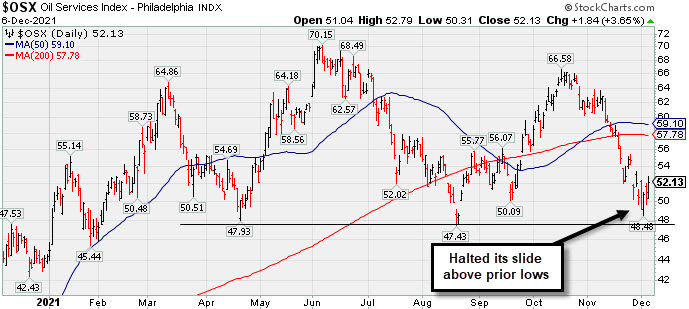
The Broker/Dealer Index ($XBD +1.83%) and Bank Index ($BKX +1.93%) posted influential gains while the Retail Index ($RLX +1.07%) also helped give the major averages a boost. Commodity-linked groups had a positive bias as the Oil Services Index ($OSX +3.65%), Integrated Oil Index ($XOI +1.89%), and Gold & Silver Index ($XAU +1.36%) posted unanimous gains. The tech sector was indecisive as the Networking Index ($NWX +0.37%) edged higher while the Semiconductor Index ($SOX -0.12%) and Biotech Index ($BTK -0.13%) both ended the session slightly lower.
PICTURED: The Oil Services Index ($OSX +3.65%) posted a solid gain on Monday. It recently halted its slide above the prior lows.
| Oil Services |
$OSX |
52.13 |
+1.84 |
+3.65% |
+17.60% |
| Integrated Oil |
$XOI |
1,164.71 |
+21.60 |
+1.89% |
+46.97% |
| Semiconductor |
$SOX |
3,800.07 |
-4.46 |
-0.12% |
+35.94% |
| Networking |
$NWX |
864.81 |
+3.20 |
+0.37% |
+20.59% |
| Broker/Dealer |
$XBD |
477.87 |
+8.59 |
+1.83% |
+26.55% |
| Retail |
$RLX |
4,265.86 |
+45.01 |
+1.07% |
+19.72% |
| Gold & Silver |
$XAU |
127.23 |
+1.71 |
+1.36% |
-11.76% |
| Bank |
$BKX |
132.92 |
+2.51 |
+1.93% |
+35.76% |
| Biotech |
$BTK |
5,217.76 |
-6.92 |
-0.13% |
-9.08% |
|
|
|
 |
Builder Built a Solid Base And Challenged Prior High
Kenneth J. Gruneisen - Passed the CAN SLIM® Master's Exam
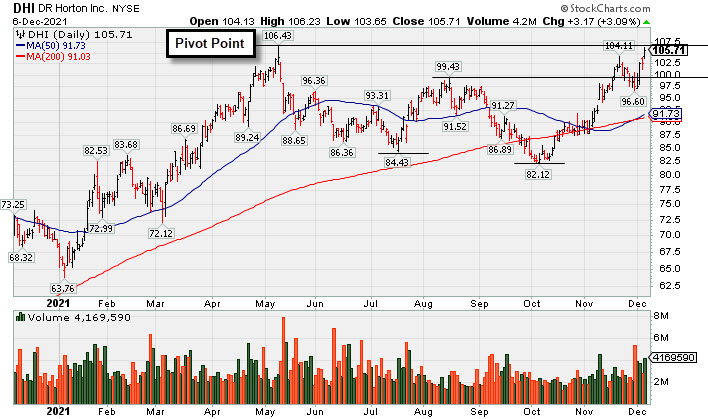
D R Horton Inc (DHI +$3.17 or +3.09% to $105.71) posted a solid gain backed by +70% above average volume and managed a best-ever close after highlighted in the earlier mid-day report (read here) in yellow with pivot point cited based on its 5/10/21 high plus 10 cents. It challenged its all-time high with today's volume-driven gain and no resistance remains due to overhead supply. Recently it rallied from a double bottom base. Disciplined investors will note that the market direction (M criteria) remains a concern regarding any new buying until a new confirmed rally with a follow-through day.
Reported Sep '21 earnings +68% on +27% sales revenues versus the year-ago period, its 8th strong quarterly comparison above the +25% minimum guideline (C criteria). Annual earnings growth (A criteria) has been strong. The market direction (M criteria) remains a concern regarding any new buying until a new confirmed rally with a follow-through day.
The company hails from the Building - Residential/Commercial industry which is currently ranked 66th on the 197 Industry Groups list (L criteria). The number of top-rated funds owning its shares rose from 1,834 in Dec '20 to 1,957 in Sep '21, a reassuring sign concerning the I criteria. Its current up/Down Volume Ratio of 1.2 is an unbiased indication its shares have been under accumulation over the past 50 days. It has a Timeliness Rating of A and Sponsorship Rating of B.
|
|
|
Color Codes Explained :
Y - Better candidates highlighted by our
staff of experts.
G - Previously featured
in past reports as yellow but may no longer be buyable under the
guidelines.
***Last / Change / Volume data in this table is the closing quote data***
Symbol/Exchange
Company Name
Industry Group |
PRICE |
CHANGE
(%Change) |
Day High |
Volume
(% DAV)
(% 50 day avg vol) |
52 Wk Hi
% From Hi |
Featured
Date |
Price
Featured |
Pivot Featured |
|
Max Buy |
 BLDR
-
NYSE
BLDR
-
NYSE
Builders Firstsource Inc
Bldg-Constr Prds/Misc
|
$73.38
|
+2.27
3.19% |
$74.47
|
2,839,204
139.18% of 50 DAV
50 DAV is 2,040,000
|
$74.41
-1.38%
|
8/12/2021
|
$52.38
|
PP = $54.09
|
|
MB = $56.79
|
Most Recent Note - 12/3/2021 5:03:46 PM
G - There was a "negative reversal" today after touching a new all-time high, getting very extended from any sound base. Reported Sep '21 quarterly earnings +308% on +140% sales revenues versus the year ago period. It is well above its 50 DMA line ($61.88) and prior highs in the $55 area.
>>> FEATURED STOCK ARTICLE : Earnings News Due Thursday for High-Ranked Building Products Firm - 11/2/2021 |
View all notes |
Set NEW NOTE alert |
Company Profile |
SEC
News |
Chart |
Request a new note
C
A
S
I |
KFRC
-
NASDAQ
Kforce Inc
Comml Svcs-Staffing
|
$73.54
|
+0.43
0.59% |
$74.32
|
89,254
85.00% of 50 DAV
50 DAV is 105,000
|
$81.47
-9.73%
|
9/10/2021
|
$59.53
|
PP = $64.48
|
|
MB = $67.70
|
Most Recent Note - 12/3/2021 5:16:56 PM
G - Pulled back with lighter volume today slumping toward its 50 DMA line ($69.86) which defines important near-term support to watch. Recently reported Sep '21 quarterly earnings +8% on +10% sales revenues versus the year ago period, below the +25% minimum earnings guideline (C criteria), raising fundamental concerns.
>>> FEATURED STOCK ARTICLE : Extended From Base and Latest Quarter Earnings Growth Sub Par - 11/19/2021 |
View all notes |
Set NEW NOTE alert |
Company Profile |
SEC
News |
Chart |
Request a new note
C
A
S
I |
CAMT
-
NASDAQ
Camtek Ltd
ELECTRONICS - Scientific and Technical Instrum
|
$42.95
|
-0.45
-1.04% |
$43.55
|
282,248
112.90% of 50 DAV
50 DAV is 250,000
|
$49.60
-13.41%
|
11/9/2021
|
$45.43
|
PP = $46.11
|
|
MB = $48.42
|
Most Recent Note - 12/3/2021 5:05:37 PM
Y - Slumped below prior highs with today's 4th consecutive loss testing support near its 50 DMA line ($42.11). More damaging losses would raise greater concerns. Weak action came after recently proposing a new $140 Million note offering. Fundamentals remain strong.
>>> FEATURED STOCK ARTICLE : Rebound Above 50-Day Moving Average Helped Outlook - 11/5/2021 |
View all notes |
Set NEW NOTE alert |
Company Profile |
SEC
News |
Chart |
Request a new note
C
A
S
I |
AMD
-
NASDAQ
Advanced Micro Devices
ELECTRONICS - Semiconductor - Broad Line
|
$139.06
|
-4.95
-3.44% |
$141.31
|
66,639,364
121.04% of 50 DAV
50 DAV is 55,056,000
|
$164.46
-15.44%
|
10/27/2021
|
$124.91
|
PP = $122.59
|
|
MB = $128.72
|
 Most Recent Note - 12/6/2021 5:32:16 PM
G - Suffered a 4th volume-driven loss in the span of 5 sessions, retreating from record high territory. Its 50 DMA line ($128.84) and prior high in the $122 area define important support to watch on pullbacks. Fundamentals remain strong after it reported Sep '21 quarterly earnings +78% on +54% sales revenues versus the year ago period.
>>> FEATURED STOCK ARTICLE : AMD Pulling Back After Considerable Rally - 12/1/2021 |
View all notes |
Set NEW NOTE alert |
Company Profile |
SEC
News |
Chart |
Request a new note
C
A
S
I |
UMC
-
NYSE
United Microelectrnc Adr
ELECTRONICS - Semiconductor - Integrated Cir
|
$12.04
|
-0.04
-0.33% |
$12.07
|
6,088,161
76.78% of 50 DAV
50 DAV is 7,929,000
|
$12.68
-5.05%
|
12/1/2021
|
$12.60
|
PP = $12.72
|
|
MB = $13.36
|
Most Recent Note - 12/1/2021 12:58:01 PM
Y - Color code is changed to yellow with new pivot point cited based on its 9/03/21 high plus 10 cents. Hitting a new all-time high while posting a 3rd consecutive gain today with ever increasing volume after consolidating above its 50 DMA line ($11.03). A gain and solid close above the pivot point may clinch a new (or add-on) technical buy signal. Reported Sep '21 quarterly earnings +100% on +30% sales revenues versus the year ago period. Recently found support above its 200 DMA line ($10.08).
>>> FEATURED STOCK ARTICLE : Rebound Above 50-Day Moving Average Showed Resilience - 11/30/2021 |
View all notes |
Set NEW NOTE alert |
Company Profile |
SEC
News |
Chart |
Request a new note
C
A
S
I |
Symbol/Exchange
Company Name
Industry Group |
PRICE |
CHANGE
(%Change) |
Day High |
Volume
(% DAV)
(% 50 day avg vol) |
52 Wk Hi
% From Hi |
Featured
Date |
Price
Featured |
Pivot Featured |
|
Max Buy |
ENTG
-
NASDAQ
Entegris Inc
ELECTRONICS - Semiconductor Equipment and Mate
|
$145.29
|
-2.75
-1.86% |
$148.00
|
905,984
85.88% of 50 DAV
50 DAV is 1,055,000
|
$158.00
-8.04%
|
8/4/2021
|
$125.33
|
PP = $126.51
|
|
MB = $132.84
|
Most Recent Note - 12/3/2021 5:14:14 PM
G - Suffered a big loss today with near average volume. Very extended from any sound base, its 50 DMA line ($138.41) and prior high ($136) define important near-term support to watch. Fundamentals remain strong after it recently reported Sep '21 quarterly earnings +37% on +20% sales revenues versus the year ago period.
>>> FEATURED STOCK ARTICLE : Best Ever Close After Volume-Driven Gain - 11/29/2021 |
View all notes |
Set NEW NOTE alert |
Company Profile |
SEC
News |
Chart |
Request a new note
C
A
S
I |
SKY
-
NYSE
Skyline Champion Corp
Bldg-Mobile/Mfg andamp; RV
|
$81.99
|
+3.33
4.23% |
$82.02
|
560,500
146.34% of 50 DAV
50 DAV is 383,000
|
$82.90
-1.10%
|
11/3/2021
|
$72.19
|
PP = $66.92
|
|
MB = $70.27
|
Most Recent Note - 12/6/2021 5:33:47 PM
G - Posted a volume-driven gain today for a best-ever close. Its 50 DMA line ($69.39) and prior highs in the $66 area define important near-term support to watch. Reported very strong Mar, Jun and Sep '21 quarterly results versus the year ago periods well above the +25% minimum earnings guideline (C criteria). Annual earnings (A criteria) history has been strong.
>>> FEATURED STOCK ARTICLE : Breakaway Gap After 10-Week Flat Base - 11/3/2021 |
View all notes |
Set NEW NOTE alert |
Company Profile |
SEC
News |
Chart |
Request a new note
C
A
S
I |
DHI
-
NYSE
D R Horton Inc
MATERIALS and CONSTRUCTION - Residential Construction
|
$105.71
|
+3.17
3.09% |
$106.23
|
4,169,590
170.40% of 50 DAV
50 DAV is 2,447,000
|
$106.89
-1.10%
|
12/6/2021
|
$104.40
|
PP = $106.99
|
|
MB = $112.34
|
Most Recent Note - 12/6/2021 5:24:53 PM
Y - Managed a best ever close today after highlighted in yellow with pivot point cited based on its 5/10/21 high plus 10 cents in the earlier mid-day report. Challenged its all-time high and no resistance remains due to overhead supply. Recently rallied from a double bottom. Reported Sep '21 earnings +68% on +27% sales revenues versus the year-ago period, its 8th strong quarterly comparison above the +25% minimum guideline (C criteria). Annual earnings growth (A criteria) has been strong. The market direction (M criteria) remains a concern regarding any new buying until a new confirmed rally with a follow-through day. See the latest FSU analysis for more details and a new annotated graph.
>>> FEATURED STOCK ARTICLE : Builder Built a Solid Base And Challenged Prior High - 12/6/2021 |
View all notes |
Set NEW NOTE alert |
Company Profile |
SEC
News |
Chart |
Request a new note
C
A
S
I |
WSM
-
NYSE
Williams Sonoma Inc
RETAIL - Home Furnishing Stores
|
$177.47
|
-3.53
-1.95% |
$182.12
|
1,115,697
121.40% of 50 DAV
50 DAV is 919,000
|
$223.32
-20.53%
|
11/3/2021
|
$205.00
|
PP = $195.09
|
|
MB = $204.84
|
Most Recent Note - 12/6/2021 5:30:37 PM
G - Color code is changed to green after slumping below its 50 DMA line ($191) triggering a technical sell signal during a streak of 5 consecutive losses marked by above average volume. A rebound above he 50 DMA line is needed for its outlook to improve. Fundamental remain strong after it reported Oct '21 quarterly earnings +30% on +16% sales revenues versus the year ago period.
>>> FEATURED STOCK ARTICLE : Volume-Driven Gains May Signal a New Meaningful Leg Up - 11/4/2021 |
View all notes |
Set NEW NOTE alert |
Company Profile |
SEC
News |
Chart |
Request a new note
C
A
S
I |
TITN
-
NASDAQ
Titan Machinery Inc
SPECIALTY RETAIL
|
$33.13
|
+0.93
2.89% |
$33.60
|
150,124
96.23% of 50 DAV
50 DAV is 156,000
|
$38.58
-14.13%
|
11/23/2021
|
$36.22
|
PP = $35.34
|
|
MB = $37.11
|
Most Recent Note - 12/6/2021 5:39:22 PM
G - Showing resilience but gains have lacked great volume after slumping back into the prior base with volume-driven losses. Reported Oct '21 quarterly earnings +81% on +26% sales revenues over the year ago period, its 4th strong quarterly comparison.
>>> FEATURED STOCK ARTICLE : Strong Close With Gain Backed by +467% Above Average Volume - 11/23/2021 |
View all notes |
Set NEW NOTE alert |
Company Profile |
SEC
News |
Chart |
Request a new note
C
A
S
I |
Symbol/Exchange
Company Name
Industry Group |
PRICE |
CHANGE
(%Change) |
Day High |
Volume
(% DAV)
(% 50 day avg vol) |
52 Wk Hi
% From Hi |
Featured
Date |
Price
Featured |
Pivot Featured |
|
Max Buy |
CLFD
-
NASDAQ
Clearfield Inc
TELECOMMUNICATIONS - Cables / Satalite Equipment
|
$61.23
|
-1.54
-2.45% |
$62.83
|
116,435
92.41% of 50 DAV
50 DAV is 126,000
|
$72.00
-14.96%
|
7/23/2021
|
$40.23
|
PP = $43.74
|
|
MB = $45.93
|
Most Recent Note - 12/3/2021 5:06:27 PM
G - Still extended from the previously noted base. Its 50 DMA line ($57.25) defines near-term support to watch on pullbacks. Reported Sep '21 quarterly earnings +141% on +66% sales revenues above the year ago period.
>>> FEATURED STOCK ARTICLE : Perched Near High Extended From Any Sound Base - 11/22/2021 |
View all notes |
Set NEW NOTE alert |
Company Profile |
SEC
News |
Chart |
Request a new note
C
A
S
I |
ENPH
-
NASDAQ
Enphase Energy Inc
Energy-Solar
|
$212.94
|
-4.16
-1.92% |
$217.42
|
2,534,067
105.81% of 50 DAV
50 DAV is 2,395,000
|
$282.46
-24.61%
|
10/28/2021
|
$218.00
|
PP = $229.14
|
|
MB = $240.60
|
Most Recent Note - 12/3/2021 5:12:43 PM
G - Color code is changed to green after today's 4th consecutive volume-driven loss undercut the prior high ($229) raising concerns while slumping back into the prior base. The next important support to watch is its 50 DMA line ($206.85). See the latest FSU analysis for more details and an annotated graph.
>>> FEATURED STOCK ARTICLE : Pullback Testing Near Prior High - 12/2/2021 |
View all notes |
Set NEW NOTE alert |
Company Profile |
SEC
News |
Chart |
Request a new note
C
A
S
I |
SMPL
-
NASDAQ
Simply Good Foods Co
Food-Confectionery
|
$37.22
|
+0.41
1.11% |
$37.46
|
290,621
78.97% of 50 DAV
50 DAV is 368,000
|
$41.35
-9.99%
|
10/25/2021
|
$38.30
|
PP = $38.60
|
|
MB = $40.53
|
Most Recent Note - 12/1/2021 4:44:41 PM
G - Color code is changed to green after today's 4th consecutive loss, slumping below prior highs in the $38 area and violating its 50 DMA line ($37.43) triggering technical sell signals. Only a prompt rebound above the 50 DMA line would help its outlook improve.
>>> FEATURED STOCK ARTICLE : Consolidating Above Prior High Following Recent Technical Breakout - 11/15/2021 |
View all notes |
Set NEW NOTE alert |
Company Profile |
SEC
News |
Chart |
Request a new note
C
A
S
I |
WDAY
-
NYSE
Workday Inc Cl A
Computer Sftwr-Enterprse
|
$269.09
|
+2.10
0.79% |
$269.46
|
1,989,253
124.64% of 50 DAV
50 DAV is 1,596,000
|
$307.81
-12.58%
|
9/7/2021
|
$275.69
|
PP = $282.87
|
|
MB = $297.01
|
Most Recent Note - 12/3/2021 1:05:12 PM
G - Color code is changed to green after slumping below prior highs in the $278-282 area and further below its 50 DMA line. Damaging losses noted triggered a technical sell signal. Its Relative Strength Rating has slumped to 78, below the 80+ minimum guideline for buy candidates. A rebound above the 50 DMA line is needed for its outlook to improve. Reported Oct '21 quarterly earnings +28% on +20% sales revenues versus the year ago period. Fundamentals remain strong.
>>> FEATURED STOCK ARTICLE : Getting Extended From Previously Noted Base - 11/16/2021 |
View all notes |
Set NEW NOTE alert |
Company Profile |
SEC
News |
Chart |
Request a new note
C
A
S
I |
CTLT
-
NYSE
"Catalent, Inc"
DRUGS - Biotechnology
|
$120.86
|
-1.61
-1.31% |
$122.74
|
1,074,029
117.70% of 50 DAV
50 DAV is 912,500
|
$142.64
-15.27%
|
8/25/2021
|
$128.72
|
PP = $127.78
|
|
MB = $134.17
|
Most Recent Note - 12/3/2021 5:08:23 PM
G - Slumped further below its 50 DMA line ($130.55) with todays loss. Testing near the prior low ($119) and 200 DMA line ($117.95) which define important near-term support to watch. More damaging losses would raise greater concerns. Its Relative Strength Rating is 83, above the 80+ minimum guideline for buy candidates. Fundamentals remain strong after it reported Sep '21 quarterly earnings +65% on +21% sales revenues versus the year ago period, continuing its strong earnings track record.
>>> FEATURED STOCK ARTICLE : Recent Violation of 50-Day Moving Average Triggered Sell Signal - 11/11/2021 |
View all notes |
Set NEW NOTE alert |
Company Profile |
SEC
News |
Chart |
Request a new note
C
A
S
I |
Symbol/Exchange
Company Name
Industry Group |
PRICE |
CHANGE
(%Change) |
Day High |
Volume
(% DAV)
(% 50 day avg vol) |
52 Wk Hi
% From Hi |
Featured
Date |
Price
Featured |
Pivot Featured |
|
Max Buy |
TTD
-
NASDAQ
The Trade Desk Inc Cl A
Comml Svcs-Advertising
|
$89.63
|
+0.12
0.13% |
$91.82
|
4,785,333
90.12% of 50 DAV
50 DAV is 5,310,000
|
$114.09
-21.44%
|
11/9/2021
|
$95.16
|
PP = $90.00
|
|
MB = $94.50
|
Most Recent Note - 12/3/2021 5:28:58 PM
Y - Color code is changed to yellow after falling near the prior high ($90) with today's big loss on near average volume. More damaging losses would raise serious concerns and its 50 DMA line ($84.04) defines additional support to watch.
>>> FEATURED STOCK ARTICLE : Powerful Volume-Driven Gains for New Highs - 11/9/2021 |
View all notes |
Set NEW NOTE alert |
Company Profile |
SEC
News |
Chart |
Request a new note
C
A
S
I |
MEDP
-
NASDAQ
Medpace Holdings Inc
Medical-Research Eqp/Svc
|
$204.98
|
-1.16
-0.56% |
$207.05
|
184,719
114.02% of 50 DAV
50 DAV is 162,000
|
$231.00
-11.26%
|
9/10/2021
|
$196.32
|
PP = $196.22
|
|
MB = $206.03
|
Most Recent Note - 12/3/2021 5:23:32 PM
G - Quietly sputtering near its "max buy" level while testing its 50 DMA line ($205.78). More damaging losses may trigger a technical sell signal. As recently noted, Sep '21 earnings rose +18% on +28% sales revenues versus the year ago period, below the +25% minimum earnings guideline (C criteria), raising fundamental concerns. Below its 50 DMA line the prior highs in the $199 area define important near-term support to watch.
>>> FEATURED STOCK ARTICLE : Medpace Hovering at High With Volume Totals Cooling - 11/17/2021 |
View all notes |
Set NEW NOTE alert |
Company Profile |
SEC
News |
Chart |
Request a new note
C
A
S
I |
JEF
-
NYSE
Jefferies Financial Grp
Finance-Invest Bnk/Bkrs
|
$38.68
|
+0.57
1.50% |
$39.31
|
1,354,905
79.89% of 50 DAV
50 DAV is 1,696,000
|
$44.47
-13.02%
|
6/28/2021
|
$31.81
|
PP = $34.42
|
|
MB = $36.14
|
Most Recent Note - 12/3/2021 5:15:19 PM
G - Today's loss was backed by lighter volume. A rebound above the 50 DMA line ($40.73) is needed for its outlook to improve. Reported Aug '21 quarterly earnings +40% on +20% sales revenues versus the year ago period.
>>> FEATURED STOCK ARTICLE : Extended From Prior Highs and Stubbornly Holding Ground - 11/1/2021 |
View all notes |
Set NEW NOTE alert |
Company Profile |
SEC
News |
Chart |
Request a new note
C
A
S
I |
AVTR
-
NYSE
Avantor Inc
Medical-Research Eqp/Svc
|
$38.13
|
-0.14
-0.37% |
$38.38
|
2,710,082
69.31% of 50 DAV
50 DAV is 3,910,000
|
$44.37
-14.06%
|
6/10/2021
|
$32.94
|
PP = $34.09
|
|
MB = $35.79
|
Most Recent Note - 12/3/2021 4:58:29 PM
G - Slumping below its 50 DMA line ($39.31). Prior lows and its 200 DMA line define important support in the $36 area. A rebound above the 50 DMA line is needed for its outlook to improve, and it faces overhead supply up to the $44 level. Reported Sep '21 quarterly earnings +46% above the year ago period. Completed a Secondary Offering on 9/13/21.
>>> FEATURED STOCK ARTICLE : Faces Resistance While Sputtering Below 50 DMA Line - 11/12/2021 |
View all notes |
Set NEW NOTE alert |
Company Profile |
SEC
News |
Chart |
Request a new note
C
A
S
I |
MIME
-
NASDAQ
Mimecast Limited
Computer Sftwr-Security
|
$75.00
|
+1.13
1.53% |
$75.56
|
1,031,236
177.80% of 50 DAV
50 DAV is 580,000
|
$85.48
-12.26%
|
10/18/2021
|
$68.17
|
PP = $71.55
|
|
MB = $75.13
|
Most Recent Note - 12/3/2021 12:48:22 PM
Y - Color code is changed to yellow after pulling back below its "max buy" level with today's loss. Testing near its 50 DMA line ($72.89) and prior highs in the $71 area which define important near-term support to watch. More damaging losses would raise concerns and trigger technical sell signals.
>>> FEATURED STOCK ARTICLE : Extended From Latest Base While Fundamentals Remain Strong - 11/26/2021 |
View all notes |
Set NEW NOTE alert |
Company Profile |
SEC
News |
Chart |
Request a new note
C
A
S
I |
Symbol/Exchange
Company Name
Industry Group |
PRICE |
CHANGE
(%Change) |
Day High |
Volume
(% DAV)
(% 50 day avg vol) |
52 Wk Hi
% From Hi |
Featured
Date |
Price
Featured |
Pivot Featured |
|
Max Buy |
AZTA
-
NASDAQ
"Azenta, Inc."
ELECTRONICS - Semiconductor Equipment
|
$105.39
|
-0.94
-0.88% |
$106.61
|
589,492
106.31% of 50 DAV
50 DAV is 554,500
|
$124.79
-15.55%
|
9/20/2021
|
$101.21
|
PP = $108.82
|
|
MB = $114.26
|
Most Recent Note - 12/3/2021 5:01:23 PM
G - Color code is changed to green after slumping below prior highs and its 50 DMA line with volume-driven losses triggering technical sell signals. Only a prompt rebound above the 50 DMA line would help its outlook improve. Azenta Inc. (AZTA), formerly was Brooks Automation Inc., (BRKS). The company had said on Nov. 16 that it was changing its name to Azenta, following the launch of the Azenta Life Sciences brand, and after announcing in September that it was selling its semiconductor automation business to Thomas H. Lee Partners. Reported Sep 21 quarterly earnings +33% on +27% sales revenues versus the year ago period.
There are no Featured Stock Updates™ available for this stock at this time. You may request one by clicking the Request a New Note link below |
View all notes |
Set NEW NOTE alert |
Company Profile |
SEC
News |
Chart |
Request a new note
C
A
S
I |
|
|
|
THESE ARE NOT BUY RECOMMENDATIONS!
Comments contained in the body of this report are technical
opinions only. The material herein has been obtained
from sources believed to be reliable and accurate, however,
its accuracy and completeness cannot be guaranteed.
This site is not an investment advisor, hence it does
not endorse or recommend any securities or other investments.
Any recommendation contained in this report may not
be suitable for all investors and it is not to be deemed
an offer or solicitation on our part with respect to
the purchase or sale of any securities. All trademarks,
service marks and trade names appearing in this report
are the property of their respective owners, and are
likewise used for identification purposes only.
This report is a service available
only to active Paid Premium Members.
You may opt-out of receiving report notifications
at any time. Questions or comments may be submitted
by writing to Premium Membership Services 665 S.E. 10 Street, Suite 201 Deerfield Beach, FL 33441-5634 or by calling 1-800-965-8307
or 954-785-1121.
|
|
|