You are not logged in.
This means you
CAN ONLY VIEW reports that were published prior to Thursday, April 17, 2025.
You
MUST UPGRADE YOUR MEMBERSHIP if you want to see any current reports.
AFTER MARKET UPDATE - THURSDAY, DECEMBER 9TH, 2021
Previous After Market Report Next After Market Report >>>
|
|
|
|
DOW |
-0.06 |
35,754.69 |
-0.00% |
|
Volume |
819,887,397 |
-7% |
|
Volume |
4,447,334,000 |
-3% |
|
NASDAQ |
-269.62 |
15,517.37 |
-1.71% |
|
Advancers |
810 |
25% |
|
Advancers |
1,159 |
25% |
|
S&P 500 |
-33.76 |
4,667.45 |
-0.72% |
|
Decliners |
2,467 |
75% |
|
Decliners |
3,456 |
75% |
|
Russell 2000 |
-51.50 |
2,220.21 |
-2.27% |
|
52 Wk Highs |
49 |
|
|
52 Wk Highs |
59 |
|
|
S&P 600 |
-23.15 |
1,377.35 |
-1.65% |
|
52 Wk Lows |
53 |
|
|
52 Wk Lows |
89 |
|
|
Concerns have grown as the major indices are now in a market correction (M criteria). Disciplined investors know to preserve capital by following sell rules designed to lock in gains and limit losses. New buying efforts should be avoided until a new confirmed rally is noted marked by a solid follow-through day.
|
 |
Breadth Negative as Major Averages Fall With Lighter Volume
Kenneth J. Gruneisen - Passed the CAN SLIM® Master's Exam
The S&P 500 dipped 0.7% after yesterday capping its best three-day stretch of gains in over a year (+3.6%). The broad benchmark remains on track to log its strongest five-day advance since February. The Dow was little changed, heading for its best weekly performance in nearly six months. Meanwhile, the Nasdaq Composite slumped 1.7%, closing near session lows. The volume totals were reported lower than the prior session on the NYSE and on the Nasdaq exchange, revealing less institutional selling pressure. But breadth was clearly negative as decliners led advancers by a 3-1 margin on the NYSE and on the Nasdaq exchange. There were 19 high-ranked companies from the Leaders List that hit new 52-week highs and were listed on the BreakOuts Page versus 32 on the prior session. New 52-week lows outnumbered new 52-week highs totals on the NYSE and on the Nasdaq exchange. Recent weakness signaled a more worrisome market correction (M criteria). A proper follow-through day requires a solid gain from at least one of the major averages backed by higher volume coupled with an increase in the number of stocks hitting new 52-week highs over the prior session. Until then, investors are reminded to avoid new buying efforts and raise cash levels by selling stocks that weaken on a case-by-case basis as dictated by the rules of the fact-based investment system.
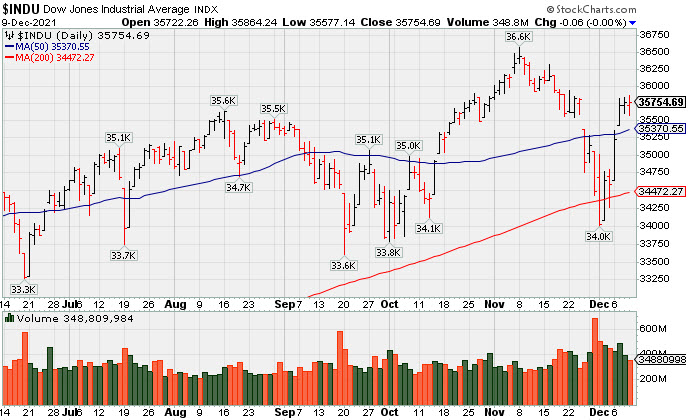
PICTURED: The Dow Jones Industrial Average saw lighter volume behind a small loss on Thursday, which marked Day 6 of its rally attempt. It found prompt support near its 200-day moving average (DMA) line and rebounded above its 50 DMA line.
U.S. stocks finished lower on Thursday as Wall Street took a breather from the week’s rally. Despite the losses, stocks have largely rebounded from Omicron-related weakness as recent data suggested that current vaccines could provide some degree of protection against the more transmissible coronavirus variant.
Investors are turning their attention to Friday’s key inflation data in the form of the consumer price index (CPI), which could have implications for monetary policy at the Federal Reserve meeting next week. On the data front today, weekly initial jobless claims came in at a smaller-than-expected 184,000, marking a fresh 52-year low. Separately, a final reading on wholesale inventories was upwardly revised to reflect a 2.3% advance in October. Treasuries strengthened, with the yield on the 10-year note down four basis points (0.04%) to 1.49%.
Nine of 11 S&P 500 sectors ended in negative territory. Consumer Discretionary stocks lagged with Tesla (TSLA -6.10%) falling. Health Care outperformed with CVS Health (CVS +4.52%) up after announcing its first dividend increase since 2017. In earnings, RH (RH +5.47%) rose after easily exceeding top and bottom line projections. In commodities, WTI crude slumping 2.5% to $70.53/barrel, though still on track for a 6.4% weekly gain. |
 Kenneth J. Gruneisen started out as a licensed stockbroker in August 1987, a couple of months prior to the historic stock market crash that took the Dow Jones Industrial Average down -22.6% in a single day. He has published daily fact-based fundamental and technical analysis on high-ranked stocks online for two decades. Through FACTBASEDINVESTING.COM, Kenneth provides educational articles, news, market commentary, and other information regarding proven investment systems that work in good times and bad.
Comments contained in the body of this report are technical opinions only and are not necessarily those of Gruneisen Growth Corp. The material herein has been obtained from sources believed to be reliable and accurate, however, its accuracy and completeness cannot be guaranteed. Our firm, employees, and customers may effect transactions, including transactions contrary to any recommendation herein, or have positions in the securities mentioned herein or options with respect thereto. Any recommendation contained in this report may not be suitable for all investors and it is not to be deemed an offer or solicitation on our part with respect to the purchase or sale of any securities. |
|
 |
Gold & Silver, Biotech, and Semiconductor Indexes Led Decliners
Kenneth J. Gruneisen - Passed the CAN SLIM® Master's Exam
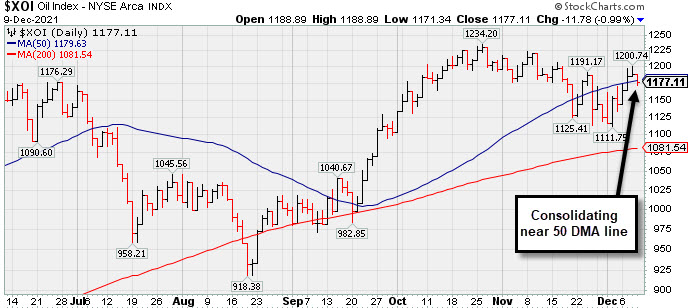
The Broker/Dealer Index ($XBD -1.21%) and Retail Index ($RLX -0.81%) created a drag on the major averages while the Bank Index ($BKX -0.15%) inched lower. The tech sector was mixed as the Semiconductor Index ($SOX -2.14%) and Biotech Index ($BTK -2.09%) both suffered large losses, meanwhile the Networking Index ($NWX +2.11%) posted a standout gain. Commodity-linked groups were weak as the Gold & Silver Index ($XAU -2.86%) outpaced the Oil Services Index ($OSX -0.86%) and Integrated Oil Index ($XOI -0.99%) to the downside.
PICTURED: The Integrated Oil Index ($XOI -0.99%) is consolidating near its 50-day moving average (DMA) line.
| Oil Services |
$OSX |
54.30 |
-0.47 |
-0.86% |
+22.48% |
| Integrated Oil |
$XOI |
1,177.11 |
-11.78 |
-0.99% |
+48.54% |
| Semiconductor |
$SOX |
3,879.52 |
-84.93 |
-2.14% |
+38.78% |
| Networking |
$NWX |
910.78 |
+18.82 |
+2.11% |
+27.01% |
| Broker/Dealer |
$XBD |
480.08 |
-5.89 |
-1.21% |
+27.14% |
| Retail |
$RLX |
4,310.88 |
-35.39 |
-0.81% |
+20.98% |
| Gold & Silver |
$XAU |
125.20 |
-3.69 |
-2.86% |
-13.17% |
| Bank |
$BKX |
133.59 |
-0.21 |
-0.15% |
+36.44% |
| Biotech |
$BTK |
5,325.99 |
-113.47 |
-2.09% |
-7.20% |
|
|
|
 |
Volume Totals Cooling While Lingering Below 50-Day Moving Average
Kenneth J. Gruneisen - Passed the CAN SLIM® Master's Exam
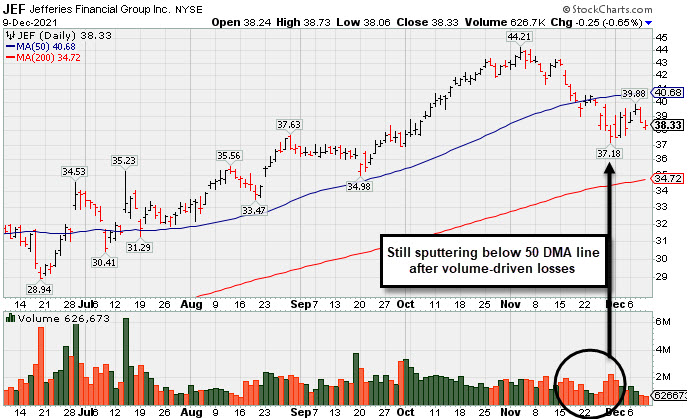
Jefferies Financial Grp (JEF -$0.25 or -0.65% to $38.33) is still sputtering with volume totals cooling, meanwhile, a rebound above the 50-day moving average (DMA) line ($40.83) is needed for its outlook to improve.
Fundamentals remain strong after it reported Aug '21 quarterly earnings +40% on +20% sales revenues versus the year ago period, its 5th strong quarterly comparison with solid earnings increases and sales revenues growth. Its annual earnings history (the A criteria) has been strong. It has an Earnings Per Share Rating of 97.
JEF traded up as much as +39.8% after highlighted in yellow in the 6/28/21 mid-day report (read here) with pivot point cited based on its 5/10/21 high while building on a 14-week "double bottom" base. However, it stalled and has slumped considerably triggering noted technical sell signals in recent weeks since last shown in this FSU section on 11/01/21 with an annotated graph under the headline, "Extended From Prior Highs and Stubbornly Holding Ground".
JEF hails from the Finance-Invest Bnk/Bkrs industry which is currently ranked 72nd on the 197 Industry Groups list (L criteria). Its Up/Down Volume Ration of 1.5 is an unbiased indication its shares have been under accumulation over the past 50 days, but its current Accumulation/Distribution Rating is D-. The number of top-rated funds that own its shares fell from 724 in Jun '21 to 718 in Sep '21, also a concern regarding the I criteria. It has a Timeliness Rating of B and a Sponsorship Rating of C. |
|
|
Color Codes Explained :
Y - Better candidates highlighted by our
staff of experts.
G - Previously featured
in past reports as yellow but may no longer be buyable under the
guidelines.
***Last / Change / Volume data in this table is the closing quote data***
Symbol/Exchange
Company Name
Industry Group |
PRICE |
CHANGE
(%Change) |
Day High |
Volume
(% DAV)
(% 50 day avg vol) |
52 Wk Hi
% From Hi |
Featured
Date |
Price
Featured |
Pivot Featured |
|
Max Buy |
 BLDR
-
NYSE
BLDR
-
NYSE
Builders Firstsource Inc
Bldg-Constr Prds/Misc
|
$77.75
|
+1.27
1.66% |
$79.00
|
2,811,176
129.01% of 50 DAV
50 DAV is 2,179,000
|
$80.95
-3.95%
|
8/12/2021
|
$52.38
|
PP = $54.09
|
|
MB = $56.79
|
Most Recent Note - 12/8/2021 11:50:24 AM
G - Perched at its all-time high with today's 3rd consecutive volume-driven gain, very extended from any sound base. Reported Sep '21 quarterly earnings +308% on +140% sales revenues versus the year ago period. It is well above its 50 DMA line ($63.13).
>>> FEATURED STOCK ARTICLE : Earnings News Due Thursday for High-Ranked Building Products Firm - 11/2/2021 |
View all notes |
Set NEW NOTE alert |
Company Profile |
SEC
News |
Chart |
Request a new note
C
A
S
I |
KFRC
-
NASDAQ
Kforce Inc
Comml Svcs-Staffing
|
$72.71
|
-1.76
-2.36% |
$74.92
|
72,259
68.82% of 50 DAV
50 DAV is 105,000
|
$81.47
-10.75%
|
9/10/2021
|
$59.53
|
PP = $64.48
|
|
MB = $67.70
|
Most Recent Note - 12/8/2021 4:45:11 PM
G - Extended from any sound base and consolidating above its 50 DMA line ($70.56) which defines important near-term support to watch. Recently reported Sep '21 quarterly earnings +8% on +10% sales revenues versus the year ago period, below the +25% minimum earnings guideline (C criteria), raising fundamental concerns.
>>> FEATURED STOCK ARTICLE : Extended From Base and Latest Quarter Earnings Growth Sub Par - 11/19/2021 |
View all notes |
Set NEW NOTE alert |
Company Profile |
SEC
News |
Chart |
Request a new note
C
A
S
I |
CAMT
-
NASDAQ
Camtek Ltd
ELECTRONICS - Scientific and Technical Instrum
|
$44.88
|
-1.72
-3.69% |
$46.69
|
75,916
29.77% of 50 DAV
50 DAV is 255,000
|
$49.60
-9.52%
|
11/9/2021
|
$45.43
|
PP = $46.11
|
|
MB = $48.42
|
 Most Recent Note - 12/9/2021 6:06:53 PM
Y - Volume totals have been cooling while consolidating after testing support near its 50 DMA line ($42.28) with 5 consecutive losses. More damaging losses would raise greater concerns. Fundamentals remain strong.
>>> FEATURED STOCK ARTICLE : Rebound Above 50-Day Moving Average Helped Outlook - 11/5/2021 |
View all notes |
Set NEW NOTE alert |
Company Profile |
SEC
News |
Chart |
Request a new note
C
A
S
I |
AMD
-
NASDAQ
Advanced Micro Devices
ELECTRONICS - Semiconductor - Broad Line
|
$138.10
|
-7.14
-4.92% |
$146.69
|
52,883,931
95.77% of 50 DAV
50 DAV is 55,220,000
|
$164.46
-16.03%
|
10/27/2021
|
$124.91
|
PP = $122.59
|
|
MB = $128.72
|
Most Recent Note - 12/9/2021 6:01:58 PM
G - Suffered another big loss today with higher (near average) volume. Its 50 DMA line ($131.20) defines important support to watch above the prior high in the $122 area. Fundamentals remain strong after it reported Sep '21 quarterly earnings +78% on +54% sales revenues versus the year ago period.
>>> FEATURED STOCK ARTICLE : AMD Pulling Back After Considerable Rally - 12/1/2021 |
View all notes |
Set NEW NOTE alert |
Company Profile |
SEC
News |
Chart |
Request a new note
C
A
S
I |
UMC
-
NYSE
United Microelectrnc Adr
ELECTRONICS - Semiconductor - Integrated Cir
|
$11.33
|
-0.36
-3.08% |
$11.71
|
7,193,675
87.25% of 50 DAV
50 DAV is 8,245,000
|
$12.68
-10.65%
|
12/1/2021
|
$12.60
|
PP = $12.72
|
|
MB = $13.36
|
Most Recent Note - 12/9/2021 6:15:26 PM
Y - Pulled back with lighter volume today for a 2nd consecutive loss. New pivot point cited was based on its 9/03/21 high plus 10 cents. Its 50 DMA line ($11.05) defines near-term support. A gain and solid close above the pivot point may clinch a new (or add-on) technical buy signal. Reported Sep '21 quarterly earnings +100% on +30% sales revenues versus the year ago period. Recently found support above its 200 DMA line ($10.14).
>>> FEATURED STOCK ARTICLE : Rebound Above 50-Day Moving Average Showed Resilience - 11/30/2021 |
View all notes |
Set NEW NOTE alert |
Company Profile |
SEC
News |
Chart |
Request a new note
C
A
S
I |
Symbol/Exchange
Company Name
Industry Group |
PRICE |
CHANGE
(%Change) |
Day High |
Volume
(% DAV)
(% 50 day avg vol) |
52 Wk Hi
% From Hi |
Featured
Date |
Price
Featured |
Pivot Featured |
|
Max Buy |
ENTG
-
NASDAQ
Entegris Inc
ELECTRONICS - Semiconductor Equipment and Mate
|
$146.65
|
-6.31
-4.13% |
$153.98
|
906,046
85.88% of 50 DAV
50 DAV is 1,055,000
|
$158.00
-7.18%
|
8/4/2021
|
$125.33
|
PP = $126.51
|
|
MB = $132.84
|
Most Recent Note - 12/9/2021 6:10:38 PM
G - Extended from any sound base, consolidating above its 50 DMA line ($140) which defines important near-term support to watch. Fundamentals remain strong after it recently reported Sep '21 quarterly earnings +37% on +20% sales revenues versus the year ago period.
>>> FEATURED STOCK ARTICLE : Best Ever Close After Volume-Driven Gain - 11/29/2021 |
View all notes |
Set NEW NOTE alert |
Company Profile |
SEC
News |
Chart |
Request a new note
C
A
S
I |
SKY
-
NYSE
Skyline Champion Corp
Bldg-Mobile/Mfg andamp; RV
|
$81.49
|
-2.41
-2.87% |
$84.80
|
566,567
140.94% of 50 DAV
50 DAV is 402,000
|
$85.92
-5.16%
|
11/3/2021
|
$72.19
|
PP = $66.92
|
|
MB = $70.27
|
Most Recent Note - 12/9/2021 5:58:05 PM
G - Pulled back today for a volume-driven loss, encountering distributional pressure. Its 50 DMA line ($70.57) and prior highs in the $66 area define important near-term support to watch. Reported very strong Mar, Jun and Sep '21 quarterly results versus the year ago periods well above the +25% minimum earnings guideline (C criteria). Annual earnings (A criteria) history has been strong.
>>> FEATURED STOCK ARTICLE : Breakaway Gap After 10-Week Flat Base - 11/3/2021 |
View all notes |
Set NEW NOTE alert |
Company Profile |
SEC
News |
Chart |
Request a new note
C
A
S
I |
DHI
-
NYSE
D R Horton Inc
MATERIALS and CONSTRUCTION - Residential Construction
|
$106.96
|
-0.02
-0.02% |
$108.87
|
1,996,986
80.62% of 50 DAV
50 DAV is 2,477,000
|
$108.09
-1.05%
|
12/6/2021
|
$104.40
|
PP = $106.99
|
|
MB = $112.34
|
Most Recent Note - 12/6/2021 5:24:53 PM
Y - Managed a best ever close today after highlighted in yellow with pivot point cited based on its 5/10/21 high plus 10 cents in the earlier mid-day report. Challenged its all-time high and no resistance remains due to overhead supply. Recently rallied from a double bottom. Reported Sep '21 earnings +68% on +27% sales revenues versus the year-ago period, its 8th strong quarterly comparison above the +25% minimum guideline (C criteria). Annual earnings growth (A criteria) has been strong. The market direction (M criteria) remains a concern regarding any new buying until a new confirmed rally with a follow-through day. See the latest FSU analysis for more details and a new annotated graph.
>>> FEATURED STOCK ARTICLE : Builder Built a Solid Base And Challenged Prior High - 12/6/2021 |
View all notes |
Set NEW NOTE alert |
Company Profile |
SEC
News |
Chart |
Request a new note
C
A
S
I |
WSM
-
NYSE
Williams Sonoma Inc
RETAIL - Home Furnishing Stores
|
$180.82
|
-1.84
-1.01% |
$189.61
|
1,157,999
124.65% of 50 DAV
50 DAV is 929,000
|
$223.32
-19.03%
|
11/3/2021
|
$205.00
|
PP = $195.09
|
|
MB = $204.84
|
Most Recent Note - 12/7/2021 5:52:22 PM
G - Posted a gain today with lighter volume halting a streak of 5 consecutive damaging volume-driven losses. A rebound above its 50 DMA line ($191) is needed for its outlook to improve. Fundamental remain strong after it reported Oct '21 quarterly earnings +30% on +16% sales revenues versus the year ago period.
>>> FEATURED STOCK ARTICLE : Volume-Driven Gains May Signal a New Meaningful Leg Up - 11/4/2021 |
View all notes |
Set NEW NOTE alert |
Company Profile |
SEC
News |
Chart |
Request a new note
C
A
S
I |
TITN
-
NASDAQ
Titan Machinery Inc
SPECIALTY RETAIL
|
$33.65
|
-0.29
-0.85% |
$34.10
|
190,640
121.43% of 50 DAV
50 DAV is 157,000
|
$38.58
-12.78%
|
11/23/2021
|
$36.22
|
PP = $35.34
|
|
MB = $37.11
|
Most Recent Note - 12/6/2021 5:39:22 PM
G - Showing resilience but gains have lacked great volume after slumping back into the prior base with volume-driven losses. Reported Oct '21 quarterly earnings +81% on +26% sales revenues over the year ago period, its 4th strong quarterly comparison.
>>> FEATURED STOCK ARTICLE : Strong Close With Gain Backed by +467% Above Average Volume - 11/23/2021 |
View all notes |
Set NEW NOTE alert |
Company Profile |
SEC
News |
Chart |
Request a new note
C
A
S
I |
Symbol/Exchange
Company Name
Industry Group |
PRICE |
CHANGE
(%Change) |
Day High |
Volume
(% DAV)
(% 50 day avg vol) |
52 Wk Hi
% From Hi |
Featured
Date |
Price
Featured |
Pivot Featured |
|
Max Buy |
CLFD
-
NASDAQ
Clearfield Inc
TELECOMMUNICATIONS - Cables / Satalite Equipment
|
$65.39
|
-0.91
-1.37% |
$67.31
|
60,728
47.44% of 50 DAV
50 DAV is 128,000
|
$72.00
-9.18%
|
7/23/2021
|
$40.23
|
PP = $43.74
|
|
MB = $45.93
|
Most Recent Note - 12/7/2021 5:37:07 PM
G - Posted a solid gain on below average volume today. Still extended from the previously noted base, consolidating above its 50 DMA line ($57.95) which defines near-term support to watch on pullbacks. Reported Sep '21 quarterly earnings +141% on +66% sales revenues above the year ago period.
>>> FEATURED STOCK ARTICLE : Perched Near High Extended From Any Sound Base - 11/22/2021 |
View all notes |
Set NEW NOTE alert |
Company Profile |
SEC
News |
Chart |
Request a new note
C
A
S
I |
ODFL
-
NASDAQ
Old Dominion Fght Line
TRANSPORTATION - Trucking
|
$354.75
|
-2.06
-0.58% |
$361.68
|
662,166
113.97% of 50 DAV
50 DAV is 581,000
|
$373.58
-5.04%
|
12/7/2021
|
$365.61
|
PP = $364.17
|
|
MB = $382.38
|
Most Recent Note - 12/7/2021 5:27:33 PM
Y - Finished in the middle of its intra-day range after hitting a new high today. Color code was changed to yellow after more than 3 weeks tight. Subsequent volume-driven gains are needed to clinch a buy signal, and the broader market direction (M criteria) remains a concern until a follow-through day. Reported earnings +44% on +32% sales revenues for the Sep '21 quarter, its 5th consecutive comparison above the +25% minimum guideline (C criteria). See the latest FSU analysis for more details and a new annotated graph.
>>> FEATURED STOCK ARTICLE : Perched at All Time High After Tight Consolidation Several Weeks - 12/7/2021 |
View all notes |
Set NEW NOTE alert |
Company Profile |
SEC
News |
Chart |
Request a new note
C
A
S
I |
ENPH
-
NASDAQ
Enphase Energy Inc
Energy-Solar
|
$216.35
|
-9.26
-4.10% |
$229.01
|
1,509,562
62.30% of 50 DAV
50 DAV is 2,423,000
|
$282.46
-23.41%
|
10/28/2021
|
$218.00
|
PP = $229.14
|
|
MB = $240.60
|
Most Recent Note - 12/9/2021 6:08:39 PM
G - Quietly consolidating above its 50 DMA line ($212). More damaging losses would raise serious concerns and trigger a technical sell signal. Undercut the prior high ($229) raising concerns while recently slumping back into the prior base.
>>> FEATURED STOCK ARTICLE : Pullback Testing Near Prior High - 12/2/2021 |
View all notes |
Set NEW NOTE alert |
Company Profile |
SEC
News |
Chart |
Request a new note
C
A
S
I |
SMPL
-
NASDAQ
Simply Good Foods Co
Food-Confectionery
|
$37.02
|
-0.92
-2.42% |
$38.30
|
365,387
100.66% of 50 DAV
50 DAV is 363,000
|
$41.35
-10.47%
|
10/25/2021
|
$38.30
|
PP = $38.60
|
|
MB = $40.53
|
Most Recent Note - 12/9/2021 6:23:47 PM
G - Today's loss with higher (average) volume led to a close back below its 50 DMA line ($37.68) hurting its technical stance, and its color code is changed to green, The prior low and 200 DMA line ($35.25) define the next important support.
>>> FEATURED STOCK ARTICLE : Consolidating Above Prior High Following Recent Technical Breakout - 11/15/2021 |
View all notes |
Set NEW NOTE alert |
Company Profile |
SEC
News |
Chart |
Request a new note
C
A
S
I |
WDAY
-
NASDAQ
Workday Inc Cl A
Computer Sftwr-Enterprse
|
$279.35
|
-2.95
-1.04% |
$285.58
|
1,371,534
85.56% of 50 DAV
50 DAV is 1,603,000
|
$307.81
-9.25%
|
9/7/2021
|
$275.69
|
PP = $282.87
|
|
MB = $297.01
|
Most Recent Note - 12/7/2021 5:50:23 PM
Y - Color code is changed to yellow after rebounding above its 50 DMA line with today's 4th consecutive gain helping its outlook improve. Its Relative Strength Rating has improved to 81, above the 80+ minimum guideline for buy candidates. Reported Oct '21 quarterly earnings +28% on +20% sales revenues versus the year ago period. Fundamentals remain strong.
>>> FEATURED STOCK ARTICLE : Getting Extended From Previously Noted Base - 11/16/2021 |
View all notes |
Set NEW NOTE alert |
Company Profile |
SEC
News |
Chart |
Request a new note
C
A
S
I |
Symbol/Exchange
Company Name
Industry Group |
PRICE |
CHANGE
(%Change) |
Day High |
Volume
(% DAV)
(% 50 day avg vol) |
52 Wk Hi
% From Hi |
Featured
Date |
Price
Featured |
Pivot Featured |
|
Max Buy |
CTLT
-
NYSE
"Catalent, Inc"
DRUGS - Biotechnology
|
$123.79
|
-3.67
-2.88% |
$127.25
|
580,615
62.93% of 50 DAV
50 DAV is 922,600
|
$142.64
-13.22%
|
8/25/2021
|
$128.72
|
PP = $127.78
|
|
MB = $134.17
|
Most Recent Note - 12/9/2021 6:19:25 PM
G - A rebound above its 50 DMA line ($129.56) is needed for its outlook to improve. Tested near the prior low ($119) and 200 DMA line ($118) which define important near-term support to watch. More damaging losses would raise greater concerns. Its Relative Strength Rating is 71, above the 80+ minimum guideline for buy candidates. Fundamentals remain strong after it reported Sep '21 quarterly earnings +65% on +21% sales revenues versus the year ago period, continuing its strong earnings track record.
>>> FEATURED STOCK ARTICLE : Recent Violation of 50-Day Moving Average Triggered Sell Signal - 11/11/2021 |
View all notes |
Set NEW NOTE alert |
Company Profile |
SEC
News |
Chart |
Request a new note
C
A
S
I |
TTD
-
NASDAQ
The Trade Desk Inc Cl A
Comml Svcs-Advertising
|
$94.51
|
-3.39
-3.46% |
$99.50
|
2,532,706
47.50% of 50 DAV
50 DAV is 5,332,000
|
$114.09
-17.16%
|
11/9/2021
|
$95.16
|
PP = $90.00
|
|
MB = $94.50
|
Most Recent Note - 12/9/2021 6:13:42 PM
G - Consolidating near its "max buy" level. It has not formed a sound base of sufficient length but found support near the prior high ($90). More damaging losses would raise serious concerns and its 50 DMA line ($85.81) defines additional support to watch.
>>> FEATURED STOCK ARTICLE : Powerful Volume-Driven Gains for New Highs - 11/9/2021 |
View all notes |
Set NEW NOTE alert |
Company Profile |
SEC
News |
Chart |
Request a new note
C
A
S
I |
MEDP
-
NASDAQ
Medpace Holdings Inc
Medical-Research Eqp/Svc
|
$206.34
|
-7.31
-3.42% |
$213.68
|
206,704
126.81% of 50 DAV
50 DAV is 163,000
|
$231.00
-10.68%
|
9/10/2021
|
$196.32
|
PP = $196.22
|
|
MB = $206.03
|
Most Recent Note - 12/9/2021 6:17:27 PM
G - Pulled back today with +21% above average volume and closed just below its 50 DMA line ($207). More damaging losses may trigger a worrisome technical sell signal. Prior highs in the $199 area define the next important near-term support to watch. Recently noted repeatedly - "Sep '21 earnings rose +18% on +28% sales revenues versus the year ago period, below the +25% minimum earnings guideline (C criteria), raising fundamental concerns.
>>> FEATURED STOCK ARTICLE : Medpace Hovering at High With Volume Totals Cooling - 11/17/2021 |
View all notes |
Set NEW NOTE alert |
Company Profile |
SEC
News |
Chart |
Request a new note
C
A
S
I |
JEF
-
NYSE
Jefferies Financial Grp
Finance-Invest Bnk/Bkrs
|
$38.33
|
-0.25
-0.65% |
$38.73
|
626,673
38.10% of 50 DAV
50 DAV is 1,645,000
|
$44.47
-13.81%
|
6/28/2021
|
$31.81
|
PP = $34.42
|
|
MB = $36.14
|
Most Recent Note - 12/9/2021 5:56:09 PM
G - Still sputtering with volume totals cooling, meanwhile, a rebound above the 50 DMA line ($40.83) is needed for its outlook to improve. Reported Aug '21 quarterly earnings +40% on +20% sales revenues versus the year ago period. See the latest FSU analysis for more details and a new annotated graph.
>>> FEATURED STOCK ARTICLE : Volume Totals Cooling While Lingering Below 50-Day Moving Average - 12/9/2021 |
View all notes |
Set NEW NOTE alert |
Company Profile |
SEC
News |
Chart |
Request a new note
C
A
S
I |
AVTR
-
NYSE
Avantor Inc
Medical-Research Eqp/Svc
|
$39.69
|
-0.26
-0.65% |
$40.77
|
2,359,451
62.94% of 50 DAV
50 DAV is 3,749,000
|
$44.37
-10.55%
|
6/10/2021
|
$32.94
|
PP = $34.09
|
|
MB = $35.79
|
Most Recent Note - 12/9/2021 6:03:17 PM
G - Consolidating above its 50 DMA line ($39.11) helping its technical stance improve. Faces overhead supply up to the $44 level. Prior lows in the high $36 area define important near-term support. Reported Sep '21 quarterly earnings +46% above the year ago period. Completed a Secondary Offering on 9/13/21.
>>> FEATURED STOCK ARTICLE : Faces Resistance While Sputtering Below 50 DMA Line - 11/12/2021 |
View all notes |
Set NEW NOTE alert |
Company Profile |
SEC
News |
Chart |
Request a new note
C
A
S
I |
Symbol/Exchange
Company Name
Industry Group |
PRICE |
CHANGE
(%Change) |
Day High |
Volume
(% DAV)
(% 50 day avg vol) |
52 Wk Hi
% From Hi |
Featured
Date |
Price
Featured |
Pivot Featured |
|
Max Buy |
MIME
-
NASDAQ
Mimecast Limited
Computer Sftwr-Security
|
$79.19
|
+0.06
0.08% |
$79.54
|
2,899,228
357.49% of 50 DAV
50 DAV is 811,000
|
$85.48
-7.36%
|
10/18/2021
|
$68.17
|
PP = $71.55
|
|
MB = $75.13
|
Most Recent Note - 12/9/2021 12:56:52 PM
G - Holding its ground after gapping up on 12/07/21 M&A news. Found prompt support at its 50 DMA line ($73.91) and prior highs in the $71 area. More damaging losses would raise concerns and trigger technical sell signals.
>>> FEATURED STOCK ARTICLE : Extended From Latest Base While Fundamentals Remain Strong - 11/26/2021 |
View all notes |
Set NEW NOTE alert |
Company Profile |
SEC
News |
Chart |
Request a new note
C
A
S
I |
AZTA
-
NASDAQ
"Azenta, Inc."
ELECTRONICS - Semiconductor Equipment
|
$104.55
|
-5.48
-4.98% |
$110.38
|
461,252
84.90% of 50 DAV
50 DAV is 543,300
|
$124.79
-16.22%
|
9/20/2021
|
$101.21
|
PP = $108.82
|
|
MB = $114.26
|
Most Recent Note - 12/9/2021 6:05:17 PM
G - Slumped today after meeting resistance near its 50 DMA line ($110.89). A rebound above the 50 DMA line is needed for its outlook to improve. See the latest FSU analysis for more details and an annotated graph.
>>> FEATURED STOCK ARTICLE : Recently Undercut Prior High and 50-Day Moving Average - 12/8/2021 |
View all notes |
Set NEW NOTE alert |
Company Profile |
SEC
News |
Chart |
Request a new note
C
A
S
I |
|
|
|
THESE ARE NOT BUY RECOMMENDATIONS!
Comments contained in the body of this report are technical
opinions only. The material herein has been obtained
from sources believed to be reliable and accurate, however,
its accuracy and completeness cannot be guaranteed.
This site is not an investment advisor, hence it does
not endorse or recommend any securities or other investments.
Any recommendation contained in this report may not
be suitable for all investors and it is not to be deemed
an offer or solicitation on our part with respect to
the purchase or sale of any securities. All trademarks,
service marks and trade names appearing in this report
are the property of their respective owners, and are
likewise used for identification purposes only.
This report is a service available
only to active Paid Premium Members.
You may opt-out of receiving report notifications
at any time. Questions or comments may be submitted
by writing to Premium Membership Services 665 S.E. 10 Street, Suite 201 Deerfield Beach, FL 33441-5634 or by calling 1-800-965-8307
or 954-785-1121.
|
|
|