***Last / Change / Volume data in this table is the closing quote data***
Symbol/Exchange
Company Name
Industry Group |
PRICE |
CHANGE
(%Change) |
Day High |
Volume
(% DAV)
(% 50 day avg vol) |
52 Wk Hi
% From Hi |
Featured
Date |
Price
Featured |
Pivot Featured |
|
Max Buy |
 SIVB
-
NASDAQ
SIVB
-
NASDAQ
S V B Financial Group
BANKING - Regional - Pacific Banks
|
$724.50
|
+10.31
1.44% |
$733.25
|
300,396
88.87% of 50 DAV
50 DAV is 338,000
|
$763.22
-5.07%
|
8/6/2021
|
$589.70
|
PP = $608.94
|
|
MB = $639.39
|
Most Recent Note - 11/26/2021 2:42:42 PM
G - Pulled back and tested its 50 DMA line ($699) with today's loss. More damaging losses would raise concerns and trigger a technical sell signal. Recently reported Sep '21 quarterly earnings -14% on +43% sales revenues versus the year ago period, below the +25% minimum earnings guideline (C criteria), raising fundamental concerns. Completed a new Public Offering on 8/11/21.
>>> FEATURED STOCK ARTICLE : Latest Quarter Raised Fundamental Concerns - 10/29/2021 |
View all notes |
Set NEW NOTE alert |
Company Profile |
SEC
News |
Chart |
Request a new note
C
A
S
I |
BLDR
-
NYSE
Builders Firstsource Inc
Bldg-Constr Prds/Misc
|
$71.85
|
+0.42
0.59% |
$73.33
|
2,393,816
120.84% of 50 DAV
50 DAV is 1,981,000
|
$74.15
-3.10%
|
8/12/2021
|
$52.38
|
PP = $54.09
|
|
MB = $56.79
|
Most Recent Note - 11/26/2021 2:35:40 PM
G - Very extended from any sound base, it pulled back today after wedging into new all-time high territory. Reported Sep '21 quarterly earnings +308% on +140% sales revenues versus the year ago period. Its 50 DMA line ($60.07) and prior highs in the $55 area define important near-term support to watch on pullbacks.
>>> FEATURED STOCK ARTICLE : Earnings News Due Thursday for High-Ranked Building Products Firm - 11/2/2021 |
View all notes |
Set NEW NOTE alert |
Company Profile |
SEC
News |
Chart |
Request a new note
C
A
S
I |
DSGX
-
NASDAQ
Descartes Systems Group
COMPUTER SOFTWARE and SERVICES - Business Software and Services
|
$83.12
|
+0.00
0.00% |
$84.34
|
77,283
90.92% of 50 DAV
50 DAV is 85,000
|
$91.39
-9.05%
|
11/18/2021
|
$90.77
|
PP = $87.56
|
|
MB = $91.94
|
 Most Recent Note - 11/29/2021 5:01:05 PM
Y - Fundamentals remain strong while finding support today near its 50 DMA line ($83.50) following last week's losses with higher volume. There was a "negative reversal" noted on 11/18/21 as it finished near the session low with a loss on above average volume after highlighted in yellow in the mid-day report with pivot point cited based on its 9/23/21 high plus 10 cents. Members were reminded - "While recently wedging from a 6-week base, gains above a stock's pivot point must be backed by at least +40% above average volume to clinch a proper technical buy signal."
>>> FEATURED STOCK ARTICLE : Reversed After Wedging to New Highs - 11/18/2021 |
View all notes |
Set NEW NOTE alert |
Company Profile |
SEC
News |
Chart |
Request a new note
C
A
S
I |
KFRC
-
NASDAQ
Kforce Inc
Comml Svcs-Staffing
|
$78.83
|
+2.49
3.26% |
$80.23
|
214,759
198.85% of 50 DAV
50 DAV is 108,000
|
$81.47
-3.24%
|
9/10/2021
|
$59.53
|
PP = $64.48
|
|
MB = $67.70
|
Most Recent Note - 11/29/2021 12:59:55 PM
G - Still hovering near its all-time high. Its prior high and 50 DMA line ($68.66) define important near-term support to watch on pullbacks. Recently reported Sep '21 quarterly earnings +8% on +10% sales revenues versus the year ago period, below the +25% minimum earnings guideline (C criteria), raising fundamental concerns.
>>> FEATURED STOCK ARTICLE : Extended From Base and Latest Quarter Earnings Growth Sub Par - 11/19/2021 |
View all notes |
Set NEW NOTE alert |
Company Profile |
SEC
News |
Chart |
Request a new note
C
A
S
I |
GNRC
-
NYSE
Generac Hldgs Inc
Electrical-Power/Equipmt
|
$424.58
|
-8.57
-1.98% |
$442.18
|
661,819
100.12% of 50 DAV
50 DAV is 661,000
|
$524.31
-19.02%
|
8/30/2021
|
$449.36
|
PP = $457.10
|
|
MB = $479.96
|
Most Recent Note - 11/26/2021 2:37:09 PM
G - Sputtering below its 50 DMA line ($442) which has acted as resistance. Weak action came after it recently reported Sep '21 quarterly earnings +13% on +34% sales revenues versus the year ago period, below the +25% minimum earnings guideline (C criteria), raising fundamental concerns.
>>> FEATURED STOCK ARTICLE : Halted Slide at 50-Day Moving Average After Earnings News - 11/8/2021 |
View all notes |
Set NEW NOTE alert |
Company Profile |
SEC
News |
Chart |
Request a new note
C
A
S
I |
Symbol/Exchange
Company Name
Industry Group |
PRICE |
CHANGE
(%Change) |
Day High |
Volume
(% DAV)
(% 50 day avg vol) |
52 Wk Hi
% From Hi |
Featured
Date |
Price
Featured |
Pivot Featured |
|
Max Buy |
CAMT
-
NASDAQ
Camtek Ltd
ELECTRONICS - Scientific and Technical Instrum
|
$46.32
|
+2.03
4.58% |
$46.48
|
269,706
115.75% of 50 DAV
50 DAV is 233,000
|
$49.60
-6.61%
|
11/9/2021
|
$45.43
|
PP = $46.11
|
|
MB = $48.42
|
Most Recent Note - 11/29/2021 5:02:51 PM
Y - Posted a solid gain today with higher volume, finding prompt support near the prior high. Weak action came after recently proposing a new $140 Million note offering. Fundamentals remain strong.
>>> FEATURED STOCK ARTICLE : Rebound Above 50-Day Moving Average Helped Outlook - 11/5/2021 |
View all notes |
Set NEW NOTE alert |
Company Profile |
SEC
News |
Chart |
Request a new note
C
A
S
I |
AMD
-
NASDAQ
Advanced Micro Devices
ELECTRONICS - Semiconductor - Broad Line
|
$161.91
|
+7.10
4.59% |
$162.51
|
56,895,365
108.37% of 50 DAV
50 DAV is 52,500,000
|
$161.88
0.02%
|
10/27/2021
|
$124.91
|
PP = $122.59
|
|
MB = $128.72
|
Most Recent Note - 11/29/2021 5:04:21 PM
G - Posted a gain with higher volume today and closed near the session high, very extended from the previously noted base. Disciplined investors avoid chasing extended stocks. Prior high in the $122 area coincides with its 50 DMA line defining important support to watch on pullbacks. Fundamentals remain strong after it reported Sep '21 quarterly earnings +78% on +54% sales revenues versus the year ago period.
>>> FEATURED STOCK ARTICLE : Encountered Distributional Pressure After Reaching New High - 10/27/2021 |
View all notes |
Set NEW NOTE alert |
Company Profile |
SEC
News |
Chart |
Request a new note
C
A
S
I |
UMC
-
NYSE
United Microelectrnc Adr
ELECTRONICS - Semiconductor - Integrated Cir
|
$11.43
|
+0.30
2.70% |
$11.47
|
6,610,642
87.53% of 50 DAV
50 DAV is 7,552,000
|
$12.62
-9.43%
|
8/5/2021
|
$11.62
|
PP = $11.38
|
|
MB = $11.95
|
Most Recent Note - 11/29/2021 5:10:39 PM
G - Consolidating above its 50 DMA line ($11.09) with volume totals near average. Reported Sep '21 quarterly earnings +100% on +30% sales revenues versus the year ago period. Recently found support above its 200 DMA line ($10.06).
>>> FEATURED STOCK ARTICLE : Earnings News Due From Taiwan-Based Semiconductor Firm - 10/26/2021 |
View all notes |
Set NEW NOTE alert |
Company Profile |
SEC
News |
Chart |
Request a new note
C
A
S
I |
BRKS
-
NASDAQ
Brooks Automation
ELECTRONICS - Semiconductor Equipment and Mate
|
$116.28
|
+3.67
3.26% |
$116.74
|
456,152
72.76% of 50 DAV
50 DAV is 626,900
|
$124.79
-6.82%
|
9/20/2021
|
$101.21
|
PP = $108.82
|
|
MB = $114.26
|
Most Recent Note - 11/24/2021 5:08:28 PM
G - Consolidating well above its 50 DMA line ($109.56) after today's 4th consecutive loss, still above its "max buy" level. Prior high ($110) and its 50 DMA line define near-term support to watch on pullbacks. Reported Sep 21 quarterly earnings +33% on +27% sales revenues versus the year ago period. See the latest FSU analysis for more details and a new annotated graph.
>>> FEATURED STOCK ARTICLE : Consolidating Still Well Above Prior High and 50 DMA Line - 11/24/2021 |
View all notes |
Set NEW NOTE alert |
Company Profile |
SEC
News |
Chart |
Request a new note
C
A
S
I |
ENTG
-
NASDAQ
Entegris Inc
ELECTRONICS - Semiconductor Equipment and Mate
|
$154.75
|
+5.74
3.85% |
$155.99
|
1,681,473
191.73% of 50 DAV
50 DAV is 877,000
|
$158.00
-2.06%
|
8/4/2021
|
$125.33
|
PP = $126.51
|
|
MB = $132.84
|
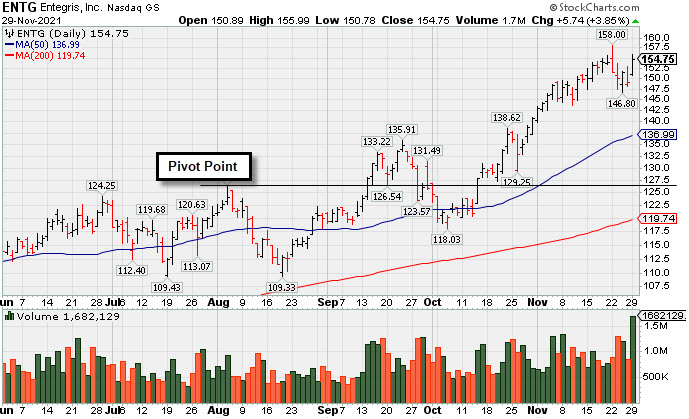
Most Recent Note - 11/29/2021 4:57:47 PM
G - Posted a volume-driven gain today for a best-ever close. Very extended from any sound base, its prior high ($136) and its 50 DMA line define near-term support to watch. Fundamentals remain strong after it recently reported Sep '21 quarterly earnings +37% on +20% sales revenues versus the year ago period. See the latest FSU analysis for more details and a new annotated graph.
>>> FEATURED STOCK ARTICLE : Best Ever Close After Volume-Driven Gain - 11/29/2021 |
View all notes |
Set NEW NOTE alert |
Company Profile |
SEC
News |
Chart |
Request a new note
C
A
S
I |
Symbol/Exchange
Company Name
Industry Group |
PRICE |
CHANGE
(%Change) |
Day High |
Volume
(% DAV)
(% 50 day avg vol) |
52 Wk Hi
% From Hi |
Featured
Date |
Price
Featured |
Pivot Featured |
|
Max Buy |
SKY
-
NYSE
Skyline Champion Corp
Bldg-Mobile/Mfg andamp; RV
|
$80.49
|
+2.11
2.69% |
$81.01
|
350,394
89.84% of 50 DAV
50 DAV is 390,000
|
$82.73
-2.71%
|
11/3/2021
|
$72.19
|
PP = $66.92
|
|
MB = $70.27
|
Most Recent Note - 11/23/2021 5:32:01 PM
G - Paused today perched at its all-time high after 5 consecutive volume-driven gains, very extended from the previously noted flat base. Prior highs in the $66 area define support to watch coinciding with its 50 DMA line. Reported very strong Mar, Jun and Sep '21 quarterly results versus the year ago periods well above the +25% minimum earnings guideline (C criteria). Annual earnings (A criteria) history has been strong.
>>> FEATURED STOCK ARTICLE : Breakaway Gap After 10-Week Flat Base - 11/3/2021 |
View all notes |
Set NEW NOTE alert |
Company Profile |
SEC
News |
Chart |
Request a new note
C
A
S
I |
WSM
-
NYSE
Williams Sonoma Inc
RETAIL - Home Furnishing Stores
|
$206.00
|
+0.28
0.14% |
$209.76
|
609,407
67.71% of 50 DAV
50 DAV is 900,000
|
$223.32
-7.76%
|
11/3/2021
|
$205.00
|
PP = $195.09
|
|
MB = $204.84
|
Most Recent Note - 11/29/2021 5:14:47 PM
G - Volume totals have been cooling while prior highs define near-term support to watch above its 50 DMA line ($192). Fundamental remain strong after it reported Oct '21 quarterly earnings +30% on +16% sales revenues versus the year ago period.
>>> FEATURED STOCK ARTICLE : Volume-Driven Gains May Signal a New Meaningful Leg Up - 11/4/2021 |
View all notes |
Set NEW NOTE alert |
Company Profile |
SEC
News |
Chart |
Request a new note
C
A
S
I |
TITN
-
NASDAQ
Titan Machinery Inc
SPECIALTY RETAIL
|
$33.43
|
-0.42
-1.24% |
$35.52
|
308,436
201.59% of 50 DAV
50 DAV is 153,000
|
$38.58
-13.35%
|
11/23/2021
|
$36.22
|
PP = $35.34
|
|
MB = $37.11
|
Most Recent Note - 11/29/2021 1:17:52 PM
Y - Holding its ground today. Pulled back for 2nd consecutive losses after a gain for a new 52-week high clinched a technical buy signal. Highlighted in the 11/23/21 mid-day report in yellow with pivot point cited base on its 6/01/21 high plus 10 cents. Reported Oct '21 quarterly earnings +81% on +26% sales revenues over the year ago period, its 4th strong quarterly comparison. Volume and volatility often increase near earnings news. Following years of losses it has shown strong earnings growth for FY '19-21.
>>> FEATURED STOCK ARTICLE : Strong Close With Gain Backed by +467% Above Average Volume - 11/23/2021 |
View all notes |
Set NEW NOTE alert |
Company Profile |
SEC
News |
Chart |
Request a new note
C
A
S
I |
CLFD
-
NASDAQ
Clearfield Inc
TELECOMMUNICATIONS - Cables / Satalite Equipment
|
$66.07
|
+1.34
2.06% |
$67.25
|
70,213
60.01% of 50 DAV
50 DAV is 117,000
|
$72.00
-8.24%
|
7/23/2021
|
$40.23
|
PP = $43.74
|
|
MB = $45.93
|
Most Recent Note - 11/29/2021 4:59:19 PM
G - Still hovering near its all-time high, very extended from the previously noted base. Its 50 DMA line ($55.68) defines near-term support to watch on pullbacks. Reported Sep '21 quarterly earnings +141% on +66% sales revenues above the year ago period.
>>> FEATURED STOCK ARTICLE : Perched Near High Extended From Any Sound Base - 11/22/2021 |
View all notes |
Set NEW NOTE alert |
Company Profile |
SEC
News |
Chart |
Request a new note
C
A
S
I |
ENPH
-
NASDAQ
Enphase Energy Inc
Energy-Solar
|
$256.71
|
+9.29
3.75% |
$257.70
|
1,438,116
60.71% of 50 DAV
50 DAV is 2,369,000
|
$282.46
-9.12%
|
10/28/2021
|
$218.00
|
PP = $229.14
|
|
MB = $240.60
|
Most Recent Note - 11/29/2021 5:07:36 PM
G - Consolidating following a "negative reversal" last week at its all-time high. It is extended from the previously noted base. Prior high ($229) defines initial support to watch on pullbacks.
>>> FEATURED STOCK ARTICLE : Enphase is Challenging its All-Time High With Volume-Driven Gains - 10/28/2021 |
View all notes |
Set NEW NOTE alert |
Company Profile |
SEC
News |
Chart |
Request a new note
C
A
S
I |
Symbol/Exchange
Company Name
Industry Group |
PRICE |
CHANGE
(%Change) |
Day High |
Volume
(% DAV)
(% 50 day avg vol) |
52 Wk Hi
% From Hi |
Featured
Date |
Price
Featured |
Pivot Featured |
|
Max Buy |
SMPL
-
NASDAQ
Simply Good Foods Co
Food-Confectionery
|
$37.77
|
-0.16
-0.42% |
$39.54
|
277,853
74.69% of 50 DAV
50 DAV is 372,000
|
$41.35
-8.66%
|
10/25/2021
|
$38.30
|
PP = $38.60
|
|
MB = $40.53
|
Most Recent Note - 11/26/2021 2:50:51 PM
Y - Pulled back with higher (near average) volume today, testing near prior highs in the $38 area and its 50 DMA line ($37.30) which define important near-term support.
>>> FEATURED STOCK ARTICLE : Consolidating Above Prior High Following Recent Technical Breakout - 11/15/2021 |
View all notes |
Set NEW NOTE alert |
Company Profile |
SEC
News |
Chart |
Request a new note
C
A
S
I |
WDAY
-
NYSE
Workday Inc Cl A
Computer Sftwr-Enterprse
|
$281.59
|
+4.04
1.46% |
$284.82
|
1,244,126
77.81% of 50 DAV
50 DAV is 1,599,000
|
$307.81
-8.52%
|
9/7/2021
|
$275.69
|
PP = $282.87
|
|
MB = $297.01
|
Most Recent Note - 11/29/2021 5:13:06 PM
Y - Color code is changed to yellow after finding prompt support near prior highs in the $278-282 area and its 50 DMA line following recent damaging losses that triggered a technical sell signal. Reported Oct '21 quarterly earnings +28% on +20% sales revenues versus the year ago period. Fundamentals remain strong.
>>> FEATURED STOCK ARTICLE : Getting Extended From Previously Noted Base - 11/16/2021 |
View all notes |
Set NEW NOTE alert |
Company Profile |
SEC
News |
Chart |
Request a new note
C
A
S
I |
CTLT
-
NYSE
Catalent Inc
DRUGS - Biotechnology
|
$133.99
|
+1.68
1.27% |
$136.13
|
1,107,667
125.87% of 50 DAV
50 DAV is 880,000
|
$142.64
-6.06%
|
8/25/2021
|
$128.72
|
PP = $127.78
|
|
MB = $134.17
|
Most Recent Note - 11/24/2021 5:10:54 PM
G - The 50 DMA line ($131.59) has been acting as resistance. Its Relative Strength Rating is 78, still below the 80+ minimum guideline for buy candidates. Halted its slide above its 200 DMA line ($117.73). More damaging losses would raise greater concerns. Fundamentals remain strong after it reported Sep '21 quarterly earnings +65% on +21% sales revenues versus the year ago period, continuing its strong earnings track record.
>>> FEATURED STOCK ARTICLE : Recent Violation of 50-Day Moving Average Triggered Sell Signal - 11/11/2021 |
View all notes |
Set NEW NOTE alert |
Company Profile |
SEC
News |
Chart |
Request a new note
C
A
S
I |
TTD
-
NASDAQ
The Trade Desk Inc Cl A
Comml Svcs-Advertising
|
$107.06
|
+3.08
2.96% |
$108.20
|
3,148,950
61.36% of 50 DAV
50 DAV is 5,132,000
|
$114.09
-6.16%
|
11/9/2021
|
$95.16
|
PP = $90.00
|
|
MB = $94.50
|
Most Recent Note - 11/29/2021 5:09:18 PM
G - Volume totals have been cooling while consolidating after getting extended from the previously noted 9-month cup-with-handle shaped base. Prior highs define initial support to watch.
>>> FEATURED STOCK ARTICLE : Powerful Volume-Driven Gains for New Highs - 11/9/2021 |
View all notes |
Set NEW NOTE alert |
Company Profile |
SEC
News |
Chart |
Request a new note
C
A
S
I |
MEDP
-
NASDAQ
Medpace Holdings Inc
Medical-Research Eqp/Svc
|
$209.09
|
-0.92
-0.44% |
$214.07
|
134,406
82.46% of 50 DAV
50 DAV is 163,000
|
$231.00
-9.48%
|
9/10/2021
|
$196.32
|
PP = $196.22
|
|
MB = $206.03
|
Most Recent Note - 11/23/2021 5:34:44 PM
G - Suffered a 2nd consecutive big loss today while abruptly retreating from its 52-week high. As recently noted, Sep '21 earnings rose +18% on +28% sales revenues versus the year ago period, below the +25% minimum earnings guideline (C criteria), raising fundamental concerns. Its 50 DMA line ($202) and prior highs in the $199 area define important near-term support to watch.
>>> FEATURED STOCK ARTICLE : Medpace Hovering at High With Volume Totals Cooling - 11/17/2021 |
View all notes |
Set NEW NOTE alert |
Company Profile |
SEC
News |
Chart |
Request a new note
C
A
S
I |
Symbol/Exchange
Company Name
Industry Group |
PRICE |
CHANGE
(%Change) |
Day High |
Volume
(% DAV)
(% 50 day avg vol) |
52 Wk Hi
% From Hi |
Featured
Date |
Price
Featured |
Pivot Featured |
|
Max Buy |
JEF
-
NYSE
Jefferies Financial Grp
Finance-Invest Bnk/Bkrs
|
$38.37
|
-0.71
-1.82% |
$39.84
|
1,655,669
93.91% of 50 DAV
50 DAV is 1,763,000
|
$44.47
-13.72%
|
6/28/2021
|
$31.81
|
PP = $34.42
|
|
MB = $36.14
|
Most Recent Note - 11/29/2021 5:17:50 PM
G - Today's weak close and loss with higher (near average) volume raised greater concerns. Only a rebound above the 50 DMA line ($40.59) would help its outlook improve. Reported Aug '21 quarterly earnings +40% on +20% sales revenues versus the year ago period.
>>> FEATURED STOCK ARTICLE : Extended From Prior Highs and Stubbornly Holding Ground - 11/1/2021 |
View all notes |
Set NEW NOTE alert |
Company Profile |
SEC
News |
Chart |
Request a new note
C
A
S
I |
AVTR
-
NYSE
Avantor Inc
Medical-Research Eqp/Svc
|
$39.78
|
+0.16
0.40% |
$40.26
|
2,518,502
62.11% of 50 DAV
50 DAV is 4,055,000
|
$44.37
-10.34%
|
6/10/2021
|
$32.94
|
PP = $34.09
|
|
MB = $35.79
|
Most Recent Note - 11/26/2021 2:13:47 PM
G - Ended near the session low today, still sputtering and meeting resistance at its 50 DMA line ($39.73). A rebound above the 50 DMA line is needed for its outlook to improve, and it faces overhead supply up to the $44 level. Reported Sep '21 quarterly earnings +46% above the year ago period. Completed a Secondary Offering on 9/13/21.
>>> FEATURED STOCK ARTICLE : Faces Resistance While Sputtering Below 50 DMA Line - 11/12/2021 |
View all notes |
Set NEW NOTE alert |
Company Profile |
SEC
News |
Chart |
Request a new note
C
A
S
I |
MIME
-
NASDAQ
Mimecast Limited
Computer Sftwr-Security
|
$82.56
|
+4.62
5.93% |
$82.90
|
811,461
140.39% of 50 DAV
50 DAV is 578,000
|
$85.48
-3.42%
|
10/18/2021
|
$68.17
|
PP = $71.55
|
|
MB = $75.13
|
Most Recent Note - 11/29/2021 5:06:18 PM
G - Posted a solid gain today with higher volume. Very extended from the previously noted base. Its 50 DMA line ($72) and prior highs in the $71 area define important near-term support to watch on pullbacks.
>>> FEATURED STOCK ARTICLE : Extended From Latest Base While Fundamentals Remain Strong - 11/26/2021 |
View all notes |
Set NEW NOTE alert |
Company Profile |
SEC
News |
Chart |
Request a new note
C
A
S
I |