***Last / Change / Volume data in this table is the closing quote data***
Symbol/Exchange
Company Name
Industry Group |
PRICE |
CHANGE
(%Change) |
Day High |
Volume
(% DAV)
(% 50 day avg vol) |
52 Wk Hi
% From Hi |
Featured
Date |
Price
Featured |
Pivot Featured |
|
Max Buy |
 SIVB
-
NASDAQ
SIVB
-
NASDAQ
S V B Financial Group
BANKING - Regional - Pacific Banks
|
$714.19
|
-26.26
-3.55% |
$721.77
|
274,228
80.66% of 50 DAV
50 DAV is 340,000
|
$763.22
-6.42%
|
8/6/2021
|
$589.70
|
PP = $608.94
|
|
MB = $639.39
|
 Most Recent Note - 11/26/2021 2:42:42 PM
G - Pulled back and tested its 50 DMA line ($699) with today's loss. More damaging losses would raise concerns and trigger a technical sell signal. Recently reported Sep '21 quarterly earnings -14% on +43% sales revenues versus the year ago period, below the +25% minimum earnings guideline (C criteria), raising fundamental concerns. Completed a new Public Offering on 8/11/21.
>>> FEATURED STOCK ARTICLE : Latest Quarter Raised Fundamental Concerns - 10/29/2021 |
View all notes |
Set NEW NOTE alert |
Company Profile |
SEC
News |
Chart |
Request a new note
C
A
S
I |
BLDR
-
NYSE
Builders Firstsource Inc
Bldg-Constr Prds/Misc
|
$71.43
|
-2.28
-3.09% |
$72.77
|
1,621,179
82.13% of 50 DAV
50 DAV is 1,974,000
|
$74.15
-3.67%
|
8/12/2021
|
$52.38
|
PP = $54.09
|
|
MB = $56.79
|
Most Recent Note - 11/26/2021 2:35:40 PM
G - Very extended from any sound base, it pulled back today after wedging into new all-time high territory. Reported Sep '21 quarterly earnings +308% on +140% sales revenues versus the year ago period. Its 50 DMA line ($60.07) and prior highs in the $55 area define important near-term support to watch on pullbacks.
>>> FEATURED STOCK ARTICLE : Earnings News Due Thursday for High-Ranked Building Products Firm - 11/2/2021 |
View all notes |
Set NEW NOTE alert |
Company Profile |
SEC
News |
Chart |
Request a new note
C
A
S
I |
DSGX
-
NASDAQ
Descartes Systems Group
COMPUTER SOFTWARE and SERVICES - Business Software and Services
|
$83.12
|
-0.20
-0.24% |
$84.33
|
62,678
72.04% of 50 DAV
50 DAV is 87,000
|
$91.39
-9.05%
|
11/18/2021
|
$90.77
|
PP = $87.56
|
|
MB = $91.94
|
Most Recent Note - 11/22/2021 12:40:31 PM
Y - Fundamentals remain strong but pulling back today with higher volume. There was a "negative reversal" noted on 11/18/21 as it finished near the session low with a loss on above average volume after highlighted in yellow in the mid-day report with pivot point cited based on its 9/23/21 high plus 10 cents. Members were reminded - "While recently wedging from a 6-week base, gains above a stock's pivot point must be backed by at least +40% above average volume to clinch a proper technical buy signal."
>>> FEATURED STOCK ARTICLE : Reversed After Wedging to New Highs - 11/18/2021 |
View all notes |
Set NEW NOTE alert |
Company Profile |
SEC
News |
Chart |
Request a new note
C
A
S
I |
KFRC
-
NASDAQ
Kforce Inc
Comml Svcs-Staffing
|
$76.34
|
-3.20
-4.02% |
$79.38
|
102,640
95.04% of 50 DAV
50 DAV is 108,000
|
$81.47
-6.30%
|
9/10/2021
|
$59.53
|
PP = $64.48
|
|
MB = $67.70
|
Most Recent Note - 11/26/2021 2:40:26 PM
G - Pulled back from its all-time high with today's 2nd consecutive loss. Its prior high and 50 DMA line ($68.31) define important near-term support to watch on pullbacks. Recently reported Sep '21 quarterly earnings +8% on +10% sales revenues versus the year ago period, below the +25% minimum earnings guideline (C criteria), raising fundamental concerns.
>>> FEATURED STOCK ARTICLE : Extended From Base and Latest Quarter Earnings Growth Sub Par - 11/19/2021 |
View all notes |
Set NEW NOTE alert |
Company Profile |
SEC
News |
Chart |
Request a new note
C
A
S
I |
GNRC
-
NYSE
Generac Hldgs Inc
Electrical-Power/Equipmt
|
$433.15
|
-3.95
-0.90% |
$445.66
|
372,640
56.21% of 50 DAV
50 DAV is 663,000
|
$524.31
-17.39%
|
8/30/2021
|
$449.36
|
PP = $457.10
|
|
MB = $479.96
|
Most Recent Note - 11/26/2021 2:37:09 PM
G - Sputtering below its 50 DMA line ($442) which has acted as resistance. Weak action came after it recently reported Sep '21 quarterly earnings +13% on +34% sales revenues versus the year ago period, below the +25% minimum earnings guideline (C criteria), raising fundamental concerns.
>>> FEATURED STOCK ARTICLE : Halted Slide at 50-Day Moving Average After Earnings News - 11/8/2021 |
View all notes |
Set NEW NOTE alert |
Company Profile |
SEC
News |
Chart |
Request a new note
C
A
S
I |
Symbol/Exchange
Company Name
Industry Group |
PRICE |
CHANGE
(%Change) |
Day High |
Volume
(% DAV)
(% 50 day avg vol) |
52 Wk Hi
% From Hi |
Featured
Date |
Price
Featured |
Pivot Featured |
|
Max Buy |
CAMT
-
NASDAQ
Camtek Ltd
ELECTRONICS - Scientific and Technical Instrum
|
$44.29
|
-1.45
-3.17% |
$45.50
|
91,845
39.42% of 50 DAV
50 DAV is 233,000
|
$49.60
-10.71%
|
11/9/2021
|
$45.43
|
PP = $46.11
|
|
MB = $48.42
|
Most Recent Note - 11/23/2021 5:40:07 PM
Y - Suffered a 3rd volume-driven loss in the span of 4 sessions, still slumping below the prior high and back into the prior base. Weak action came after proposing a new $140 Million note offering. Fundamentals remain strong.
>>> FEATURED STOCK ARTICLE : Rebound Above 50-Day Moving Average Helped Outlook - 11/5/2021 |
View all notes |
Set NEW NOTE alert |
Company Profile |
SEC
News |
Chart |
Request a new note
C
A
S
I |
AMD
-
NASDAQ
Advanced Micro Devices
ELECTRONICS - Semiconductor - Broad Line
|
$154.81
|
-2.99
-1.89% |
$158.10
|
36,039,426
68.60% of 50 DAV
50 DAV is 52,539,000
|
$161.88
-4.37%
|
10/27/2021
|
$124.91
|
PP = $122.59
|
|
MB = $128.72
|
Most Recent Note - 11/24/2021 12:28:56 PM
G - Very extended from the previously noted base. Disciplined investors avoid chasing extended stocks. Prior high in the $122 area coincides with its 50 DMA line defining important support to watch on pullbacks. Fundamentals remain strong after it reported Sep '21 quarterly earnings +78% on +54% sales revenues versus the year ago period.
>>> FEATURED STOCK ARTICLE : Encountered Distributional Pressure After Reaching New High - 10/27/2021 |
View all notes |
Set NEW NOTE alert |
Company Profile |
SEC
News |
Chart |
Request a new note
C
A
S
I |
UMC
-
NYSE
United Microelectrnc Adr
ELECTRONICS - Semiconductor - Integrated Cir
|
$11.13
|
-0.28
-2.45% |
$11.39
|
4,847,958
64.18% of 50 DAV
50 DAV is 7,554,000
|
$12.62
-11.81%
|
8/5/2021
|
$11.62
|
PP = $11.38
|
|
MB = $11.95
|
Most Recent Note - 11/23/2021 5:36:30 PM
G - Gapped down today pulling back near its 50 DMA line ($11.03) with volume totals near average. Reported Sep '21 quarterly earnings +100% on +30% sales revenues versus the year ago period. Recently found support above its 200 DMA line ($10.05).
>>> FEATURED STOCK ARTICLE : Earnings News Due From Taiwan-Based Semiconductor Firm - 10/26/2021 |
View all notes |
Set NEW NOTE alert |
Company Profile |
SEC
News |
Chart |
Request a new note
C
A
S
I |
BRKS
-
NASDAQ
Brooks Automation
ELECTRONICS - Semiconductor Equipment and Mate
|
$112.61
|
-3.00
-2.59% |
$115.46
|
269,849
42.97% of 50 DAV
50 DAV is 628,000
|
$124.79
-9.76%
|
9/20/2021
|
$101.21
|
PP = $108.82
|
|
MB = $114.26
|
Most Recent Note - 11/24/2021 5:08:28 PM
G - Consolidating well above its 50 DMA line ($109.56) after today's 4th consecutive loss, still above its "max buy" level. Prior high ($110) and its 50 DMA line define near-term support to watch on pullbacks. Reported Sep 21 quarterly earnings +33% on +27% sales revenues versus the year ago period. See the latest FSU analysis for more details and a new annotated graph.
>>> FEATURED STOCK ARTICLE : Consolidating Still Well Above Prior High and 50 DMA Line - 11/24/2021 |
View all notes |
Set NEW NOTE alert |
Company Profile |
SEC
News |
Chart |
Request a new note
C
A
S
I |
ENTG
-
NASDAQ
Entegris Inc
ELECTRONICS - Semiconductor Equipment and Mate
|
$149.01
|
-2.54
-1.68% |
$152.96
|
859,129
97.30% of 50 DAV
50 DAV is 883,000
|
$158.00
-5.69%
|
8/4/2021
|
$125.33
|
PP = $126.51
|
|
MB = $132.84
|
Most Recent Note - 11/22/2021 5:05:34 PM
G - There was a "negative reversal" today after hitting yet another new all-time high. Very extended from any sound base, its prior high ($136) and its 50 DMA line ($135.41) define near-term support to watch. Fundamentals remain strong after it recently reported Sep '21 quarterly earnings +37% on +20% sales revenues versus the year ago period.
>>> FEATURED STOCK ARTICLE : Hit New Record High With Another Volume-Driven Gain - 10/22/2021 |
View all notes |
Set NEW NOTE alert |
Company Profile |
SEC
News |
Chart |
Request a new note
C
A
S
I |
Symbol/Exchange
Company Name
Industry Group |
PRICE |
CHANGE
(%Change) |
Day High |
Volume
(% DAV)
(% 50 day avg vol) |
52 Wk Hi
% From Hi |
Featured
Date |
Price
Featured |
Pivot Featured |
|
Max Buy |
SKY
-
NYSE
Skyline Champion Corp
Bldg-Mobile/Mfg andamp; RV
|
$78.38
|
-2.09
-2.60% |
$80.32
|
294,881
74.09% of 50 DAV
50 DAV is 398,000
|
$82.73
-5.26%
|
11/3/2021
|
$72.19
|
PP = $66.92
|
|
MB = $70.27
|
Most Recent Note - 11/23/2021 5:32:01 PM
G - Paused today perched at its all-time high after 5 consecutive volume-driven gains, very extended from the previously noted flat base. Prior highs in the $66 area define support to watch coinciding with its 50 DMA line. Reported very strong Mar, Jun and Sep '21 quarterly results versus the year ago periods well above the +25% minimum earnings guideline (C criteria). Annual earnings (A criteria) history has been strong.
>>> FEATURED STOCK ARTICLE : Breakaway Gap After 10-Week Flat Base - 11/3/2021 |
View all notes |
Set NEW NOTE alert |
Company Profile |
SEC
News |
Chart |
Request a new note
C
A
S
I |
WSM
-
NYSE
Williams Sonoma Inc
RETAIL - Home Furnishing Stores
|
$205.72
|
-4.09
-1.95% |
$208.35
|
440,432
48.03% of 50 DAV
50 DAV is 917,000
|
$223.32
-7.88%
|
11/3/2021
|
$205.00
|
PP = $195.09
|
|
MB = $204.84
|
Most Recent Note - 11/23/2021 12:53:29 PM
G - Reported Oct '21 quarterly earnings +30% on +16% sales revenues versus the year ago period. Volume and volatility often increase near earnings news. Pulling back from its all-time high. Prior highs define near-term support to watch above its 50 DMA line ($190).
>>> FEATURED STOCK ARTICLE : Volume-Driven Gains May Signal a New Meaningful Leg Up - 11/4/2021 |
View all notes |
Set NEW NOTE alert |
Company Profile |
SEC
News |
Chart |
Request a new note
C
A
S
I |
TITN
-
NASDAQ
Titan Machinery Inc
SPECIALTY RETAIL
|
$33.85
|
-1.09
-3.12% |
$34.79
|
176,998
116.45% of 50 DAV
50 DAV is 152,000
|
$38.58
-12.26%
|
11/23/2021
|
$36.22
|
PP = $35.34
|
|
MB = $37.11
|
Most Recent Note - 11/26/2021 12:03:41 PM
Y - Pulling back today for a 2nd consecutive volume-driven loss after a gain for a new 52-week high clinched a technical buy signal. Highlighted in the 11/23/21 mid-day report in yellow with pivot point cited base on its 6/01/21 high plus 10 cents. Reported Oct '21 quarterly earnings +81% on +26% sales revenues over the year ago period, its 4th strong quarterly comparison. Volume and volatility often increase near earnings news. Following years of losses it has shown strong earnings growth for FY '19-21.
>>> FEATURED STOCK ARTICLE : Strong Close With Gain Backed by +467% Above Average Volume - 11/23/2021 |
View all notes |
Set NEW NOTE alert |
Company Profile |
SEC
News |
Chart |
Request a new note
C
A
S
I |
CLFD
-
NASDAQ
Clearfield Inc
TELECOMMUNICATIONS - Cables / Satalite Equipment
|
$64.73
|
-1.80
-2.71% |
$66.01
|
76,461
65.91% of 50 DAV
50 DAV is 116,000
|
$72.00
-10.10%
|
7/23/2021
|
$40.23
|
PP = $43.74
|
|
MB = $45.93
|
Most Recent Note - 11/22/2021 1:34:37 PM
G - Perched near its all-time high, very extended from the previously noted base. Its 50 DMA line ($54) defines near-term support to watch on pullbacks. Reported Sep '21 quarterly earnings +141% on +66% sales revenues above the year ago period.
>>> FEATURED STOCK ARTICLE : Perched Near High Extended From Any Sound Base - 11/22/2021 |
View all notes |
Set NEW NOTE alert |
Company Profile |
SEC
News |
Chart |
Request a new note
C
A
S
I |
TGH
-
NYSE
Textainer Group Holdings
TRANSPORTATION - Logistics
|
$33.68
|
-1.12
-3.22% |
$33.84
|
420,107
84.87% of 50 DAV
50 DAV is 495,000
|
$41.24
-18.33%
|
10/7/2021
|
$36.97
|
PP = $36.80
|
|
MB = $38.64
|
Most Recent Note - 11/26/2021 2:46:18 PM
Slumped further below its 50 DMA line ($36.65) with more damaging losses after triggering a technical sell signal. It will be dropped from the Featured Stocks list tonight. Only a prompt rebound above the 50 DMA line would help its outlook to improve. Fundamentals remain strong.
>>> FEATURED STOCK ARTICLE : Pulling Back Below "Max Buy" Level With Lighter Volume - 11/10/2021 |
View all notes |
Set NEW NOTE alert |
Company Profile |
SEC
News |
Chart |
Request a new note
C
A
S
I |
Symbol/Exchange
Company Name
Industry Group |
PRICE |
CHANGE
(%Change) |
Day High |
Volume
(% DAV)
(% 50 day avg vol) |
52 Wk Hi
% From Hi |
Featured
Date |
Price
Featured |
Pivot Featured |
|
Max Buy |
ENPH
-
NASDAQ
Enphase Energy Inc
Energy-Solar
|
$247.42
|
-7.68
-3.01% |
$259.00
|
1,471,824
61.87% of 50 DAV
50 DAV is 2,379,000
|
$282.46
-12.41%
|
10/28/2021
|
$218.00
|
PP = $229.14
|
|
MB = $240.60
|
Most Recent Note - 11/23/2021 5:38:11 PM
G - Fell today following a "negative reversal" on the prior session after it powered to a new all-time high. It is extended from the previously noted base. Prior high ($229) defines initial support to watch on pullbacks.
>>> FEATURED STOCK ARTICLE : Enphase is Challenging its All-Time High With Volume-Driven Gains - 10/28/2021 |
View all notes |
Set NEW NOTE alert |
Company Profile |
SEC
News |
Chart |
Request a new note
C
A
S
I |
SMPL
-
NASDAQ
Simply Good Foods Co
Food-Confectionery
|
$37.93
|
-1.74
-4.39% |
$39.59
|
382,682
103.99% of 50 DAV
50 DAV is 368,000
|
$41.35
-8.27%
|
10/25/2021
|
$38.30
|
PP = $38.60
|
|
MB = $40.53
|
Most Recent Note - 11/26/2021 2:50:51 PM
Y - Pulled back with higher (near average) volume today, testing near prior highs in the $38 area and its 50 DMA line ($37.30) which define important near-term support.
>>> FEATURED STOCK ARTICLE : Consolidating Above Prior High Following Recent Technical Breakout - 11/15/2021 |
View all notes |
Set NEW NOTE alert |
Company Profile |
SEC
News |
Chart |
Request a new note
C
A
S
I |
WDAY
-
NYSE
Workday Inc Cl A
Computer Sftwr-Enterprse
|
$277.55
|
-0.33
-0.12% |
$282.66
|
1,244,466
78.35% of 50 DAV
50 DAV is 1,588,400
|
$307.81
-9.83%
|
9/7/2021
|
$275.69
|
PP = $282.87
|
|
MB = $297.01
|
Most Recent Note - 11/23/2021 12:52:22 PM
G - Slump below prior highs in the $278-282 area and its 50 DMA line violation are raising concerns and triggering a technical sell signal. Only a prompt rebound would help its outlook improve. Color code is changed to green after slumping below its 50 DMA line ($275) with today's 4th consecutive volume-driven loss off its record high. Reported Oct '21 quarterly earnings +28% on +20% sales revenues versus the year ago period. Fundamentals remain strong.
>>> FEATURED STOCK ARTICLE : Getting Extended From Previously Noted Base - 11/16/2021 |
View all notes |
Set NEW NOTE alert |
Company Profile |
SEC
News |
Chart |
Request a new note
C
A
S
I |
CTLT
-
NYSE
"Catalent, Inc"
DRUGS - Biotechnology
|
$132.31
|
+2.72
2.10% |
$135.10
|
997,515
112.45% of 50 DAV
50 DAV is 887,100
|
$142.64
-7.24%
|
8/25/2021
|
$128.72
|
PP = $127.78
|
|
MB = $134.17
|
Most Recent Note - 11/24/2021 5:10:54 PM
G - The 50 DMA line ($131.59) has been acting as resistance. Its Relative Strength Rating is 78, still below the 80+ minimum guideline for buy candidates. Halted its slide above its 200 DMA line ($117.73). More damaging losses would raise greater concerns. Fundamentals remain strong after it reported Sep '21 quarterly earnings +65% on +21% sales revenues versus the year ago period, continuing its strong earnings track record.
>>> FEATURED STOCK ARTICLE : Recent Violation of 50-Day Moving Average Triggered Sell Signal - 11/11/2021 |
View all notes |
Set NEW NOTE alert |
Company Profile |
SEC
News |
Chart |
Request a new note
C
A
S
I |
TTD
-
NASDAQ
The Trade Desk Inc Cl A
Comml Svcs-Advertising
|
$103.98
|
-2.23
-2.10% |
$108.49
|
2,543,216
49.42% of 50 DAV
50 DAV is 5,146,000
|
$114.09
-8.86%
|
11/9/2021
|
$95.16
|
PP = $90.00
|
|
MB = $94.50
|
Most Recent Note - 11/22/2021 1:31:34 PM
G - Abruptly pulling back with today's 3rd loss in 4 sessions after a spurt of volume-driven gains left it very extended from the previously noted 9-month cup-with-handle shaped base. Prior highs define initial support to watch.
>>> FEATURED STOCK ARTICLE : Powerful Volume-Driven Gains for New Highs - 11/9/2021 |
View all notes |
Set NEW NOTE alert |
Company Profile |
SEC
News |
Chart |
Request a new note
C
A
S
I |
Symbol/Exchange
Company Name
Industry Group |
PRICE |
CHANGE
(%Change) |
Day High |
Volume
(% DAV)
(% 50 day avg vol) |
52 Wk Hi
% From Hi |
Featured
Date |
Price
Featured |
Pivot Featured |
|
Max Buy |
MEDP
-
NASDAQ
Medpace Holdings Inc
Medical-Research Eqp/Svc
|
$210.01
|
-4.00
-1.87% |
$214.08
|
139,259
84.91% of 50 DAV
50 DAV is 164,000
|
$231.00
-9.09%
|
9/10/2021
|
$196.32
|
PP = $196.22
|
|
MB = $206.03
|
Most Recent Note - 11/23/2021 5:34:44 PM
G - Suffered a 2nd consecutive big loss today while abruptly retreating from its 52-week high. As recently noted, Sep '21 earnings rose +18% on +28% sales revenues versus the year ago period, below the +25% minimum earnings guideline (C criteria), raising fundamental concerns. Its 50 DMA line ($202) and prior highs in the $199 area define important near-term support to watch.
>>> FEATURED STOCK ARTICLE : Medpace Hovering at High With Volume Totals Cooling - 11/17/2021 |
View all notes |
Set NEW NOTE alert |
Company Profile |
SEC
News |
Chart |
Request a new note
C
A
S
I |
JEF
-
NYSE
Jefferies Financial Grp
Finance-Invest Bnk/Bkrs
|
$39.08
|
-0.90
-2.25% |
$39.19
|
902,073
50.79% of 50 DAV
50 DAV is 1,776,000
|
$44.47
-12.12%
|
6/28/2021
|
$31.81
|
PP = $34.42
|
|
MB = $36.14
|
Most Recent Note - 11/23/2021 5:29:33 PM
G - Found prompt support near its 50 DMA line ($40.44) after a streak of losses. More damaging losses would raise greater concerns. Reported Aug '21 quarterly earnings +40% on +20% sales revenues versus the year ago period.
>>> FEATURED STOCK ARTICLE : Extended From Prior Highs and Stubbornly Holding Ground - 11/1/2021 |
View all notes |
Set NEW NOTE alert |
Company Profile |
SEC
News |
Chart |
Request a new note
C
A
S
I |
AVTR
-
NYSE
Avantor Inc
Medical-Research Eqp/Svc
|
$39.62
|
+0.00
0.00% |
$40.75
|
2,238,961
54.52% of 50 DAV
50 DAV is 4,107,000
|
$44.37
-10.71%
|
6/10/2021
|
$32.94
|
PP = $34.09
|
|
MB = $35.79
|
Most Recent Note - 11/26/2021 2:13:47 PM
G - Ended near the session low today, still sputtering and meeting resistance at its 50 DMA line ($39.73). A rebound above the 50 DMA line is needed for its outlook to improve, and it faces overhead supply up to the $44 level. Reported Sep '21 quarterly earnings +46% above the year ago period. Completed a Secondary Offering on 9/13/21.
>>> FEATURED STOCK ARTICLE : Faces Resistance While Sputtering Below 50 DMA Line - 11/12/2021 |
View all notes |
Set NEW NOTE alert |
Company Profile |
SEC
News |
Chart |
Request a new note
C
A
S
I |
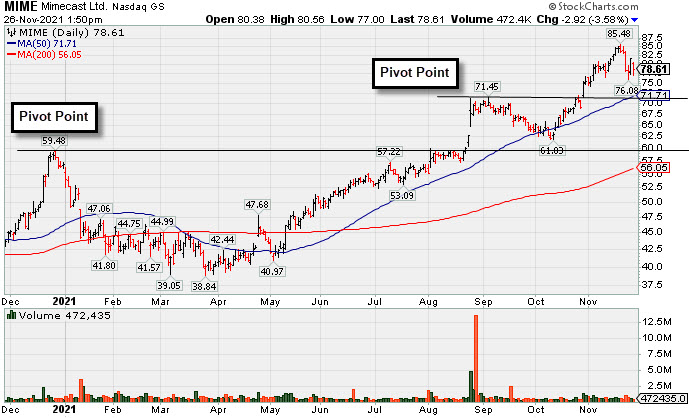
MIME
-
NASDAQ
Mimecast Limited
Computer Sftwr-Security
|
$77.94
|
-3.59
-4.40% |
$80.56
|
613,635
106.53% of 50 DAV
50 DAV is 576,000
|
$85.48
-8.82%
|
10/18/2021
|
$68.17
|
PP = $71.55
|
|
MB = $75.13
|
Most Recent Note - 11/26/2021 2:12:16 PM
G - Still extended from the previously noted base. Prior highs in the $71 area define important near-term support along with its 50 DMA line ($71.69). See the latest FSU analysis for more details and a new annotated graph.
>>> FEATURED STOCK ARTICLE : Extended From Latest Base While Fundamentals Remain Strong - 11/26/2021 |
View all notes |
Set NEW NOTE alert |
Company Profile |
SEC
News |
Chart |
Request a new note
C
A
S
I |
ZD
-
NASDAQ
Ziff Davis Inc
Internet-Content
|
$111.82
|
-4.94
-4.23% |
$115.47
|
166,106
39.06% of 50 DAV
50 DAV is 425,300
|
$135.00
-17.17%
|
10/25/2021
|
$126.07
|
PP = $128.19
|
|
MB = $134.60
|
Most Recent Note - 11/26/2021 2:48:43 PM
Violated its 200 DMA line ($114) with today's big loss raising serious concerns. Its Relative Strength Rating has slumped to 78. It will be dropped from the Featured Stocks list tonight. Only a prompt rebound above the 50 DMA line would help its outlook improve.
>>> FEATURED STOCK ARTICLE : Internet Content Firm Perched Near Prior High - 10/25/2021 |
View all notes |
Set NEW NOTE alert |
Company Profile |
SEC
News |
Chart |
Request a new note
C
A
S
I |
Symbol/Exchange
Company Name
Industry Group |
PRICE |
CHANGE
(%Change) |
Day High |
Volume
(% DAV)
(% 50 day avg vol) |
52 Wk Hi
% From Hi |
Featured
Date |
Price
Featured |
Pivot Featured |
|
Max Buy |