***Last / Change / Volume data in this table is the closing quote data***
Symbol/Exchange
Company Name
Industry Group |
PRICE |
CHANGE
(%Change) |
Day High |
Volume
(% DAV)
(% 50 day avg vol) |
52 Wk Hi
% From Hi |
Featured
Date |
Price
Featured |
Pivot Featured |
|
Max Buy |
 SIVB
-
NASDAQ
SIVB
-
NASDAQ
S V B Financial Group
BANKING - Regional - Pacific Banks
|
$747.99
|
+4.09
0.55% |
$756.14
|
234,649
68.01% of 50 DAV
50 DAV is 345,000
|
$762.95
-1.96%
|
8/6/2021
|
$589.70
|
PP = $608.94
|
|
MB = $639.39
|
Most Recent Note - 11/12/2021 5:02:58 PM
G - Volume totals have been cooling while hovering near its all-time high, extended from the previously noted base. Recently reported Sep '21 quarterly earnings -14% on +43% sales revenues versus the year ago period, below the +25% minimum earnings guideline (C criteria), raising fundamental concerns. Its 50 DMA line ($672) defines important near-term support to watch on pullbacks. Completed a new Public Offering on 8/11/21.
>>> FEATURED STOCK ARTICLE : Latest Quarter Raised Fundamental Concerns - 10/29/2021 |
View all notes |
Set NEW NOTE alert |
Company Profile |
SEC
News |
Chart |
Request a new note
C
A
S
I |
BLDR
-
NYSE
Builders Firstsource Inc
Bldg-Constr Prds/Misc
|
$67.00
|
-1.00
-1.47% |
$68.90
|
1,999,960
107.01% of 50 DAV
50 DAV is 1,869,000
|
$68.92
-2.79%
|
8/12/2021
|
$52.38
|
PP = $54.09
|
|
MB = $56.79
|
Most Recent Note - 11/11/2021 5:08:35 PM
G - Volume totals have been cooling while hovering near its all-time high, very extended from any sound base. Bullish action came after it reported Sep '21 quarterly earnings +308% on +140% sales revenues versus the year ago period. Its 50 DMA line ($56.71) and prior highs in the $55 area define important near-term support to watch on pullbacks.
>>> FEATURED STOCK ARTICLE : Earnings News Due Thursday for High-Ranked Building Products Firm - 11/2/2021 |
View all notes |
Set NEW NOTE alert |
Company Profile |
SEC
News |
Chart |
Request a new note
C
A
S
I |
KFRC
-
NASDAQ
Kforce Inc
Comml Svcs-Staffing
|
$78.09
|
-0.04
-0.05% |
$78.97
|
116,767
109.13% of 50 DAV
50 DAV is 107,000
|
$78.48
-0.50%
|
9/10/2021
|
$59.53
|
PP = $64.48
|
|
MB = $67.70
|
Most Recent Note - 11/12/2021 5:00:36 PM
G - Extended from any sound base and perched at its all-time high following today's 12th consecutive gain. Fundamentals remain strong. Its 50 DMA line ($64.65) and recent low define important near-term support to watch on pullbacks.
>>> FEATURED STOCK ARTICLE : Pulling Back Near Prior Highs Following Technical Breakout - 10/15/2021 |
View all notes |
Set NEW NOTE alert |
Company Profile |
SEC
News |
Chart |
Request a new note
C
A
S
I |
GNRC
-
NYSE
Generac Hldgs Inc
Electrical-Power/Equipmt
|
$434.16
|
-12.71
-2.84% |
$446.51
|
537,426
82.43% of 50 DAV
50 DAV is 652,000
|
$524.31
-17.19%
|
8/30/2021
|
$449.36
|
PP = $457.10
|
|
MB = $479.96
|
 Most Recent Note - 11/15/2021 3:57:55 PM
G - Sputtering below its 50 DMA line ($444) with a loss today on light volume. Churned above average volume after a "negative reversal" noted at its all-time high. Weak action came after it reported Sep '21 quarterly earnings +13% on +34% sales revenues versus the year ago period, below the +25% minimum earnings guideline (C criteria), raising fundamental concerns.
>>> FEATURED STOCK ARTICLE : Halted Slide at 50-Day Moving Average After Earnings News - 11/8/2021 |
View all notes |
Set NEW NOTE alert |
Company Profile |
SEC
News |
Chart |
Request a new note
C
A
S
I |
CAMT
-
NASDAQ
Camtek Ltd
ELECTRONICS - Scientific and Technical Instrum
|
$47.49
|
-0.66
-1.37% |
$49.60
|
371,654
228.01% of 50 DAV
50 DAV is 163,000
|
$49.40
-3.87%
|
11/9/2021
|
$45.43
|
PP = $46.11
|
|
MB = $48.42
|
Most Recent Note - 11/15/2021 12:14:04 PM
Y - Perched at its all-time high today. A big gain above its pivot point on the prior session backed by +196% above average volume triggered a new (or add-on) technical buy signal. Reported Sep '21 quarterly earnings +150% versus the year ago period. Fundamentals remain strong.
>>> FEATURED STOCK ARTICLE : Rebound Above 50-Day Moving Average Helped Outlook - 11/5/2021 |
View all notes |
Set NEW NOTE alert |
Company Profile |
SEC
News |
Chart |
Request a new note
C
A
S
I |
Symbol/Exchange
Company Name
Industry Group |
PRICE |
CHANGE
(%Change) |
Day High |
Volume
(% DAV)
(% 50 day avg vol) |
52 Wk Hi
% From Hi |
Featured
Date |
Price
Featured |
Pivot Featured |
|
Max Buy |
AMD
-
NASDAQ
Advanced Micro Devices
ELECTRONICS - Semiconductor - Broad Line
|
$146.49
|
-1.40
-0.95% |
$148.98
|
52,108,085
105.15% of 50 DAV
50 DAV is 49,558,000
|
$155.65
-5.88%
|
10/27/2021
|
$124.91
|
PP = $122.59
|
|
MB = $128.72
|
Most Recent Note - 11/11/2021 3:41:50 PM
G - Perched near its all-time high following considerable volume-driven gains, very extended from the previously noted base. Disciplined investors avoid chasing extended stocks. Prior high in the $122 area defines initial support to watch on pullbacks. Fundamentals remain strong after it reported Sep '21 quarterly earnings +78% on +54% sales revenues versus the year ago period.
>>> FEATURED STOCK ARTICLE : Encountered Distributional Pressure After Reaching New High - 10/27/2021 |
View all notes |
Set NEW NOTE alert |
Company Profile |
SEC
News |
Chart |
Request a new note
C
A
S
I |
UMC
-
NYSE
United Microelectrnc Adr
ELECTRONICS - Semiconductor - Integrated Cir
|
$11.38
|
+0.08
0.71% |
$11.45
|
4,662,360
60.90% of 50 DAV
50 DAV is 7,656,000
|
$12.62
-9.83%
|
8/5/2021
|
$11.62
|
PP = $11.38
|
|
MB = $11.95
|
Most Recent Note - 11/11/2021 3:51:00 PM
G - Gains above the 50 DMA line ($11.14) this week have helped its outlook to improve. Reported Sep '21 quarterly earnings +100% on +30% sales revenues versus the year ago period. Recently found support above its 200 DMA line ($9.99).
>>> FEATURED STOCK ARTICLE : Earnings News Due From Taiwan-Based Semiconductor Firm - 10/26/2021 |
View all notes |
Set NEW NOTE alert |
Company Profile |
SEC
News |
Chart |
Request a new note
C
A
S
I |
BRKS
-
NASDAQ
Brooks Automation
ELECTRONICS - Semiconductor Equipment and Mate
|
$114.41
|
-0.47
-0.41% |
$117.62
|
423,302
71.27% of 50 DAV
50 DAV is 593,900
|
$124.79
-8.32%
|
9/20/2021
|
$101.21
|
PP = $108.82
|
|
MB = $114.26
|
Most Recent Note - 11/11/2021 12:36:53 PM
Y - Reported Sep 21 quarterly earnings +33% on +27% sales revenues versus the year ago period. Volume and volatility often increase near earnings news. Color code is changed to yellow while pulling back below its "max buy" level with volume-driven losses. Prior high in the $110 area defines initial support to watch above its 50 DMA line ($104.66).
>>> FEATURED STOCK ARTICLE : 5th Quiet Gain Has Brooks Perched Near Prior Highs - 10/20/2021 |
View all notes |
Set NEW NOTE alert |
Company Profile |
SEC
News |
Chart |
Request a new note
C
A
S
I |
ENTG
-
NASDAQ
Entegris Inc
ELECTRONICS - Semiconductor Equipment and Mate
|
$149.97
|
+0.21
0.14% |
$152.45
|
680,882
81.35% of 50 DAV
50 DAV is 837,000
|
$150.90
-0.62%
|
8/4/2021
|
$125.33
|
PP = $126.51
|
|
MB = $132.84
|
Most Recent Note - 11/15/2021 4:43:32 PM
G - Perched at its all-time high with today's small gain on light volume, very extended from any sound base. Prior high ($136) and its 50 DMA line ($132.22) define near-term support to watch. Fundamentals remain strong after it recently reported Sep '21 quarterly earnings +37% on +20% sales revenues versus the year ago period.
>>> FEATURED STOCK ARTICLE : Hit New Record High With Another Volume-Driven Gain - 10/22/2021 |
View all notes |
Set NEW NOTE alert |
Company Profile |
SEC
News |
Chart |
Request a new note
C
A
S
I |
SKY
-
NYSE
Skyline Champion Corp
Bldg-Mobile/Mfg andamp; RV
|
$75.78
|
-0.21
-0.28% |
$76.75
|
262,294
69.21% of 50 DAV
50 DAV is 379,000
|
$77.40
-2.09%
|
11/3/2021
|
$72.19
|
PP = $66.92
|
|
MB = $70.27
|
Most Recent Note - 11/11/2021 5:10:22 PM
G - Extended from the previously noted flat base. Prior highs in the $66 area define initial support to watch above its 50 DMA line ($64.17) on pullbacks. Reported very strong Mar, Jun and Sep '21 quarterly results versus the year ago periods well above the +25% minimum earnings guideline (C criteria). Annual earnings (A criteria) history has been strong.
>>> FEATURED STOCK ARTICLE : Breakaway Gap After 10-Week Flat Base - 11/3/2021 |
View all notes |
Set NEW NOTE alert |
Company Profile |
SEC
News |
Chart |
Request a new note
C
A
S
I |
Symbol/Exchange
Company Name
Industry Group |
PRICE |
CHANGE
(%Change) |
Day High |
Volume
(% DAV)
(% 50 day avg vol) |
52 Wk Hi
% From Hi |
Featured
Date |
Price
Featured |
Pivot Featured |
|
Max Buy |
WSM
-
NYSE
Williams Sonoma Inc
RETAIL - Home Furnishing Stores
|
$212.00
|
+1.51
0.72% |
$214.46
|
1,151,060
137.03% of 50 DAV
50 DAV is 840,000
|
$211.43
0.27%
|
11/3/2021
|
$205.00
|
PP = $195.09
|
|
MB = $204.84
|
Most Recent Note - 11/12/2021 5:08:15 PM
G - Hit another new all-time high with today's solid gain. Prior highs define near-term support to watch above its 50 DMA line ($185.63).
>>> FEATURED STOCK ARTICLE : Volume-Driven Gains May Signal a New Meaningful Leg Up - 11/4/2021 |
View all notes |
Set NEW NOTE alert |
Company Profile |
SEC
News |
Chart |
Request a new note
C
A
S
I |
CLFD
-
NASDAQ
Clearfield Inc
TELECOMMUNICATIONS - Cables / Satalite Equipment
|
$66.10
|
-4.15
-5.91% |
$72.00
|
369,810
348.88% of 50 DAV
50 DAV is 106,000
|
$70.89
-6.76%
|
7/23/2021
|
$40.23
|
PP = $43.74
|
|
MB = $45.93
|
Most Recent Note - 11/15/2021 12:15:10 PM
G - Reversed into the red after hitting yet another new all-time high with today's early gain. It is very extended from the previously noted base. Its 50 DMA line ($51.76) defines near-term support to watch on pullbacks. Reported Sep '21 quarterly earnings +141% on +66% sales revenues above the year ago period.
>>> FEATURED STOCK ARTICLE : Extended From Prior Base After Latest Rally - 10/18/2021 |
View all notes |
Set NEW NOTE alert |
Company Profile |
SEC
News |
Chart |
Request a new note
C
A
S
I |
TGH
-
NYSE
Textainer Group Holdings
TRANSPORTATION - Logistics
|
$37.38
|
-0.52
-1.37% |
$38.06
|
493,110
102.95% of 50 DAV
50 DAV is 479,000
|
$41.24
-9.36%
|
10/7/2021
|
$36.97
|
PP = $36.80
|
|
MB = $38.64
|
Most Recent Note - 11/12/2021 5:06:14 PM
Y - Pulled back today for a loss with slightly higher volume. Its 50 DMA line ($36.14) and prior highs define important near-term support to watch. Fundamentals remain strong.
>>> FEATURED STOCK ARTICLE : Pulling Back Below "Max Buy" Level With Lighter Volume - 11/10/2021 |
View all notes |
Set NEW NOTE alert |
Company Profile |
SEC
News |
Chart |
Request a new note
C
A
S
I |
ENPH
-
NASDAQ
Enphase Energy Inc
Energy-Solar
|
$244.71
|
-6.91
-2.75% |
$253.99
|
1,680,787
71.74% of 50 DAV
50 DAV is 2,343,000
|
$254.70
-3.92%
|
10/28/2021
|
$218.00
|
PP = $229.14
|
|
MB = $240.60
|
Most Recent Note - 11/15/2021 4:45:38 PM
G - Pulled back today from its all-time high with a loss on light volume. Extended from the previously noted base. Prior high ($229) defines initial support to watch on pullbacks.
>>> FEATURED STOCK ARTICLE : Enphase is Challenging its All-Time High With Volume-Driven Gains - 10/28/2021 |
View all notes |
Set NEW NOTE alert |
Company Profile |
SEC
News |
Chart |
Request a new note
C
A
S
I |
SMPL
-
NASDAQ
Simply Good Foods Co
Food-Confectionery
|
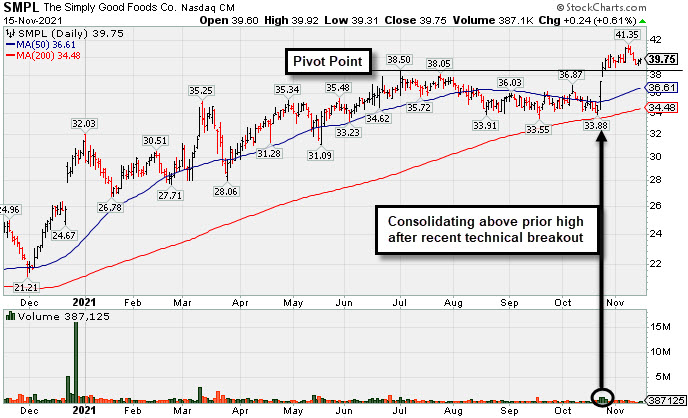
$39.75
|
+0.24
0.61% |
$39.92
|
394,194
109.20% of 50 DAV
50 DAV is 361,000
|
$41.35
-3.87%
|
10/25/2021
|
$38.30
|
PP = $38.60
|
|
MB = $40.53
|
Most Recent Note - 11/15/2021 4:26:03 PM
Y - Still quietly consolidating above prior highs and below its "max buy" level. Prior highs in the $38 area define initial support to watch above its 50 DMA line ($36.61).
>>> FEATURED STOCK ARTICLE : Consolidating Just Above 50-Day Moving Average Line - 10/12/2021 |
View all notes |
Set NEW NOTE alert |
Company Profile |
SEC
News |
Chart |
Request a new note
C
A
S
I |
Symbol/Exchange
Company Name
Industry Group |
PRICE |
CHANGE
(%Change) |
Day High |
Volume
(% DAV)
(% 50 day avg vol) |
52 Wk Hi
% From Hi |
Featured
Date |
Price
Featured |
Pivot Featured |
|
Max Buy |
WDAY
-
NASDAQ
Workday Inc Cl A
Computer Sftwr-Enterprse
|
$295.60
|
-0.85
-0.29% |
$299.00
|
1,262,912
93.69% of 50 DAV
50 DAV is 1,348,000
|
$300.78
-1.72%
|
9/7/2021
|
$275.69
|
PP = $282.87
|
|
MB = $297.01
|
Most Recent Note - 11/11/2021 3:53:09 PM
Y - Poised for a best-ever close with another gain today lacking great volume conviction as it wedges into new high territory. No resistance remains due to overhead supply. Its 50 DMA line ($272) defines near-term support to watch where a violation would raise concerns. Fundamentals remain strong.
>>> FEATURED STOCK ARTICLE : Rebounding From 50-Day Moving Average Toward Prior Highs - 10/13/2021 |
View all notes |
Set NEW NOTE alert |
Company Profile |
SEC
News |
Chart |
Request a new note
C
A
S
I |
CTLT
-
NYSE
"Catalent, Inc"
DRUGS - Biotechnology
|
$128.21
|
+0.16
0.12% |
$129.03
|
680,685
74.90% of 50 DAV
50 DAV is 908,800
|
$142.64
-10.12%
|
8/25/2021
|
$128.72
|
PP = $127.78
|
|
MB = $134.17
|
Most Recent Note - 11/11/2021 12:39:01 PM
G - Recently violated prior lows in the $126-127 area and its 50 DMA line triggering technical sell signals. Its Relative Strength Rating has slumped to 63, below the 80+ minimum guideline for buy candidates. Fundamentals remain strong after it reported Sep '21 quarterly earnings +65% on +21% sales revenues versus the year ago period, continuing its strong earnings track record.
>>> FEATURED STOCK ARTICLE : Recent Violation of 50-Day Moving Average Triggered Sell Signal - 11/11/2021 |
View all notes |
Set NEW NOTE alert |
Company Profile |
SEC
News |
Chart |
Request a new note
C
A
S
I |
TTD
-
NASDAQ
The Trade Desk Inc Cl A
Comml Svcs-Advertising
|
$105.45
|
+5.12
5.10% |
$108.52
|
11,601,491
253.70% of 50 DAV
50 DAV is 4,573,000
|
$100.59
4.83%
|
11/9/2021
|
$95.16
|
PP = $90.00
|
|
MB = $94.50
|
Most Recent Note - 11/15/2021 12:37:51 PM
G - Posting another big gain today with higher volume, getting very extended from prior highs. Found support near the August high on the pullback after its noted breakout from a 9-month cup-with-handle shaped base.
>>> FEATURED STOCK ARTICLE : Powerful Volume-Driven Gains for New Highs - 11/9/2021 |
View all notes |
Set NEW NOTE alert |
Company Profile |
SEC
News |
Chart |
Request a new note
C
A
S
I |
MEDP
-
NASDAQ
Medpace Holdings Inc
Medical-Research Eqp/Svc
|
$218.81
|
-3.06
-1.38% |
$225.18
|
86,374
47.46% of 50 DAV
50 DAV is 182,000
|
$229.49
-4.65%
|
9/10/2021
|
$196.32
|
PP = $196.22
|
|
MB = $206.03
|
Most Recent Note - 11/12/2021 5:01:22 PM
G - Volume totals have still been cooling while stubbornly holding its ground near its 52-week high. Recent bullish action came even after it reported Sep '21 earnings +18% on +28% sales revenues versus the year ago period, below the +25% minimum earnings guideline (C criteria), raising fundamental concerns. Prior highs in the $199 area define initial support above its 50 DMA line ($198).
>>> FEATURED STOCK ARTICLE : Found Prompt Support Near 50-Day Moving Average Line - 10/14/2021 |
View all notes |
Set NEW NOTE alert |
Company Profile |
SEC
News |
Chart |
Request a new note
C
A
S
I |
JEF
-
NYSE
Jefferies Financial Grp
Finance-Invest Bnk/Bkrs
|
$42.89
|
-0.15
-0.35% |
$43.25
|
1,605,201
89.33% of 50 DAV
50 DAV is 1,797,000
|
$44.47
-3.55%
|
6/28/2021
|
$31.81
|
PP = $34.42
|
|
MB = $36.14
|
Most Recent Note - 11/15/2021 3:59:39 PM
G - Encountering distributional pressure in recent weeks while hovering near its all-time high. Its 50 DMA line ($40) defines important near-term support to watch on pullbacks. Reported Aug '21 quarterly earnings +40% on +20% sales revenues versus the year ago period.
>>> FEATURED STOCK ARTICLE : Extended From Prior Highs and Stubbornly Holding Ground - 11/1/2021 |
View all notes |
Set NEW NOTE alert |
Company Profile |
SEC
News |
Chart |
Request a new note
C
A
S
I |
Symbol/Exchange
Company Name
Industry Group |
PRICE |
CHANGE
(%Change) |
Day High |
Volume
(% DAV)
(% 50 day avg vol) |
52 Wk Hi
% From Hi |
Featured
Date |
Price
Featured |
Pivot Featured |
|
Max Buy |
AVTR
-
NYSE
Avantor Inc
Medical-Research Eqp/Svc
|
$38.49
|
+0.46
1.21% |
$39.04
|
3,879,519
86.10% of 50 DAV
50 DAV is 4,506,000
|
$44.37
-13.25%
|
6/10/2021
|
$32.94
|
PP = $34.09
|
|
MB = $35.79
|
Most Recent Note - 11/12/2021 4:58:48 PM
G - Still sputtering after meeting resistance at its 50 DMA line ($40.22). A rebound above the 50 DMA line is needed for its outlook to improve. Bullish action came after it reported Sep '21 quarterly earnings +46% above the year ago period. Completed a Secondary Offering on 9/13/21. Resistance remains due to overhead supply up to the $44 level. See the latest FSU analysis for more details and a new annotated graph.
>>> FEATURED STOCK ARTICLE : Faces Resistance While Sputtering Below 50 DMA Line - 11/12/2021 |
View all notes |
Set NEW NOTE alert |
Company Profile |
SEC
News |
Chart |
Request a new note
C
A
S
I |
MIME
-
NASDAQ
Mimecast Limited
Computer Sftwr-Security
|
$82.70
|
+1.33
1.63% |
$82.76
|
613,494
107.44% of 50 DAV
50 DAV is 571,000
|
$81.49
1.48%
|
10/18/2021
|
$68.17
|
PP = $71.55
|
|
MB = $75.13
|
Most Recent Note - 11/15/2021 4:42:16 PM
G - Stubbornly holding its ground and hitting another new all-time high with today's 3rd consecutive gain, extended from the previously noted base. Prior highs in the $71 area define initial support above its 50 DMA line ($69.64) .
>>> FEATURED STOCK ARTICLE : MIME Consolidating Less Than 4% Off High Building New Base - 10/21/2021 |
View all notes |
Set NEW NOTE alert |
Company Profile |
SEC
News |
Chart |
Request a new note
C
A
S
I |
ZD
-
NASDAQ
Ziff Davis Inc
Internet-Content
|
$127.71
|
-0.67
-0.52% |
$129.39
|
300,411
68.90% of 50 DAV
50 DAV is 436,000
|
$135.00
-5.40%
|
10/25/2021
|
$126.07
|
PP = $128.19
|
|
MB = $134.60
|
Most Recent Note - 11/12/2021 5:10:21 PM
Y - Pulled back today testing prior highs in the $128 area which define initial support to watch above its 50 DMA line. Quarterly and annual earnings (C and A criteria) history has been strong.
>>> FEATURED STOCK ARTICLE : Internet Content Firm Perched Near Prior High - 10/25/2021 |
View all notes |
Set NEW NOTE alert |
Company Profile |
SEC
News |
Chart |
Request a new note
C
A
S
I |