You are not logged in.
This means you
CAN ONLY VIEW reports that were published prior to Friday, April 18, 2025.
You
MUST UPGRADE YOUR MEMBERSHIP if you want to see any current reports.
AFTER MARKET UPDATE - FRIDAY, DECEMBER 17TH, 2021
Previous After Market Report Next After Market Report >>>
|
|
|
|
DOW |
-532.20 |
35,365.44 |
-1.48% |
|
Volume |
3,477,472,600 |
+205% |
|
Volume |
7,592,425,000 |
+57% |
|
NASDAQ |
-10.75 |
15,169.68 |
-0.07% |
|
Advancers |
1,363 |
42% |
|
Advancers |
2,444 |
55% |
|
S&P 500 |
-48.03 |
4,620.64 |
-1.03% |
|
Decliners |
1,844 |
57% |
|
Decliners |
1,996 |
45% |
|
Russell 2000 |
+21.48 |
2,173.93 |
+1.00% |
|
52 Wk Highs |
41 |
|
|
52 Wk Highs |
49 |
|
|
S&P 600 |
+4.25 |
1,345.15 |
+0.32% |
|
52 Wk Lows |
162 |
|
|
52 Wk Lows |
439 |
|
|
New buying efforts can be made in stocks meeting all key criteria of the fact-based investment system after the big gain Wednesday from the Nasdaq Composite Index (+2.1%) with higher volume and an expansion in leadership (stocks hitting new 52-week highs) established a new confirmed uptrend for the market (M criteria).
|
 |
Leadership Thins as Major Indices Encounter More Damaging Pressure
Kenneth J. Gruneisen - Passed the CAN SLIM® Master's Exam
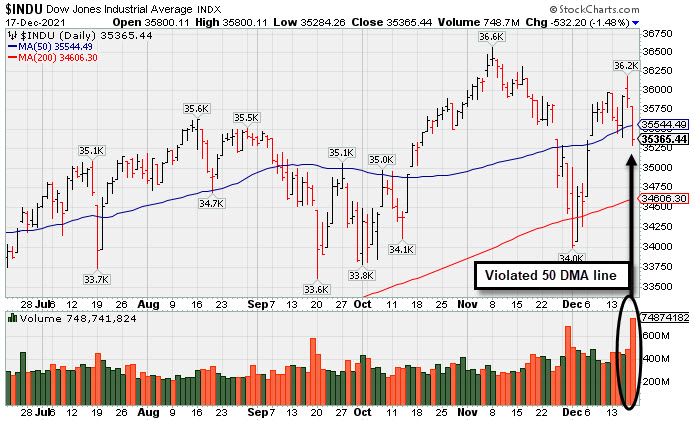
The Dow lost 532 points to end the week 1.7% lower. The S&P 500 slipped 1%, bringing its weekly decline to 1.9% after notching a record level last Friday, December 10. The Nasdaq Composite trimmed an earlier loss of 1.5% to settle little changed (-0.1%), posting a weekly slide of 3%. Friday's volume totals reported were higher than the prior session on the NYSE and on the Nasdaq exchange, inflated by options expirations. Breadth was negative as decliners led advancers by almost a 3-2 margin on the NYSE and by a 5-4 margin on the Nasdaq exchange. Leadership grew thin as there were only 9 high-ranked companies from the Leaders List that hit new 52-week highs and were listed on the BreakOuts Page, versus the total of 48 on the prior session. New 52-week highs were solidly outnumbered by new 52-week lows on the NYSE and on the Nasdaq exchange. Solid gains on Wednesday signaled a new confirmed uptrend for the market (M criteria), opening the door again to new buying efforts under the fact-based investment system.
 PICTURED: The Dow Jones Industrial Average suffered big loss with heavy volume on Friday and closed below its 50-day moving average (DMA) line following a noted "negative reversal" on the prior session. Caution may be advised as the weak action does not bode well for the nascent rally.
The tech-heavy Nasdaq Composite index has fallen more than 5.5% from its most recent November 19 peak as the prospect of higher interest rates and valuation concerns sparked a rout in growth-related shares on Thursday. Increased volatility was a factor amid a quarterly event known as triple witching - the simultaneous expiration of stock options, index options, and index futures - along with the rebalancing of major indexes. Trading volume was roughly 30% higher than the average of the past month.
Wall Street weighed rising COVID-19 cases and assessed the implications of monetary policy pivots from global central banks. In central bank news, Federal Reserve (Fed) Governor Waller suggested rate hikes could be warranted as soon as March. This followed the Fed’s announcement from Wednesday that its tapering timeline would be expedited in order to combat inflation. The yield on the two-year note rose two basis points (0.02%) to 0.64%, while the yield on the 10-year note ended the day two basis points (0.02%) lower at 1.41%. WTI crude lost 2.6% to $70.53/barrel as the U.S. dollar jumped 0.6%.
In corporate news, Cerner (CERN +12.93%) rallied on reports that Oracle (ORCL -6.39%) was mulling an acquisition of the healthcare information technology company. In earnings, FedEx (FDX +4.95%) rose on strong results. |
 Kenneth J. Gruneisen started out as a licensed stockbroker in August 1987, a couple of months prior to the historic stock market crash that took the Dow Jones Industrial Average down -22.6% in a single day. He has published daily fact-based fundamental and technical analysis on high-ranked stocks online for two decades. Through FACTBASEDINVESTING.COM, Kenneth provides educational articles, news, market commentary, and other information regarding proven investment systems that work in good times and bad.
Comments contained in the body of this report are technical opinions only and are not necessarily those of Gruneisen Growth Corp. The material herein has been obtained from sources believed to be reliable and accurate, however, its accuracy and completeness cannot be guaranteed. Our firm, employees, and customers may effect transactions, including transactions contrary to any recommendation herein, or have positions in the securities mentioned herein or options with respect thereto. Any recommendation contained in this report may not be suitable for all investors and it is not to be deemed an offer or solicitation on our part with respect to the purchase or sale of any securities. |
|
 |
Biotech, Networking Indexes Rose as Financials and Energy Fell
Kenneth J. Gruneisen - Passed the CAN SLIM® Master's Exam
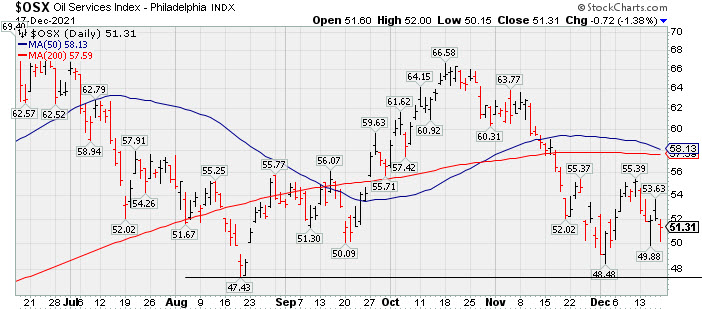
The Bank Index ($BKX -2.83%) and Broker/Dealer Index ($XBD -1.11%) both lost ground and weighed on the major averages and the Retail Index ($RLX -0.39%) also edged lower. The Biotech Index ($BTK +2.83%) and Networking Index ($NWX +1.84%) both posted solid gains while the Semiconductor Index ($SOX -0.14%) ended slightly in the red. The Oil Services Index ($OSX -1.38%) and Integrated Oil Index ($XOI -2.06%) both lost ground while the Gold & Silver Index ($XAU +0.01%) was unchanged.
PICTURED: The Oil Services Index ($OSX -1.38%) has been slumping again. It recently halted its slide just above the August low but it has lingered below its 50-day and 200-day moving average (DMA) lines.
| Oil Services |
$OSX |
51.31 |
-0.72 |
-1.38% |
+15.75% |
| Integrated Oil |
$XOI |
1,134.87 |
-23.88 |
-2.06% |
+43.21% |
| Semiconductor |
$SOX |
3,761.04 |
-5.28 |
-0.14% |
+34.54% |
| Networking |
$NWX |
929.86 |
+16.80 |
+1.84% |
+29.67% |
| Broker/Dealer |
$XBD |
478.60 |
-5.37 |
-1.11% |
+26.75% |
| Retail |
$RLX |
4,179.20 |
-16.20 |
-0.39% |
+17.29% |
| Gold & Silver |
$XAU |
126.59 |
+0.02 |
+0.01% |
-12.21% |
| Bank |
$BKX |
129.49 |
-3.78 |
-2.83% |
+32.26% |
| Biotech |
$BTK |
5,574.62 |
+153.65 |
+2.83% |
-2.86% |
|
|
|
 |
Consolidating Near Prior Highs Above 50-Day Moving Average
Kenneth J. Gruneisen - Passed the CAN SLIM® Master's Exam
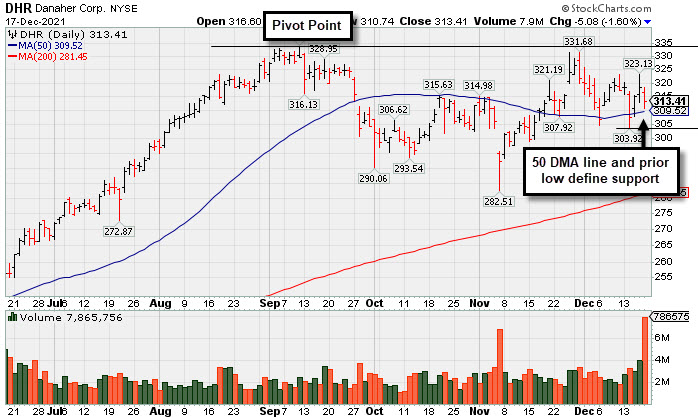
Danaher Corp (DHR -$5.08 or -1.60% to $313.41) was highlighted in yellow in the 12/16/21 mid-day report (read here) with pivot point cited base on its 9/10/21 high plus 10 cents. Consolidating above its 50 DMA line and perched within striking distance of its 52-week high. Subsequent gains above the pivot point for new highs (N criteria) with at least +40% above average volume may trigger a technical buy signal.
DHR has a 92 Earnings Per Share Rating. Reported Sep '21 quarterly earnings +39% on +23% sales revenues versus the year ago period, its 6th strong comparison above the +25% minimum guideline (C criteria) and sales revenues growth has been strong. Annual earnings (A criteria) history has shown slow steady growth. The company has a new CEO as of 9/01/20.
The number of top-rated funds owning its shares rose from 3,131 in Dec '20 to 3,601 in Sep '21, a reassuring sign concerning the I criteria. Its has a Timeliness rating of B and a Sponsorship Rating of B. There is a large supply of 714.6 million shares outstanding (S criteria), which makes it a bit less likely to be a quick sprinter.
|
|
|
Color Codes Explained :
Y - Better candidates highlighted by our
staff of experts.
G - Previously featured
in past reports as yellow but may no longer be buyable under the
guidelines.
***Last / Change / Volume data in this table is the closing quote data***
Symbol/Exchange
Company Name
Industry Group |
PRICE |
CHANGE
(%Change) |
Day High |
Volume
(% DAV)
(% 50 day avg vol) |
52 Wk Hi
% From Hi |
Featured
Date |
Price
Featured |
Pivot Featured |
|
Max Buy |
 BLDR
-
NYSE
BLDR
-
NYSE
Builders Firstsource Inc
Bldg-Constr Prds/Misc
|
$76.83
|
-0.42
-0.54% |
$77.62
|
8,146,511
351.14% of 50 DAV
50 DAV is 2,320,000
|
$80.95
-5.09%
|
8/12/2021
|
$52.38
|
PP = $54.09
|
|
MB = $56.79
|
Most Recent Note - 12/16/2021 5:36:45 PM
G - Stubbornly holding its ground near its all-time high after noted volume-driven gains, very extended from any sound base. Reported Sep '21 quarterly earnings +308% on +140% sales revenues versus the year ago period. It is well above its 50 DMA line ($66.13) which defines near-term support to watch.
>>> FEATURED STOCK ARTICLE : Perched at Record High After +52% Rally in 4 Months - 12/10/2021 |
View all notes |
Set NEW NOTE alert |
Company Profile |
SEC
News |
Chart |
Request a new note
C
A
S
I |
KFRC
-
NASDAQ
Kforce Inc
Comml Svcs-Staffing
|
$73.18
|
+0.07
0.10% |
$73.96
|
241,255
219.32% of 50 DAV
50 DAV is 110,000
|
$81.47
-10.18%
|
9/10/2021
|
$59.53
|
PP = $64.48
|
|
MB = $67.70
|
Most Recent Note - 12/15/2021 5:43:11 PM
G - Posted a solid gain today with average volume, finding prompt support at its 50 DMA line ($71.67). Recently reported Sep '21 quarterly earnings +8% on +10% sales revenues versus the year ago period, below the +25% minimum earnings guideline (C criteria), raising fundamental concerns.
>>> FEATURED STOCK ARTICLE : Extended From Base and Latest Quarter Earnings Growth Sub Par - 11/19/2021 |
View all notes |
Set NEW NOTE alert |
Company Profile |
SEC
News |
Chart |
Request a new note
C
A
S
I |
REGN
-
NASDAQ
Regeneron Pharmaceutical
DRUGS - Biotechnology
|
$619.28
|
-12.46
-1.97% |
$631.16
|
1,623,136
209.44% of 50 DAV
50 DAV is 775,000
|
$686.62
-9.81%
|
12/13/2021
|
$647.95
|
PP = $686.72
|
|
MB = $721.06
|
Most Recent Note - 12/16/2021 5:40:30 PM
Y - Suffered a big loss today with +61% above average volume raising concerns. Color code was recently changed to yellow with new pivot point cited based on its 9/01/21 high plus 10 cents. Subsequent gains above the pivot point backed by at least +40% above average volume may trigger a technical buy signal. Its Relative Strength rating has slumped to 84, but it is still above the 80+ minimum guideline for buy candidates.
>>> FEATURED STOCK ARTICLE : Consolidating Near All-Time High With Little Resistance Remaining - 12/13/2021 |
View all notes |
Set NEW NOTE alert |
Company Profile |
SEC
News |
Chart |
Request a new note
C
A
S
I |
LLY
-
NYSE
Eli Lilly & Co
Medical-Diversified
|
$267.42
|
-11.62
-4.16% |
$276.67
|
7,442,933
245.80% of 50 DAV
50 DAV is 3,028,000
|
$283.91
-5.81%
|
12/16/2021
|
$279.28
|
PP = $275.97
|
|
MB = $289.77
|
 Most Recent Note - 12/17/2021 1:02:38 PM
Y - Retreating from its all-time high with today's loss after a streak of gains. Finished strong after highlighted in yellow in the prior mid-day report with pivot point cited based on its 8/17/21 high plus 10 cents. This giant Medical - Diversified firm triggered a technical buy signal as it powered to new all-time highs with +78% above average volume behind its 5th consecutive gain after a choppy 17-week consolidation. Reported Sep '21 quarterly earnings +38% on +18% sales revenues versus the year ago period, and 3 of the past 4 quarterly comparisons were above the +25% minimum earnings guideline (C criteria). Annual earnings (A criteria) improved steadily since a downturn in FY '14. See the latest FSU analysis for more details and an annotated graph.
>>> FEATURED STOCK ARTICLE : Eli Lilly & Co Powered to New Highs With Volume - 12/16/2021 |
View all notes |
Set NEW NOTE alert |
Company Profile |
SEC
News |
Chart |
Request a new note
C
A
S
I |
CAMT
-
NASDAQ
Camtek Ltd
ELECTRONICS - Scientific and Technical Instrum
|
$41.85
|
+1.07
2.62% |
$42.41
|
290,210
112.92% of 50 DAV
50 DAV is 257,000
|
$49.60
-15.63%
|
11/9/2021
|
$45.43
|
PP = $46.11
|
|
MB = $48.42
|
Most Recent Note - 12/16/2021 5:46:54 PM
G - Reversed abruptly and slumped back below its DMA line ($42.57) today with lighter volume. Faces resistance due to overhead supply up to the $49 level. Fundamentals remain strong.
>>> FEATURED STOCK ARTICLE : Closed Above 50-Day Average After Big Gain With Light Volume - 12/15/2021 |
View all notes |
Set NEW NOTE alert |
Company Profile |
SEC
News |
Chart |
Request a new note
C
A
S
I |
Symbol/Exchange
Company Name
Industry Group |
PRICE |
CHANGE
(%Change) |
Day High |
Volume
(% DAV)
(% 50 day avg vol) |
52 Wk Hi
% From Hi |
Featured
Date |
Price
Featured |
Pivot Featured |
|
Max Buy |
AMD
-
NASDAQ
Advanced Micro Devices
ELECTRONICS - Semiconductor - Broad Line
|
$137.75
|
-0.89
-0.64% |
$142.04
|
55,463,536
98.30% of 50 DAV
50 DAV is 56,423,000
|
$164.46
-16.24%
|
10/27/2021
|
$124.91
|
PP = $122.59
|
|
MB = $128.72
|
Most Recent Note - 12/16/2021 5:34:54 PM
G - Erased much of the prior session's big gain as it reversed and suffered another big loss. Its 50 DMA line ($134.84) and prior low ($130.60 on 12/14/21) define important near term support where violations may trigger technical sell signals. Fundamentals remain strong after it reported Sep '21 quarterly earnings +78% on +54% sales revenues versus the year ago period.
>>> FEATURED STOCK ARTICLE : AMD Pulling Back After Considerable Rally - 12/1/2021 |
View all notes |
Set NEW NOTE alert |
Company Profile |
SEC
News |
Chart |
Request a new note
C
A
S
I |
UMC
-
NYSE
United Microelectrnc Adr
ELECTRONICS - Semiconductor - Integrated Cir
|
$11.07
|
+0.06
0.54% |
$11.18
|
6,687,447
81.93% of 50 DAV
50 DAV is 8,161,900
|
$12.68
-12.70%
|
12/1/2021
|
$12.60
|
PP = $12.72
|
|
MB = $13.36
|
Most Recent Note - 12/16/2021 5:51:22 PM
Y - Pulled back today with higher volume retesting support near its 50 DMA line ($11.07). More damaging losses would raise concerns. A gain and solid close above the pivot point may help clinch a proper new (or add-on) technical buy signal. Reported Sep '21 quarterly earnings +100% on +30% sales revenues versus the year ago period.
>>> FEATURED STOCK ARTICLE : Rebound Above 50-Day Moving Average Showed Resilience - 11/30/2021 |
View all notes |
Set NEW NOTE alert |
Company Profile |
SEC
News |
Chart |
Request a new note
C
A
S
I |
ENTG
-
NASDAQ
Entegris Inc
ELECTRONICS - Semiconductor Equipment and Mate
|
$132.96
|
-0.47
-0.35% |
$136.88
|
1,526,684
135.58% of 50 DAV
50 DAV is 1,126,000
|
$158.00
-15.85%
|
8/4/2021
|
$125.33
|
PP = $126.51
|
|
MB = $132.84
|
Most Recent Note - 12/16/2021 5:45:11 PM
G - Suffered another damaging loss today with above average volume and finished weak, violating its 50 DMA line ($142) and triggering a technical sell signal. A rebound above the 50 DMA line is needed for its outlook to improve. Fundamentals remain strong after it recently reported Sep '21 quarterly earnings +37% on +20% sales revenues versus the year ago period.
>>> FEATURED STOCK ARTICLE : Best Ever Close After Volume-Driven Gain - 11/29/2021 |
View all notes |
Set NEW NOTE alert |
Company Profile |
SEC
News |
Chart |
Request a new note
C
A
S
I |
DHR
-
NYSE
Danaher Corp
Medical-Diversified
|
$313.41
|
-5.08
-1.60% |
$318.29
|
7,890,720
313.25% of 50 DAV
50 DAV is 2,519,000
|
$333.96
-6.15%
|
12/16/2021
|
$321.36
|
PP = $334.06
|
|
MB = $350.76
|
Most Recent Note - 12/17/2021 5:34:56 PM
Y - Pulled back today with heavy volume, consolidating above its 50 DMA line and perched within striking distance of its 52-week high. Highlighted in yellow with pivot point cited base on its 9/10/21 high plus 10 cents in the 12/16/21 mid-day report. Subsequent gains above the pivot point with at least +40% above average volume may trigger a technical buy signal. Reported Sep '21 quarterly earnings +39% on +23% sales revenues versus the year ago period, its 6th strong comparison above the +25% minimum guideline (C criteria) and sales revenues growth has been strong. Annual earnings (A criteria) history has shown slow steady growth. Has a new CEO as of 9/01/20. See the latest FSU analysis for more details and a new annotated graph.
>>> FEATURED STOCK ARTICLE : Consolidating Near Prior Highs Above 50-Day Moving Average - 12/17/2021 |
View all notes |
Set NEW NOTE alert |
Company Profile |
SEC
News |
Chart |
Request a new note
C
A
S
I |
SKY
-
NYSE
Skyline Champion Corp
Bldg-Mobile/Mfg andamp; RV
|
$71.86
|
-1.96
-2.66% |
$74.44
|
969,809
218.92% of 50 DAV
50 DAV is 443,000
|
$85.92
-16.36%
|
11/3/2021
|
$72.19
|
PP = $66.92
|
|
MB = $70.27
|
Most Recent Note - 12/16/2021 5:41:49 PM
G - Suffered a 4th consecutive volume-driven loss today, encountering worrisome distributional pressure. Its 50 DMA line ($72.32) defines important near-term support to watch above prior highs in the $66 area. Fundamentals remain strong.
>>> FEATURED STOCK ARTICLE : Pulling Back From All-Time High After Recent Rally - 12/14/2021 |
View all notes |
Set NEW NOTE alert |
Company Profile |
SEC
News |
Chart |
Request a new note
C
A
S
I |
Symbol/Exchange
Company Name
Industry Group |
PRICE |
CHANGE
(%Change) |
Day High |
Volume
(% DAV)
(% 50 day avg vol) |
52 Wk Hi
% From Hi |
Featured
Date |
Price
Featured |
Pivot Featured |
|
Max Buy |
DHI
-
NYSE
D R Horton Inc
MATERIALS and CONSTRUCTION - Residential Construction
|
$103.02
|
-1.45
-1.39% |
$104.69
|
4,283,806
157.61% of 50 DAV
50 DAV is 2,718,000
|
$110.45
-6.73%
|
12/6/2021
|
$104.40
|
PP = $106.99
|
|
MB = $112.34
|
Most Recent Note - 12/16/2021 12:35:58 PM
Y - Posted a solid gain with +156% above average volume and closed above its pivot point on the prior session clinching a technical buy signal. Highlighted in yellow with pivot point cited based on its 5/10/21 high plus 10 cents in the 12/06/21 mid-day report. Reported Sep '21 earnings +68% on +27% sales revenues versus the year-ago period, its 8th strong quarterly comparison above the +25% minimum guideline (C criteria). Annual earnings growth (A criteria) has been strong. The market is in an uptrend (M criteria) and allows for new buying after Wednesday's bullish action confirmed the rally with a follow-through day.
>>> FEATURED STOCK ARTICLE : Builder Built a Solid Base And Challenged Prior High - 12/6/2021 |
View all notes |
Set NEW NOTE alert |
Company Profile |
SEC
News |
Chart |
Request a new note
C
A
S
I |
TITN
-
NASDAQ
Titan Machinery Inc
SPECIALTY RETAIL
|
$31.91
|
-1.11
-3.36% |
$33.09
|
264,479
155.58% of 50 DAV
50 DAV is 170,000
|
$38.58
-17.29%
|
11/23/2021
|
$36.22
|
PP = $35.34
|
|
MB = $37.11
|
Most Recent Note - 12/13/2021 5:23:25 PM
G - Suffered another loss today on higher (near average) volume, still slumping back into the prior base. Reported Oct '21 quarterly earnings +81% on +26% sales revenues over the year ago period, its 4th strong quarterly comparison.
>>> FEATURED STOCK ARTICLE : Strong Close With Gain Backed by +467% Above Average Volume - 11/23/2021 |
View all notes |
Set NEW NOTE alert |
Company Profile |
SEC
News |
Chart |
Request a new note
C
A
S
I |
CLFD
-
NASDAQ
Clearfield Inc
TELECOMMUNICATIONS - Cables / Satalite Equipment
|
$69.83
|
+1.39
2.03% |
$71.05
|
419,878
335.90% of 50 DAV
50 DAV is 125,000
|
$75.87
-7.96%
|
12/16/2021
|
$72.76
|
PP = $72.10
|
|
MB = $75.71
|
Most Recent Note - 12/17/2021 12:45:05 PM
Y - There was a "negative reversal" on the prior session after hitting a new all-time high and recently trading in a wider range intra-day. Color code was changed to yellow with new pivot point cited based on its 11/15/21 high plus 10 cents. Recently formed a "square box" base as it found support well above its 50 DMA line ($61) when consolidating. A gain and close above the pivot point backed by at least +40% above average volume may trigger a new (or add-on) technical buy signal. Reported Sep '21 quarterly earnings +141% on +66% sales revenues above the year ago period.
>>> FEATURED STOCK ARTICLE : Perched Near High Extended From Any Sound Base - 11/22/2021 |
View all notes |
Set NEW NOTE alert |
Company Profile |
SEC
News |
Chart |
Request a new note
C
A
S
I |
ODFL
-
NASDAQ
Old Dominion Fght Line
TRANSPORTATION - Trucking
|
$340.62
|
-10.58
-3.01% |
$350.07
|
1,180,887
198.47% of 50 DAV
50 DAV is 595,000
|
$373.58
-8.82%
|
12/7/2021
|
$365.61
|
PP = $364.17
|
|
MB = $382.38
|
Most Recent Note - 12/13/2021 5:17:35 PM
Y - Hovering in a tight range near its all-time high. Subsequent volume-driven gains are needed to clinch a buy signal, and the broader market direction (M criteria) remains a concern until a follow-through day. Reported earnings +44% on +32% sales revenues for the Sep '21 quarter, its 5th consecutive comparison above the +25% minimum guideline (C criteria).
>>> FEATURED STOCK ARTICLE : Perched at All Time High After Tight Consolidation Several Weeks - 12/7/2021 |
View all notes |
Set NEW NOTE alert |
Company Profile |
SEC
News |
Chart |
Request a new note
C
A
S
I |
SMPL
-
NASDAQ
Simply Good Foods Co
Food-Confectionery
|
$38.91
|
+1.07
2.83% |
$40.00
|
2,360,759
629.54% of 50 DAV
50 DAV is 375,000
|
$41.35
-5.90%
|
10/25/2021
|
$38.30
|
PP = $38.60
|
|
MB = $40.53
|
Most Recent Note - 12/14/2021 5:28:42 PM
G - Still sputtering near its 50 DMA line ($37.83). The prior low and 200 DMA line ($35.37) define the next important support.
>>> FEATURED STOCK ARTICLE : Consolidating Above Prior High Following Recent Technical Breakout - 11/15/2021 |
View all notes |
Set NEW NOTE alert |
Company Profile |
SEC
News |
Chart |
Request a new note
C
A
S
I |
Symbol/Exchange
Company Name
Industry Group |
PRICE |
CHANGE
(%Change) |
Day High |
Volume
(% DAV)
(% 50 day avg vol) |
52 Wk Hi
% From Hi |
Featured
Date |
Price
Featured |
Pivot Featured |
|
Max Buy |
WDAY
-
NYSE
Workday Inc Cl A
Computer Sftwr-Enterprse
|
$273.88
|
+1.65
0.61% |
$275.47
|
2,196,045
136.92% of 50 DAV
50 DAV is 1,603,900
|
$307.81
-11.02%
|
9/7/2021
|
$275.69
|
PP = $282.87
|
|
MB = $297.01
|
Most Recent Note - 12/16/2021 5:54:36 PM
G - Its Relative Strength Rating has fallen to 74, below the 80+ minimum guideline for buy candidates while now sputtering below its 50 DMA line ($280). A rebound above the 50 DMA line is needed for its outlook to improve. Prior low ($258.22 on 12/06/21) and 200 DMA line ($253.70) define the next important support to watch. Reported Oct '21 quarterly earnings +28% on +20% sales revenues versus the year ago period. Fundamentals remain strong.
>>> FEATURED STOCK ARTICLE : Getting Extended From Previously Noted Base - 11/16/2021 |
View all notes |
Set NEW NOTE alert |
Company Profile |
SEC
News |
Chart |
Request a new note
C
A
S
I |
CTLT
-
NYSE
"Catalent, Inc"
DRUGS - Biotechnology
|
$125.37
|
-1.60
-1.26% |
$130.77
|
3,257,954
356.76% of 50 DAV
50 DAV is 913,200
|
$142.64
-12.11%
|
8/25/2021
|
$128.72
|
PP = $127.78
|
|
MB = $134.17
|
Most Recent Note - 12/15/2021 5:41:38 PM
G - Posted a solid gain today with +11% above average volume. A rebound above its 50 DMA line ($129) is still needed for its outlook to improve. Prior low ($119) and 200 DMA line ($118) define important near-term support to watch. More damaging losses would raise greater concerns. Its Relative Strength Rating is 78, below the 80+ minimum guideline for buy candidates. Fundamentals remain strong after it reported Sep '21 quarterly earnings +65% on +21% sales revenues versus the year ago period, continuing its strong earnings track record.
>>> FEATURED STOCK ARTICLE : Recent Violation of 50-Day Moving Average Triggered Sell Signal - 11/11/2021 |
View all notes |
Set NEW NOTE alert |
Company Profile |
SEC
News |
Chart |
Request a new note
C
A
S
I |
TTD
-
NASDAQ
The Trade Desk Inc Cl A
Comml Svcs-Advertising
|
$89.99
|
+2.88
3.31% |
$90.18
|
4,012,144
75.08% of 50 DAV
50 DAV is 5,344,000
|
$114.09
-21.12%
|
11/9/2021
|
$95.16
|
PP = $90.00
|
|
MB = $94.50
|
Most Recent Note - 12/16/2021 5:50:06 PM
G - Slumped today with below average volume, raising concerns as it undercut the prior high ($90) and closed below its 50 DMA line ($88.02) both which were noted as important support to watch. Only a prompt rebound above the 50 DMA line would help its outlook improve.
>>> FEATURED STOCK ARTICLE : Powerful Volume-Driven Gains for New Highs - 11/9/2021 |
View all notes |
Set NEW NOTE alert |
Company Profile |
SEC
News |
Chart |
Request a new note
C
A
S
I |
MEDP
-
NASDAQ
Medpace Holdings Inc
Medical-Research Eqp/Svc
|
$214.87
|
+5.27
2.51% |
$215.76
|
481,271
298.93% of 50 DAV
50 DAV is 161,000
|
$231.00
-6.98%
|
9/10/2021
|
$196.32
|
PP = $196.22
|
|
MB = $206.03
|
Most Recent Note - 12/15/2021 5:44:54 PM
G - Posted a solid gain today and rebounded above its 50 DMA line ($208.34) helping its outlook improve. Prior highs in the $199 area define important near-term support to watch. More damaging losses may trigger a worrisome technical sell signal. Recently noted repeatedly - "Sep '21 earnings rose +18% on +28% sales revenues versus the year ago period, below the +25% minimum earnings guideline (C criteria), raising fundamental concerns.
>>> FEATURED STOCK ARTICLE : Medpace Hovering at High With Volume Totals Cooling - 11/17/2021 |
View all notes |
Set NEW NOTE alert |
Company Profile |
SEC
News |
Chart |
Request a new note
C
A
S
I |
JEF
-
NYSE
Jefferies Financial Grp
Finance-Invest Bnk/Bkrs
|
$37.44
|
-0.79
-2.07% |
$37.99
|
4,726,384
318.92% of 50 DAV
50 DAV is 1,482,000
|
$44.47
-15.81%
|
6/28/2021
|
$31.81
|
PP = $34.42
|
|
MB = $36.14
|
Most Recent Note - 12/16/2021 5:38:09 PM
G - Still sputtering and in need of a rebound above the 50 DMA line ($40.85) for its outlook to improve. Reported Aug '21 quarterly earnings +40% on +20% sales revenues versus the year ago period.
>>> FEATURED STOCK ARTICLE : Volume Totals Cooling While Lingering Below 50-Day Moving Average - 12/9/2021 |
View all notes |
Set NEW NOTE alert |
Company Profile |
SEC
News |
Chart |
Request a new note
C
A
S
I |
Symbol/Exchange
Company Name
Industry Group |
PRICE |
CHANGE
(%Change) |
Day High |
Volume
(% DAV)
(% 50 day avg vol) |
52 Wk Hi
% From Hi |
Featured
Date |
Price
Featured |
Pivot Featured |
|
Max Buy |
AVTR
-
NYSE
Avantor Inc
Medical-Research Eqp/Svc
|
$39.90
|
+0.38
0.96% |
$40.45
|
7,443,419
197.18% of 50 DAV
50 DAV is 3,775,000
|
$44.37
-10.07%
|
6/10/2021
|
$32.94
|
PP = $34.09
|
|
MB = $35.79
|
Most Recent Note - 12/15/2021 5:46:34 PM
G - Posted a solid volume-driven gain today rebounding above its 50 DMA line ($39) helping its technical stance improve. Faces overhead supply up to the $44 level. Prior lows in the high $36 area define important near-term support. Reported Sep '21 quarterly earnings +46% above the year ago period. Completed a Secondary Offering on 9/13/21.
>>> FEATURED STOCK ARTICLE : Faces Resistance While Sputtering Below 50 DMA Line - 11/12/2021 |
View all notes |
Set NEW NOTE alert |
Company Profile |
SEC
News |
Chart |
Request a new note
C
A
S
I |
MIME
-
NASDAQ
Mimecast Limited
Computer Sftwr-Security
|
$78.96
|
-0.05
-0.06% |
$79.10
|
5,528,820
444.44% of 50 DAV
50 DAV is 1,244,000
|
$85.48
-7.63%
|
10/18/2021
|
$68.17
|
PP = $71.55
|
|
MB = $75.13
|
Most Recent Note - 12/17/2021 1:02:49 PM
G - Holding its ground after a gap up on 12/07/21 M&A news. Found prompt support at its 50 DMA line ($75.45). More damaging losses would raise concerns and trigger technical sell signals.
>>> FEATURED STOCK ARTICLE : Extended From Latest Base While Fundamentals Remain Strong - 11/26/2021 |
View all notes |
Set NEW NOTE alert |
Company Profile |
SEC
News |
Chart |
Request a new note
C
A
S
I |
|
|
|
THESE ARE NOT BUY RECOMMENDATIONS!
Comments contained in the body of this report are technical
opinions only. The material herein has been obtained
from sources believed to be reliable and accurate, however,
its accuracy and completeness cannot be guaranteed.
This site is not an investment advisor, hence it does
not endorse or recommend any securities or other investments.
Any recommendation contained in this report may not
be suitable for all investors and it is not to be deemed
an offer or solicitation on our part with respect to
the purchase or sale of any securities. All trademarks,
service marks and trade names appearing in this report
are the property of their respective owners, and are
likewise used for identification purposes only.
This report is a service available
only to active Paid Premium Members.
You may opt-out of receiving report notifications
at any time. Questions or comments may be submitted
by writing to Premium Membership Services 665 S.E. 10 Street, Suite 201 Deerfield Beach, FL 33441-5634 or by calling 1-800-965-8307
or 954-785-1121.
|
|
|