You are not logged in.
This means you
CAN ONLY VIEW reports that were published prior to Monday, March 31, 2025.
You
MUST UPGRADE YOUR MEMBERSHIP if you want to see any current reports.
AFTER MARKET UPDATE - WEDNESDAY, DECEMBER 1ST, 2021
Previous After Market Report Next After Market Report >>>
|
|
|
|
DOW |
-461.68 |
34,022.04 |
-1.34% |
|
Volume |
1,144,133,990 |
-45% |
|
Volume |
6,248,725,300 |
-5% |
|
NASDAQ |
-283.64 |
15,254.05 |
-1.83% |
|
Advancers |
899 |
28% |
|
Advancers |
1,105 |
24% |
|
S&P 500 |
-53.96 |
4,513.04 |
-1.18% |
|
Decliners |
2,332 |
72% |
|
Decliners |
3,426 |
76% |
|
Russell 2000 |
-51.49 |
2,147.42 |
-2.34% |
|
52 Wk Highs |
35 |
|
|
52 Wk Highs |
63 |
|
|
S&P 600 |
-20.53 |
1,322.62 |
-1.53% |
|
52 Wk Lows |
237 |
|
|
52 Wk Lows |
571 |
|
|
Concerns rose as damaging losses on volume, coupled with waning leadership, showed the major indices' uptrend coming under pressure (M criteria). A healthy crop of leaders is necessary for any rally to be maintained. Without improvement in the market internals in the near term the chances grow even greater for a more severe market correction.
|
 |
Major Indices Suffered Another Damaging Loss
Kenneth J. Gruneisen - Passed the CAN SLIM® Master's Exam
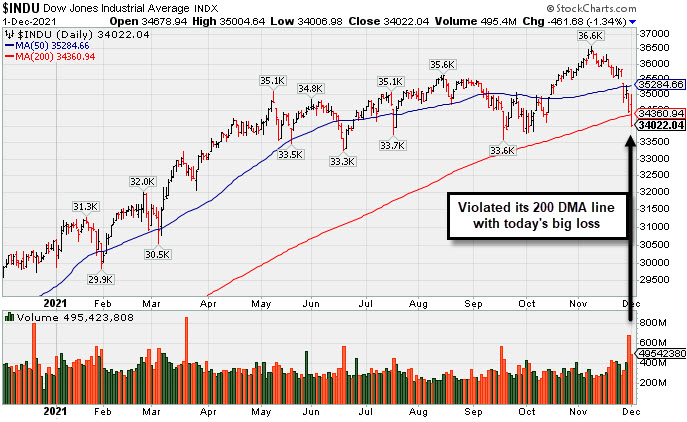
The S&P 500 fell 1.2%, weathering its biggest two-day decline since October 2020 (-3.1%). The Dow erased a 520-point gain to end 461 points lower, while the Nasdaq Composite slumped 1.8%. The Russell 2000 lost 1.8%, closing in correction territory (defined as a 10% drop from its recent record high). Behind the losses Wednesday's volume totals were reported lower than the prior session on the NYSE and on the Nasdaq exchange. Breadth was clearly negative as decliners led advancers by more than a 2-1 margin on the NYSE and by 3-1 on the Nasdaq exchange. There were 16 high-ranked companies from the Leaders List that hit new 52-week highs and were listed on the BreakOuts Page versus 10 on the prior session. New 52-week lows totals solidly outnumbered new 52-week highs totals on the NYSE and on the Nasdaq exchange. The major indices' uptrend is under pressure (M criteria). Investors are reminded to sell stocks that weaken on a case-by-case basis as dictated by the rules of the fact-based investment system.
PICTURED: The Dow Jones Industrial Average violated its 200-day moving average (DMA) with yet another damaging volume-driven loss.
U.S. stocks finished lower on Wednesday, wiping out an early session rally as investors monitored mixed pandemic headlines. The major averages climbed in morning trading as investors emerged to “buy the dip” following yesterday’s sell-off. Sentiment was lifted by the World Health Organization (WHO) saying that COVID-19 vaccines would likely offer protection against severe infections from the latest Omicron strain. Still, uncertainty prevailed, with U.S. equities turning lower on news the first domestic Omicron coronavirus case was confirmed in California. Bloomberg data showed trading volume was approximately 45% above the last month’s average.
Adding to market volatility have been perceived hawkish remarks from Federal Reserve (Fed) Chair Jerome Powell. Yesterday, the Fed chief indicated that the tapering process might be expedited in response to persistent price pressures. In a second congressional testimony today, the Fed chief reiterated that the risks of elevated inflation had “clearly risen.”
On the data front, a report from ADP showed private payrolls increased by a better-than-forecasted 534,000 in November. Separately, the Institute for Supply Management (ISM) revealed U.S. manufacturing sector growth accelerated last month, though a comparable reading from research firm Markit was downwardly revised to an 11-month low. Treasuries finished higher, with the yield on the 10-year note slipping three basis points (0.03%) to 1.41%. |
 Kenneth J. Gruneisen started out as a licensed stockbroker in August 1987, a couple of months prior to the historic stock market crash that took the Dow Jones Industrial Average down -22.6% in a single day. He has published daily fact-based fundamental and technical analysis on high-ranked stocks online for two decades. Through FACTBASEDINVESTING.COM, Kenneth provides educational articles, news, market commentary, and other information regarding proven investment systems that work in good times and bad.
Comments contained in the body of this report are technical opinions only and are not necessarily those of Gruneisen Growth Corp. The material herein has been obtained from sources believed to be reliable and accurate, however, its accuracy and completeness cannot be guaranteed. Our firm, employees, and customers may effect transactions, including transactions contrary to any recommendation herein, or have positions in the securities mentioned herein or options with respect thereto. Any recommendation contained in this report may not be suitable for all investors and it is not to be deemed an offer or solicitation on our part with respect to the purchase or sale of any securities. |
|
 |
Retail, Tech, Financial, and Commodity-Linked Groups Fell
Kenneth J. Gruneisen - Passed the CAN SLIM® Master's Exam
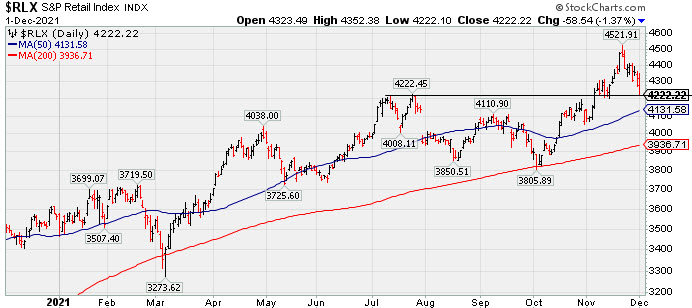
The Retail Index ($RLX -1.37%), Bank Index ($BKX -1.25%), and Broker/Dealer Index ($XBD -0.61%) each lost ground and weighed on the major averages. The Biotech Index ($BTK -1.51%) and Networking Index ($NWX -1.29%) led the tech sector lower while the Semiconductor Index ($SOX -0.59%) suffered a smaller loss. Commodity-linked groups suffered big losses as the Gold & Silver Index ($XAU -3.27%) and Oil Services Index ($OSX -2.61%) both outpaced the Integrated Oil Index ($XOI -0.74%) to the downside.
PICTURED: The Retail Index ($RLX -1.37%) is well above its 50-day and 200-day moving average (DMA) lines but slumping near its July high.
| Oil Services |
$OSX |
49.14 |
-1.32 |
-2.61% |
+10.86% |
| Integrated Oil |
$XOI |
1,116.17 |
-8.27 |
-0.74% |
+40.85% |
| Semiconductor |
$SOX |
3,810.75 |
-22.47 |
-0.59% |
+36.32% |
| Networking |
$NWX |
850.44 |
-11.10 |
-1.29% |
+18.59% |
| Broker/Dealer |
$XBD |
463.21 |
-2.82 |
-0.61% |
+22.67% |
| Retail |
$RLX |
4,222.22 |
-58.54 |
-1.37% |
+18.49% |
| Gold & Silver |
$XAU |
125.96 |
-4.26 |
-3.27% |
-12.64% |
| Bank |
$BKX |
129.33 |
-1.63 |
-1.25% |
+32.09% |
| Biotech |
$BTK |
5,258.34 |
-80.71 |
-1.51% |
-8.38% |
|
|
|
 |
AMD Pulling Back After Considerable Rally
Kenneth J. Gruneisen - Passed the CAN SLIM® Master's Exam
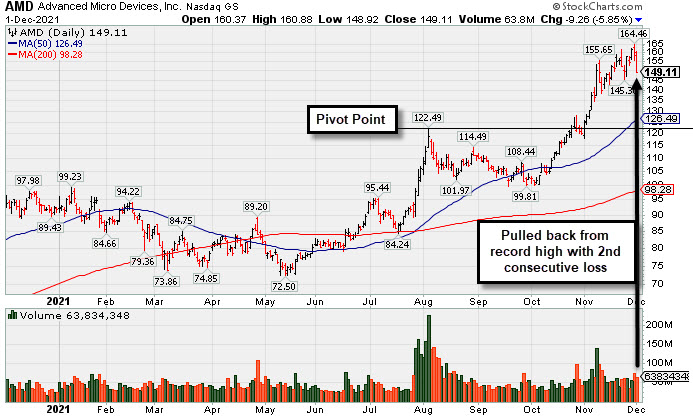
Advanced Micro Devices (AMD -$9.26 or -5.85% to $149.11) suffered a 2nd big volume-driven loss today, abruptly retreating from record high territory. It is very extended from the previously noted base. Its 50-day moving average (DMA) line ($126.49) and prior high in the $122 area define important support to watch. Its current Relative Strength rating of 97 is above the 80+ minimum guideline for buy candidates.
Fundamentals remain strong after it reported Sep '21 quarterly earnings +78% on +54% sales revenues versus the year ago period, extending its impressive streak of quarterly comparisons with very strong earnings increases well above the +25% minimum guideline (C criteria) with strong underlying sales revenues growth. Annual earnings growth (A criteria) has been very strong after losses in FY '15 and '16. it has a 99 Earnings Per Share Rating.
AMD was highlighted in yellow with pivot point cited based on its 8/04/21 high plus 10 cents in the 10/27/21 mid-day report (read here) and shown in this FSU section that evening with an annotated graph under the headline, "Encountered Distributional Pressure After Reaching New High". AMD traded up +196.8% since highlighted in yellow in the 6/09/20 mid-day report (read here).
AMD hails from the Electronics - Semiconductor Fabless industry which has a Group Relative Strength Rating of 99 (L criteria). It has a large supply of 1.21 billion shares outstanding (S criteria), which makes it less likely to be a quick sprinter. However, the number of top-rated funds owning its shares rose from 1,669 in Jun '19 to 2,772 in Sep '21, a reassuring sign concerning the I criteria. Its current Up/Down Volume Ratio of 1.4 is an unbiased indication its shares have been under accumulation over the past 50 days. It has a Timeliness Rating of A, a Sponsorship Rating of B, and an Accumulation/Distribution rating of B. |
|
|
Color Codes Explained :
Y - Better candidates highlighted by our
staff of experts.
G - Previously featured
in past reports as yellow but may no longer be buyable under the
guidelines.
***Last / Change / Volume data in this table is the closing quote data***
Symbol/Exchange
Company Name
Industry Group |
PRICE |
CHANGE
(%Change) |
Day High |
Volume
(% DAV)
(% 50 day avg vol) |
52 Wk Hi
% From Hi |
Featured
Date |
Price
Featured |
Pivot Featured |
|
Max Buy |
 SIVB
-
NASDAQ
SIVB
-
NASDAQ
S V B Financial Group
BANKING - Regional - Pacific Banks
|
$675.59
|
-16.74
-2.42% |
$723.35
|
455,055
136.24% of 50 DAV
50 DAV is 334,000
|
$763.22
-11.48%
|
8/6/2021
|
$589.70
|
PP = $608.94
|
|
MB = $639.39
|
Most Recent Note - 11/30/2021 5:42:49 PM
G - Violated its 50 DMA line ($703) with today's more damaging loss on higher volume raising concerns and triggering a technical sell signal. Only a prompt rebound above the 50 DMA line would help its outlook improve. Recently reported Sep '21 quarterly earnings -14% on +43% sales revenues versus the year ago period, below the +25% minimum earnings guideline (C criteria), raising fundamental concerns. Completed a new Public Offering on 8/11/21.
>>> FEATURED STOCK ARTICLE : Latest Quarter Raised Fundamental Concerns - 10/29/2021 |
View all notes |
Set NEW NOTE alert |
Company Profile |
SEC
News |
Chart |
Request a new note
C
A
S
I |
BLDR
-
NYSE
Builders Firstsource Inc
Bldg-Constr Prds/Misc
|
$70.22
|
+0.78
1.12% |
$73.03
|
2,536,006
127.18% of 50 DAV
50 DAV is 1,994,000
|
$74.15
-5.30%
|
8/12/2021
|
$52.38
|
PP = $54.09
|
|
MB = $56.79
|
Most Recent Note - 11/30/2021 5:44:16 PM
G - Very extended from any sound base, pulling back today with higher volume after wedging into new all-time high territory. Reported Sep '21 quarterly earnings +308% on +140% sales revenues versus the year ago period. Its 50 DMA line ($60.80) and prior highs in the $55 area define important near-term support to watch on pullbacks.
>>> FEATURED STOCK ARTICLE : Earnings News Due Thursday for High-Ranked Building Products Firm - 11/2/2021 |
View all notes |
Set NEW NOTE alert |
Company Profile |
SEC
News |
Chart |
Request a new note
C
A
S
I |
DSGX
-
NASDAQ
Descartes Systems Group
COMPUTER SOFTWARE and SERVICES - Business Software and Services
|
$78.38
|
-1.98
-2.46% |
$83.81
|
121,190
139.30% of 50 DAV
50 DAV is 87,000
|
$91.39
-14.24%
|
11/18/2021
|
$90.77
|
PP = $87.56
|
|
MB = $91.94
|
Most Recent Note - 11/30/2021 5:46:37 PM
G - Due to report Oct '21 quarterly results tomorrow. Color code is changed to green after violating its 50 DMA line ($83.46) with today's big loss with higher volume. There was a "negative reversal" noted on 11/18/21 as it finished near the session low with a loss on above average volume after highlighted in yellow in the mid-day report with pivot point cited based on its 9/23/21 high plus 10 cents. Members were reminded - "While recently wedging from a 6-week base, gains above a stock's pivot point must be backed by at least +40% above average volume to clinch a proper technical buy signal."
>>> FEATURED STOCK ARTICLE : Reversed After Wedging to New Highs - 11/18/2021 |
View all notes |
Set NEW NOTE alert |
Company Profile |
SEC
News |
Chart |
Request a new note
C
A
S
I |
KFRC
-
NASDAQ
Kforce Inc
Comml Svcs-Staffing
|
$73.32
|
-3.31
-4.32% |
$78.64
|
137,180
127.02% of 50 DAV
50 DAV is 108,000
|
$81.47
-10.00%
|
9/10/2021
|
$59.53
|
PP = $64.48
|
|
MB = $67.70
|
Most Recent Note - 11/29/2021 12:59:55 PM
G - Still hovering near its all-time high. Its prior high and 50 DMA line ($68.66) define important near-term support to watch on pullbacks. Recently reported Sep '21 quarterly earnings +8% on +10% sales revenues versus the year ago period, below the +25% minimum earnings guideline (C criteria), raising fundamental concerns.
>>> FEATURED STOCK ARTICLE : Extended From Base and Latest Quarter Earnings Growth Sub Par - 11/19/2021 |
View all notes |
Set NEW NOTE alert |
Company Profile |
SEC
News |
Chart |
Request a new note
C
A
S
I |
GNRC
-
NYSE
Generac Hldgs Inc
Electrical-Power/Equipmt
|
$403.57
|
-17.67
-4.19% |
$427.22
|
790,855
117.69% of 50 DAV
50 DAV is 672,000
|
$524.31
-23.03%
|
8/30/2021
|
$449.36
|
PP = $457.10
|
|
MB = $479.96
|
 Most Recent Note - 12/1/2021 4:40:19 PM
Slumped further below its 50 DMA line ($441) with today's 4th consecutive loss and it will be dropped from the Featured Stocks list tonight. Weak action came after it recently reported Sep '21 quarterly earnings +13% on +34% sales revenues versus the year ago period, below the +25% minimum earnings guideline (C criteria), raising fundamental concerns.
>>> FEATURED STOCK ARTICLE : Halted Slide at 50-Day Moving Average After Earnings News - 11/8/2021 |
View all notes |
Set NEW NOTE alert |
Company Profile |
SEC
News |
Chart |
Request a new note
C
A
S
I |
Symbol/Exchange
Company Name
Industry Group |
PRICE |
CHANGE
(%Change) |
Day High |
Volume
(% DAV)
(% 50 day avg vol) |
52 Wk Hi
% From Hi |
Featured
Date |
Price
Featured |
Pivot Featured |
|
Max Buy |
CAMT
-
NASDAQ
Camtek Ltd
ELECTRONICS - Scientific and Technical Instrum
|
$45.82
|
-0.30
-0.65% |
$48.48
|
365,540
149.81% of 50 DAV
50 DAV is 244,000
|
$49.60
-7.62%
|
11/9/2021
|
$45.43
|
PP = $46.11
|
|
MB = $48.42
|
Most Recent Note - 11/29/2021 5:02:51 PM
Y - Posted a solid gain today with higher volume, finding prompt support near the prior high. Weak action came after recently proposing a new $140 Million note offering. Fundamentals remain strong.
>>> FEATURED STOCK ARTICLE : Rebound Above 50-Day Moving Average Helped Outlook - 11/5/2021 |
View all notes |
Set NEW NOTE alert |
Company Profile |
SEC
News |
Chart |
Request a new note
C
A
S
I |
AMD
-
NASDAQ
Advanced Micro Devices
ELECTRONICS - Semiconductor - Broad Line
|
$149.11
|
-9.26
-5.85% |
$160.88
|
63,922,224
119.75% of 50 DAV
50 DAV is 53,379,000
|
$164.46
-9.33%
|
10/27/2021
|
$124.91
|
PP = $122.59
|
|
MB = $128.72
|
Most Recent Note - 12/1/2021 5:16:48 PM
G - Pulled back today for a 2nd big volume-driven loss, retreating from record high territory. Very extended from the previously noted base. Its 50 DMA line ($126.49) and prior high in the $122 area define important support to watch on pullbacks. Fundamentals remain strong after it reported Sep '21 quarterly earnings +78% on +54% sales revenues versus the year ago period. See the latest FSU analysis for more details and a new annotated graph.
>>> FEATURED STOCK ARTICLE : AMD Pulling Back After Considerable Rally - 12/1/2021 |
View all notes |
Set NEW NOTE alert |
Company Profile |
SEC
News |
Chart |
Request a new note
C
A
S
I |
UMC
-
NYSE
United Microelectrnc Adr
ELECTRONICS - Semiconductor - Integrated Cir
|
$12.23
|
+0.60
5.16% |
$12.68
|
18,622,476
245.61% of 50 DAV
50 DAV is 7,582,000
|
$12.62
-3.09%
|
12/1/2021
|
$12.60
|
PP = $12.72
|
|
MB = $13.36
|
Most Recent Note - 12/1/2021 12:58:01 PM
Y - Color code is changed to yellow with new pivot point cited based on its 9/03/21 high plus 10 cents. Hitting a new all-time high while posting a 3rd consecutive gain today with ever increasing volume after consolidating above its 50 DMA line ($11.03). A gain and solid close above the pivot point may clinch a new (or add-on) technical buy signal. Reported Sep '21 quarterly earnings +100% on +30% sales revenues versus the year ago period. Recently found support above its 200 DMA line ($10.08).
>>> FEATURED STOCK ARTICLE : Rebound Above 50-Day Moving Average Showed Resilience - 11/30/2021 |
View all notes |
Set NEW NOTE alert |
Company Profile |
SEC
News |
Chart |
Request a new note
C
A
S
I |
BRKS
-
NASDAQ
Brooks Automation
ELECTRONICS - Semiconductor Equipment and Mate
|
$113.10
|
+0.00
0.00% |
$118.13
|
422,500
74.07% of 50 DAV
50 DAV is 570,400
|
$124.79
-9.37%
|
9/20/2021
|
$101.21
|
PP = $108.82
|
|
MB = $114.26
|
Most Recent Note - 12/1/2021 9:49:05 AM
Y - Azenta Inc. (AZTA), formerly Brooks Automation Inc., is now trading under a new ticker. The previous ticker was "BRKS." The company had said on Nov. 16 that it was changing its name to Azenta, following the launch of the Azenta Life Sciences brand, and after announcing in September that it was selling its semiconductor automation business to Thomas H. Lee Partners. Consolidating above the prior high ($110) and its 50 DMA line which define important near-term support to watch where violations may trigger technical sell signals. Reported Sep 21 quarterly earnings +33% on +27% sales revenues versus the year ago period.
>>> FEATURED STOCK ARTICLE : Consolidating Still Well Above Prior High and 50 DMA Line - 11/24/2021 |
View all notes |
Set NEW NOTE alert |
Company Profile |
SEC
News |
Chart |
Request a new note
C
A
S
I |
ENTG
-
NASDAQ
Entegris Inc
ELECTRONICS - Semiconductor Equipment and Mate
|
$148.66
|
+2.58
1.77% |
$153.96
|
1,310,301
128.08% of 50 DAV
50 DAV is 1,023,000
|
$158.00
-5.91%
|
8/4/2021
|
$125.33
|
PP = $126.51
|
|
MB = $132.84
|
Most Recent Note - 11/30/2021 5:38:31 PM
G - Suffered a big volume-driven loss today. Very extended from any sound base, its 50 DMA line ($137) and prior high ($136) define important near-term support to watch. Fundamentals remain strong after it recently reported Sep '21 quarterly earnings +37% on +20% sales revenues versus the year ago period. See the latest FSU analysis for more details and an annotated graph.
>>> FEATURED STOCK ARTICLE : Best Ever Close After Volume-Driven Gain - 11/29/2021 |
View all notes |
Set NEW NOTE alert |
Company Profile |
SEC
News |
Chart |
Request a new note
C
A
S
I |
Symbol/Exchange
Company Name
Industry Group |
PRICE |
CHANGE
(%Change) |
Day High |
Volume
(% DAV)
(% 50 day avg vol) |
52 Wk Hi
% From Hi |
Featured
Date |
Price
Featured |
Pivot Featured |
|
Max Buy |
SKY
-
NYSE
Skyline Champion Corp
Bldg-Mobile/Mfg andamp; RV
|
$76.81
|
-1.44
-1.84% |
$80.36
|
487,562
129.67% of 50 DAV
50 DAV is 376,000
|
$82.73
-7.16%
|
11/3/2021
|
$72.19
|
PP = $66.92
|
|
MB = $70.27
|
Most Recent Note - 11/30/2021 5:33:36 PM
G - Very extended from the previously noted flat base, it pulled back today with higher volume. Its 50 DMA line ($68) and prior highs in the $66 area define important near-term support to watch. Reported very strong Mar, Jun and Sep '21 quarterly results versus the year ago periods well above the +25% minimum earnings guideline (C criteria). Annual earnings (A criteria) history has been strong.
>>> FEATURED STOCK ARTICLE : Breakaway Gap After 10-Week Flat Base - 11/3/2021 |
View all notes |
Set NEW NOTE alert |
Company Profile |
SEC
News |
Chart |
Request a new note
C
A
S
I |
WSM
-
NYSE
Williams Sonoma Inc
RETAIL - Home Furnishing Stores
|
$186.69
|
-8.15
-4.18% |
$197.33
|
1,418,876
161.60% of 50 DAV
50 DAV is 878,000
|
$223.32
-16.40%
|
11/3/2021
|
$205.00
|
PP = $195.09
|
|
MB = $204.84
|
Most Recent Note - 11/30/2021 5:40:16 PM
Y - Color code is changed to yellow after slumping below its "max buy" level with a big loss today. Near-term support to watch is its 50 DMA line ($192.40). Fundamental remain strong after it reported Oct '21 quarterly earnings +30% on +16% sales revenues versus the year ago period.
>>> FEATURED STOCK ARTICLE : Volume-Driven Gains May Signal a New Meaningful Leg Up - 11/4/2021 |
View all notes |
Set NEW NOTE alert |
Company Profile |
SEC
News |
Chart |
Request a new note
C
A
S
I |
TITN
-
NASDAQ
Titan Machinery Inc
SPECIALTY RETAIL
|
$31.39
|
-1.85
-5.57% |
$35.00
|
293,997
189.68% of 50 DAV
50 DAV is 155,000
|
$38.58
-18.64%
|
11/23/2021
|
$36.22
|
PP = $35.34
|
|
MB = $37.11
|
Most Recent Note - 12/1/2021 4:49:49 PM
G - Color code is changed to green after slumping further below the prior high with today's 5th consecutive loss marked by above average volume. Reported Oct '21 quarterly earnings +81% on +26% sales revenues over the year ago period, its 4th strong quarterly comparison.
>>> FEATURED STOCK ARTICLE : Strong Close With Gain Backed by +467% Above Average Volume - 11/23/2021 |
View all notes |
Set NEW NOTE alert |
Company Profile |
SEC
News |
Chart |
Request a new note
C
A
S
I |
CLFD
-
NASDAQ
Clearfield Inc
TELECOMMUNICATIONS - Cables / Satalite Equipment
|
$63.08
|
-1.66
-2.56% |
$68.39
|
179,298
146.97% of 50 DAV
50 DAV is 122,000
|
$72.00
-12.39%
|
7/23/2021
|
$40.23
|
PP = $43.74
|
|
MB = $45.93
|
Most Recent Note - 11/29/2021 4:59:19 PM
G - Still hovering near its all-time high, very extended from the previously noted base. Its 50 DMA line ($55.68) defines near-term support to watch on pullbacks. Reported Sep '21 quarterly earnings +141% on +66% sales revenues above the year ago period.
>>> FEATURED STOCK ARTICLE : Perched Near High Extended From Any Sound Base - 11/22/2021 |
View all notes |
Set NEW NOTE alert |
Company Profile |
SEC
News |
Chart |
Request a new note
C
A
S
I |
ENPH
-
NASDAQ
Enphase Energy Inc
Energy-Solar
|
$236.86
|
-13.14
-5.26% |
$255.09
|
2,049,026
87.60% of 50 DAV
50 DAV is 2,339,000
|
$282.46
-16.14%
|
10/28/2021
|
$218.00
|
PP = $229.14
|
|
MB = $240.60
|
Most Recent Note - 12/1/2021 4:52:01 PM
Y - Color code is changed to yellow after pulling back below its "max buy" level with today's big loss on lighter volume. Prior high ($229) defines initial support to watch above its 50 DMA line ($204).
>>> FEATURED STOCK ARTICLE : Enphase is Challenging its All-Time High With Volume-Driven Gains - 10/28/2021 |
View all notes |
Set NEW NOTE alert |
Company Profile |
SEC
News |
Chart |
Request a new note
C
A
S
I |
Symbol/Exchange
Company Name
Industry Group |
PRICE |
CHANGE
(%Change) |
Day High |
Volume
(% DAV)
(% 50 day avg vol) |
52 Wk Hi
% From Hi |
Featured
Date |
Price
Featured |
Pivot Featured |
|
Max Buy |
SMPL
-
NASDAQ
Simply Good Foods Co
Food-Confectionery
|
$35.74
|
-1.23
-3.33% |
$37.87
|
447,354
124.61% of 50 DAV
50 DAV is 359,000
|
$41.35
-13.57%
|
10/25/2021
|
$38.30
|
PP = $38.60
|
|
MB = $40.53
|
Most Recent Note - 12/1/2021 4:44:41 PM
G - Color code is changed to green after today's 4th consecutive loss, slumping below prior highs in the $38 area and violating its 50 DMA line ($37.43) triggering technical sell signals. Only a prompt rebound above the 50 DMA line would help its outlook improve.
>>> FEATURED STOCK ARTICLE : Consolidating Above Prior High Following Recent Technical Breakout - 11/15/2021 |
View all notes |
Set NEW NOTE alert |
Company Profile |
SEC
News |
Chart |
Request a new note
C
A
S
I |
WDAY
-
NYSE
Workday Inc Cl A
Computer Sftwr-Enterprse
|
$260.86
|
-13.37
-4.88% |
$276.92
|
2,561,065
161.66% of 50 DAV
50 DAV is 1,584,200
|
$307.81
-15.25%
|
9/7/2021
|
$275.69
|
PP = $282.87
|
|
MB = $297.01
|
Most Recent Note - 11/29/2021 5:13:06 PM
Y - Color code is changed to yellow after finding prompt support near prior highs in the $278-282 area and its 50 DMA line following recent damaging losses that triggered a technical sell signal. Reported Oct '21 quarterly earnings +28% on +20% sales revenues versus the year ago period. Fundamentals remain strong.
>>> FEATURED STOCK ARTICLE : Getting Extended From Previously Noted Base - 11/16/2021 |
View all notes |
Set NEW NOTE alert |
Company Profile |
SEC
News |
Chart |
Request a new note
C
A
S
I |
CTLT
-
NYSE
Catalent Inc
DRUGS - Biotechnology
|
$127.31
|
-1.35
-1.05% |
$131.42
|
1,232,366
138.94% of 50 DAV
50 DAV is 887,000
|
$142.64
-10.75%
|
8/25/2021
|
$128.72
|
PP = $127.78
|
|
MB = $134.17
|
Most Recent Note - 11/30/2021 12:00:41 PM
G - After some encouraging gains today's loss has it pulling back below its 50 DMA line ($131) which recently acted as resistance. Its prior low ($119) and 200 DMA line ($117.73) define important near-term support to watch. More damaging losses would raise greater concerns. Its Relative Strength Rating is 84, above the 80+ minimum guideline for buy candidates. Fundamentals remain strong after it reported Sep '21 quarterly earnings +65% on +21% sales revenues versus the year ago period, continuing its strong earnings track record.
>>> FEATURED STOCK ARTICLE : Recent Violation of 50-Day Moving Average Triggered Sell Signal - 11/11/2021 |
View all notes |
Set NEW NOTE alert |
Company Profile |
SEC
News |
Chart |
Request a new note
C
A
S
I |
TTD
-
NASDAQ
The Trade Desk Inc Cl A
Comml Svcs-Advertising
|
$95.22
|
-8.20
-7.93% |
$105.85
|
5,190,962
100.33% of 50 DAV
50 DAV is 5,174,000
|
$114.09
-16.54%
|
11/9/2021
|
$95.16
|
PP = $90.00
|
|
MB = $94.50
|
Most Recent Note - 12/1/2021 4:47:00 PM
G - There was another big loss today after a "negative reversal" on the prior session. It is still extended from the prior high ($90). Its 50 DMA line ($83.37) defines additional support to watch.
>>> FEATURED STOCK ARTICLE : Powerful Volume-Driven Gains for New Highs - 11/9/2021 |
View all notes |
Set NEW NOTE alert |
Company Profile |
SEC
News |
Chart |
Request a new note
C
A
S
I |
MEDP
-
NASDAQ
Medpace Holdings Inc
Medical-Research Eqp/Svc
|
$209.07
|
+1.66
0.80% |
$214.67
|
247,097
153.48% of 50 DAV
50 DAV is 161,000
|
$231.00
-9.49%
|
9/10/2021
|
$196.32
|
PP = $196.22
|
|
MB = $206.03
|
Most Recent Note - 11/30/2021 5:31:35 PM
G - Pulled back near its "max buy" level while testing its 50 DMA line ($204.67) with today's 3rd consecutive loss. More damaging losses may trigger a technical sell signal. As recently noted, Sep '21 earnings rose +18% on +28% sales revenues versus the year ago period, below the +25% minimum earnings guideline (C criteria), raising fundamental concerns. Below its 50 DMA line the prior highs in the $199 area define important near-term support to watch.
>>> FEATURED STOCK ARTICLE : Medpace Hovering at High With Volume Totals Cooling - 11/17/2021 |
View all notes |
Set NEW NOTE alert |
Company Profile |
SEC
News |
Chart |
Request a new note
C
A
S
I |
Symbol/Exchange
Company Name
Industry Group |
PRICE |
CHANGE
(%Change) |
Day High |
Volume
(% DAV)
(% 50 day avg vol) |
52 Wk Hi
% From Hi |
Featured
Date |
Price
Featured |
Pivot Featured |
|
Max Buy |
JEF
-
NYSE
Jefferies Financial Grp
Finance-Invest Bnk/Bkrs
|
$37.53
|
-0.05
-0.13% |
$39.09
|
1,774,279
102.98% of 50 DAV
50 DAV is 1,723,000
|
$44.47
-15.61%
|
6/28/2021
|
$31.81
|
PP = $34.42
|
|
MB = $36.14
|
Most Recent Note - 11/29/2021 5:17:50 PM
G - Today's weak close and loss with higher (near average) volume raised greater concerns. Only a rebound above the 50 DMA line ($40.59) would help its outlook improve. Reported Aug '21 quarterly earnings +40% on +20% sales revenues versus the year ago period.
>>> FEATURED STOCK ARTICLE : Extended From Prior Highs and Stubbornly Holding Ground - 11/1/2021 |
View all notes |
Set NEW NOTE alert |
Company Profile |
SEC
News |
Chart |
Request a new note
C
A
S
I |
AVTR
-
NYSE
Avantor Inc
Medical-Research Eqp/Svc
|
$38.29
|
-1.19
-3.01% |
$39.92
|
3,663,904
92.27% of 50 DAV
50 DAV is 3,971,000
|
$44.37
-13.70%
|
6/10/2021
|
$32.94
|
PP = $34.09
|
|
MB = $35.79
|
Most Recent Note - 12/1/2021 4:42:05 PM
G - Suffered a 2nd loss with average volume and ended near the session low today, slumping well below its 50 DMA line ($39.52). A rebound above the 50 DMA line is needed for its outlook to improve, and it faces overhead supply up to the $44 level. Reported Sep '21 quarterly earnings +46% above the year ago period. Completed a Secondary Offering on 9/13/21.
>>> FEATURED STOCK ARTICLE : Faces Resistance While Sputtering Below 50 DMA Line - 11/12/2021 |
View all notes |
Set NEW NOTE alert |
Company Profile |
SEC
News |
Chart |
Request a new note
C
A
S
I |
MIME
-
NASDAQ
Mimecast Limited
Computer Sftwr-Security
|
$76.34
|
-4.66
-5.75% |
$82.93
|
962,489
174.05% of 50 DAV
50 DAV is 553,000
|
$85.48
-10.69%
|
10/18/2021
|
$68.17
|
PP = $71.55
|
|
MB = $75.13
|
Most Recent Note - 12/1/2021 4:53:59 PM
G - Pulled back with higher volume today but it remains extended from prior highs and above its "max buy" level. Its 50 DMA line ($72.49) and prior highs in the $71 area define important near-term support to watch.
>>> FEATURED STOCK ARTICLE : Extended From Latest Base While Fundamentals Remain Strong - 11/26/2021 |
View all notes |
Set NEW NOTE alert |
Company Profile |
SEC
News |
Chart |
Request a new note
C
A
S
I |
AZTA
-
NYSE
"Azenta, Inc"
ELECTRONICS - Semiconductor Equipment
|
$113.10
|
+0.00
0.00% |
$118.13
|
422,500
74.07% of 50 DAV
50 DAV is 570,400
|
$124.79
-9.37%
|
9/20/2021
|
$101.21
|
PP = $108.82
|
|
MB = $114.26
|
Most Recent Note - 12/1/2021
Y - Azenta Inc. (AZTA), formerly Brooks Automation Inc., is now trading under a new ticker. The previous ticker was "BRKS." The company had said on Nov. 16 that it was changing its name to Azenta, following the launch of the Azenta Life Sciences brand, and after announcing in September that it was selling its semiconductor automation business to Thomas H. Lee Partners. Consolidating above the prior high ($110) and its 50 DMA line which define important near-term support to watch where violations may trigger technical sell signals. Reported Sep 21 quarterly earnings +33% on +27% sales revenues versus the year ago period.
There are no Featured Stock Updates™ available for this stock at this time. You may request one by clicking the Request a New Note link below |
View all notes |
Set NEW NOTE alert |
Company Profile |
SEC
News |
Chart |
Request a new note
C
A
S
I |
|
|
|
THESE ARE NOT BUY RECOMMENDATIONS!
Comments contained in the body of this report are technical
opinions only. The material herein has been obtained
from sources believed to be reliable and accurate, however,
its accuracy and completeness cannot be guaranteed.
This site is not an investment advisor, hence it does
not endorse or recommend any securities or other investments.
Any recommendation contained in this report may not
be suitable for all investors and it is not to be deemed
an offer or solicitation on our part with respect to
the purchase or sale of any securities. All trademarks,
service marks and trade names appearing in this report
are the property of their respective owners, and are
likewise used for identification purposes only.
This report is a service available
only to active Paid Premium Members.
You may opt-out of receiving report notifications
at any time. Questions or comments may be submitted
by writing to Premium Membership Services 665 S.E. 10 Street, Suite 201 Deerfield Beach, FL 33441-5634 or by calling 1-800-965-8307
or 954-785-1121.
|
|
|