***Last / Change / Volume data in this table is the closing quote data***
Symbol/Exchange
Company Name
Industry Group |
PRICE |
CHANGE
(%Change) |
Day High |
Volume
(% DAV)
(% 50 day avg vol) |
52 Wk Hi
% From Hi |
Featured
Date |
Price
Featured |
Pivot Featured |
|
Max Buy |
 SIVB
-
NASDAQ
SIVB
-
NASDAQ
S V B Financial Group
BANKING - Regional - Pacific Banks
|
$737.31
|
-3.89
-0.52% |
$745.18
|
421,258
123.17% of 50 DAV
50 DAV is 342,000
|
$763.22
-3.39%
|
8/6/2021
|
$589.70
|
PP = $608.94
|
|
MB = $639.39
|
Most Recent Note - 11/18/2021 2:57:24 PM
G - Volume totals have been cooling while hovering near its all-time high, extended from the previously noted base. Recently reported Sep '21 quarterly earnings -14% on +43% sales revenues versus the year ago period, below the +25% minimum earnings guideline (C criteria), raising fundamental concerns. Its 50 DMA line ($685) defines important near-term support to watch on pullbacks. Completed a new Public Offering on 8/11/21.
>>> FEATURED STOCK ARTICLE : Latest Quarter Raised Fundamental Concerns - 10/29/2021 |
View all notes |
Set NEW NOTE alert |
Company Profile |
SEC
News |
Chart |
Request a new note
C
A
S
I |
BLDR
-
NYSE
Builders Firstsource Inc
Bldg-Constr Prds/Misc
|
$73.35
|
+1.55
2.16% |
$73.37
|
2,185,627
110.66% of 50 DAV
50 DAV is 1,975,000
|
$73.36
-0.01%
|
8/12/2021
|
$52.38
|
PP = $54.09
|
|
MB = $56.79
|
Most Recent Note - 11/18/2021 11:57:52 AM
G - Hitting yet another new all-time high today after stubbornly holding its ground, and it is very extended from any sound base. Bullish action came after it reported Sep '21 quarterly earnings +308% on +140% sales revenues versus the year ago period. Its 50 DMA line ($58.15) and prior highs in the $55 area define important near-term support to watch on pullbacks.
>>> FEATURED STOCK ARTICLE : Earnings News Due Thursday for High-Ranked Building Products Firm - 11/2/2021 |
View all notes |
Set NEW NOTE alert |
Company Profile |
SEC
News |
Chart |
Request a new note
C
A
S
I |
DSGX
-
NASDAQ
Descartes Systems Group
COMPUTER SOFTWARE and SERVICES - Business Software and Services
|
$84.26
|
-2.49
-2.87% |
$86.58
|
114,170
129.74% of 50 DAV
50 DAV is 88,000
|
$91.39
-7.80%
|
11/18/2021
|
$90.77
|
PP = $87.56
|
|
MB = $91.94
|
Most Recent Note - 11/22/2021 12:40:31 PM
Y - Fundamentals remain strong but pulling back today with higher volume. There was a "negative reversal" noted on 11/18/21 as it finished near the session low with a loss on above average volume after highlighted in yellow in the mid-day report with pivot point cited based on its 9/23/21 high plus 10 cents. Members were reminded - "While recently wedging from a 6-week base, gains above a stock's pivot point must be backed by at least +40% above average volume to clinch a proper technical buy signal."
>>> FEATURED STOCK ARTICLE : Reversed After Wedging to New Highs - 11/18/2021 |
View all notes |
Set NEW NOTE alert |
Company Profile |
SEC
News |
Chart |
Request a new note
C
A
S
I |
KFRC
-
NASDAQ
Kforce Inc
Comml Svcs-Staffing
|
$80.75
|
+0.92
1.15% |
$81.47
|
132,384
122.58% of 50 DAV
50 DAV is 108,000
|
$80.55
0.25%
|
9/10/2021
|
$59.53
|
PP = $64.48
|
|
MB = $67.70
|
Most Recent Note - 11/19/2021 5:30:41 PM
G - Extended from any sound base and stubbornly holding its ground near its all-time high. Its prior high and 50 DMA line ($66.38) define important near-term support to watch on pullbacks. Recently reported Sep '21 quarterly earnings +8% on +10% sales revenues versus the year ago period, below the +25% minimum earnings guideline (C criteria), raising fundamental concerns. See the latest FSU analysis for more details and a new annotated graph.
>>> FEATURED STOCK ARTICLE : Extended From Base and Latest Quarter Earnings Growth Sub Par - 11/19/2021 |
View all notes |
Set NEW NOTE alert |
Company Profile |
SEC
News |
Chart |
Request a new note
C
A
S
I |
GNRC
-
NYSE
Generac Hldgs Inc
Electrical-Power/Equipmt
|
$432.83
|
-7.16
-1.63% |
$447.27
|
585,547
88.72% of 50 DAV
50 DAV is 660,000
|
$524.31
-17.45%
|
8/30/2021
|
$449.36
|
PP = $457.10
|
|
MB = $479.96
|
Most Recent Note - 11/19/2021 5:34:02 PM
G - Posted a big gain with +14% above average volume, rebounding near its 50 DMA line ($442) which may act as resistance. Weak action came after it recently reported Sep '21 quarterly earnings +13% on +34% sales revenues versus the year ago period, below the +25% minimum earnings guideline (C criteria), raising fundamental concerns.
>>> FEATURED STOCK ARTICLE : Halted Slide at 50-Day Moving Average After Earnings News - 11/8/2021 |
View all notes |
Set NEW NOTE alert |
Company Profile |
SEC
News |
Chart |
Request a new note
C
A
S
I |
Symbol/Exchange
Company Name
Industry Group |
PRICE |
CHANGE
(%Change) |
Day High |
Volume
(% DAV)
(% 50 day avg vol) |
52 Wk Hi
% From Hi |
Featured
Date |
Price
Featured |
Pivot Featured |
|
Max Buy |
CAMT
-
NASDAQ
Camtek Ltd
ELECTRONICS - Scientific and Technical Instrum
|
$44.48
|
-1.57
-3.41% |
$46.70
|
406,538
178.31% of 50 DAV
50 DAV is 228,000
|
$49.60
-10.32%
|
11/9/2021
|
$45.43
|
PP = $46.11
|
|
MB = $48.42
|
 Most Recent Note - 11/23/2021 5:40:07 PM
Y - Suffered a 3rd volume-driven loss in the span of 4 sessions, still slumping below the prior high and back into the prior base. Weak action came after proposing a new $140 Million note offering. Fundamentals remain strong.
>>> FEATURED STOCK ARTICLE : Rebound Above 50-Day Moving Average Helped Outlook - 11/5/2021 |
View all notes |
Set NEW NOTE alert |
Company Profile |
SEC
News |
Chart |
Request a new note
C
A
S
I |
AMD
-
NASDAQ
Advanced Micro Devices
ELECTRONICS - Semiconductor - Broad Line
|
$149.92
|
-2.60
-1.70% |
$152.66
|
62,647,509
121.31% of 50 DAV
50 DAV is 51,641,000
|
$161.88
-7.39%
|
10/27/2021
|
$124.91
|
PP = $122.59
|
|
MB = $128.72
|
Most Recent Note - 11/18/2021 11:52:56 AM
G - Hitting another new all-time high with today's gain, very extended from the previously noted base. Disciplined investors avoid chasing extended stocks. Prior high in the $122 area and its 50 DMA line define support to watch on pullbacks. Fundamentals remain strong after it reported Sep '21 quarterly earnings +78% on +54% sales revenues versus the year ago period.
>>> FEATURED STOCK ARTICLE : Encountered Distributional Pressure After Reaching New High - 10/27/2021 |
View all notes |
Set NEW NOTE alert |
Company Profile |
SEC
News |
Chart |
Request a new note
C
A
S
I |
UMC
-
NYSE
United Microelectrnc Adr
ELECTRONICS - Semiconductor - Integrated Cir
|
$11.32
|
-0.27
-2.33% |
$11.42
|
8,010,959
107.50% of 50 DAV
50 DAV is 7,452,000
|
$12.62
-10.30%
|
8/5/2021
|
$11.62
|
PP = $11.38
|
|
MB = $11.95
|
Most Recent Note - 11/23/2021 5:36:30 PM
G - Gapped down today pulling back near its 50 DMA line ($11.03) with volume totals near average. Reported Sep '21 quarterly earnings +100% on +30% sales revenues versus the year ago period. Recently found support above its 200 DMA line ($10.05).
>>> FEATURED STOCK ARTICLE : Earnings News Due From Taiwan-Based Semiconductor Firm - 10/26/2021 |
View all notes |
Set NEW NOTE alert |
Company Profile |
SEC
News |
Chart |
Request a new note
C
A
S
I |
BRKS
-
NASDAQ
Brooks Automation
ELECTRONICS - Semiconductor Equipment and Mate
|
$116.08
|
-0.50
-0.43% |
$116.63
|
747,755
119.95% of 50 DAV
50 DAV is 623,400
|
$124.79
-6.98%
|
9/20/2021
|
$101.21
|
PP = $108.82
|
|
MB = $114.26
|
Most Recent Note - 11/22/2021 5:21:02 PM
G - Reversed an early gain for a loss today with higher (near average) volume. Color code was changed to green after rallying back above its "max buy" level. Prior high ($110) and its 50 DMA line ($108) define near-term support to watch on pullbacks. Reported Sep 21 quarterly earnings +33% on +27% sales revenues versus the year ago period.
>>> FEATURED STOCK ARTICLE : 5th Quiet Gain Has Brooks Perched Near Prior Highs - 10/20/2021 |
View all notes |
Set NEW NOTE alert |
Company Profile |
SEC
News |
Chart |
Request a new note
C
A
S
I |
ENTG
-
NASDAQ
Entegris Inc
ELECTRONICS - Semiconductor Equipment and Mate
|
$150.09
|
-1.43
-0.94% |
$153.73
|
1,297,608
147.46% of 50 DAV
50 DAV is 880,000
|
$158.00
-5.01%
|
8/4/2021
|
$125.33
|
PP = $126.51
|
|
MB = $132.84
|
Most Recent Note - 11/22/2021 5:05:34 PM
G - There was a "negative reversal" today after hitting yet another new all-time high. Very extended from any sound base, its prior high ($136) and its 50 DMA line ($135.41) define near-term support to watch. Fundamentals remain strong after it recently reported Sep '21 quarterly earnings +37% on +20% sales revenues versus the year ago period.
>>> FEATURED STOCK ARTICLE : Hit New Record High With Another Volume-Driven Gain - 10/22/2021 |
View all notes |
Set NEW NOTE alert |
Company Profile |
SEC
News |
Chart |
Request a new note
C
A
S
I |
Symbol/Exchange
Company Name
Industry Group |
PRICE |
CHANGE
(%Change) |
Day High |
Volume
(% DAV)
(% 50 day avg vol) |
52 Wk Hi
% From Hi |
Featured
Date |
Price
Featured |
Pivot Featured |
|
Max Buy |
SKY
-
NYSE
Skyline Champion Corp
Bldg-Mobile/Mfg andamp; RV
|
$80.55
|
-0.23
-0.28% |
$81.90
|
492,231
122.14% of 50 DAV
50 DAV is 403,000
|
$82.73
-2.64%
|
11/3/2021
|
$72.19
|
PP = $66.92
|
|
MB = $70.27
|
Most Recent Note - 11/23/2021 5:32:01 PM
G - Paused today perched at its all-time high after 5 consecutive volume-driven gains, very extended from the previously noted flat base. Prior highs in the $66 area define support to watch coinciding with its 50 DMA line. Reported very strong Mar, Jun and Sep '21 quarterly results versus the year ago periods well above the +25% minimum earnings guideline (C criteria). Annual earnings (A criteria) history has been strong.
>>> FEATURED STOCK ARTICLE : Breakaway Gap After 10-Week Flat Base - 11/3/2021 |
View all notes |
Set NEW NOTE alert |
Company Profile |
SEC
News |
Chart |
Request a new note
C
A
S
I |
WSM
-
NYSE
Williams Sonoma Inc
RETAIL - Home Furnishing Stores
|
$211.50
|
-5.92
-2.72% |
$215.84
|
1,318,439
145.68% of 50 DAV
50 DAV is 905,000
|
$223.32
-5.29%
|
11/3/2021
|
$205.00
|
PP = $195.09
|
|
MB = $204.84
|
Most Recent Note - 11/23/2021 12:53:29 PM
G - Reported Oct '21 quarterly earnings +30% on +16% sales revenues versus the year ago period. Volume and volatility often increase near earnings news. Pulling back from its all-time high. Prior highs define near-term support to watch above its 50 DMA line ($190).
>>> FEATURED STOCK ARTICLE : Volume-Driven Gains May Signal a New Meaningful Leg Up - 11/4/2021 |
View all notes |
Set NEW NOTE alert |
Company Profile |
SEC
News |
Chart |
Request a new note
C
A
S
I |
TITN
-
NASDAQ
Titan Machinery Inc
SPECIALTY RETAIL
|
$38.29
|
+3.03
8.59% |
$38.58
|
759,456
571.02% of 50 DAV
50 DAV is 133,000
|
$37.10
3.21%
|
11/23/2021
|
$36.22
|
PP = $35.34
|
|
MB = $37.11
|
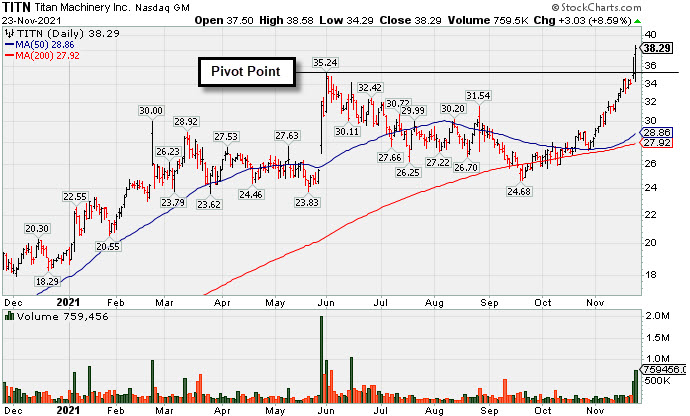
Most Recent Note - 11/23/2021 5:27:30 PM
Y - Finished strong today after highlighted in yellow with pivot point cited base on its 6/01/21 high plus 10 cents in the earlier mid-day report. Reported Oct '21 quarterly earnings +81% over the year ago period, its 4th strong quarterly comparison. Volume and volatility often increase near earnings news. Hit a new 52-week high with today's 2nd consecutive big volume-driven gain clinching a technical buy signal. Following years of losses it has shown strong earnings growth for FY '19-21. See the latest FSU analysis for more details and a new annotated graph.
>>> FEATURED STOCK ARTICLE : Strong Close With Gain Backed by +467% Above Average Volume - 11/23/2021 |
View all notes |
Set NEW NOTE alert |
Company Profile |
SEC
News |
Chart |
Request a new note
C
A
S
I |
CLFD
-
NASDAQ
Clearfield Inc
TELECOMMUNICATIONS - Cables / Satalite Equipment
|
$66.44
|
-0.50
-0.75% |
$67.23
|
82,237
71.51% of 50 DAV
50 DAV is 115,000
|
$72.00
-7.72%
|
7/23/2021
|
$40.23
|
PP = $43.74
|
|
MB = $45.93
|
Most Recent Note - 11/22/2021 1:34:37 PM
G - Perched near its all-time high, very extended from the previously noted base. Its 50 DMA line ($54) defines near-term support to watch on pullbacks. Reported Sep '21 quarterly earnings +141% on +66% sales revenues above the year ago period.
>>> FEATURED STOCK ARTICLE : Perched Near High Extended From Any Sound Base - 11/22/2021 |
View all notes |
Set NEW NOTE alert |
Company Profile |
SEC
News |
Chart |
Request a new note
C
A
S
I |
TGH
-
NYSE
Textainer Group Holdings
TRANSPORTATION - Logistics
|
$34.60
|
-0.39
-1.11% |
$35.68
|
458,784
92.50% of 50 DAV
50 DAV is 496,000
|
$41.24
-16.10%
|
10/7/2021
|
$36.97
|
PP = $36.80
|
|
MB = $38.64
|
Most Recent Note - 11/19/2021 1:03:13 PM
G - Color code is changed to green with today's loss undercutting its 50 DMA line ($36.50) raising concerns and triggering a technical sell signal. Only a prompt rebound above the 50 DMA line would help its outlook to improve. Fundamentals remain strong.
>>> FEATURED STOCK ARTICLE : Pulling Back Below "Max Buy" Level With Lighter Volume - 11/10/2021 |
View all notes |
Set NEW NOTE alert |
Company Profile |
SEC
News |
Chart |
Request a new note
C
A
S
I |
Symbol/Exchange
Company Name
Industry Group |
PRICE |
CHANGE
(%Change) |
Day High |
Volume
(% DAV)
(% 50 day avg vol) |
52 Wk Hi
% From Hi |
Featured
Date |
Price
Featured |
Pivot Featured |
|
Max Buy |
ENPH
-
NASDAQ
Enphase Energy Inc
Energy-Solar
|
$250.50
|
-10.62
-4.07% |
$265.26
|
2,576,380
108.48% of 50 DAV
50 DAV is 2,375,000
|
$282.46
-11.31%
|
10/28/2021
|
$218.00
|
PP = $229.14
|
|
MB = $240.60
|
Most Recent Note - 11/23/2021 5:38:11 PM
G - Fell today following a "negative reversal" on the prior session after it powered to a new all-time high. It is extended from the previously noted base. Prior high ($229) defines initial support to watch on pullbacks.
>>> FEATURED STOCK ARTICLE : Enphase is Challenging its All-Time High With Volume-Driven Gains - 10/28/2021 |
View all notes |
Set NEW NOTE alert |
Company Profile |
SEC
News |
Chart |
Request a new note
C
A
S
I |
SMPL
-
NASDAQ
Simply Good Foods Co
Food-Confectionery
|
$39.45
|
+0.36
0.92% |
$39.62
|
256,839
69.23% of 50 DAV
50 DAV is 371,000
|
$41.35
-4.59%
|
10/25/2021
|
$38.30
|
PP = $38.60
|
|
MB = $40.53
|
Most Recent Note - 11/22/2021 5:03:37 PM
Y - Holding its ground and still quietly consolidating above prior highs and below its "max buy" level. Prior highs in the $38 area define initial support to watch above its 50 DMA line ($37.05).
>>> FEATURED STOCK ARTICLE : Consolidating Above Prior High Following Recent Technical Breakout - 11/15/2021 |
View all notes |
Set NEW NOTE alert |
Company Profile |
SEC
News |
Chart |
Request a new note
C
A
S
I |
WDAY
-
NYSE
Workday Inc Cl A
Computer Sftwr-Enterprse
|
$274.28
|
-0.47
-0.17% |
$280.79
|
2,254,234
145.01% of 50 DAV
50 DAV is 1,554,500
|
$307.81
-10.89%
|
9/7/2021
|
$275.69
|
PP = $282.87
|
|
MB = $297.01
|
Most Recent Note - 11/23/2021 12:52:22 PM
G - Slump below prior highs in the $278-282 area and its 50 DMA line violation are raising concerns and triggering a technical sell signal. Only a prompt rebound would help its outlook improve. Color code is changed to green after slumping below its 50 DMA line ($275) with today's 4th consecutive volume-driven loss off its record high. Reported Oct '21 quarterly earnings +28% on +20% sales revenues versus the year ago period. Fundamentals remain strong.
>>> FEATURED STOCK ARTICLE : Getting Extended From Previously Noted Base - 11/16/2021 |
View all notes |
Set NEW NOTE alert |
Company Profile |
SEC
News |
Chart |
Request a new note
C
A
S
I |
CTLT
-
NYSE
"Catalent, Inc"
DRUGS - Biotechnology
|
$127.88
|
-0.77
-0.60% |
$128.77
|
684,537
75.70% of 50 DAV
50 DAV is 904,300
|
$142.64
-10.35%
|
8/25/2021
|
$128.72
|
PP = $127.78
|
|
MB = $134.17
|
Most Recent Note - 11/17/2021 12:25:00 PM
G - The 50 DMA line ($132.63) may act as resistance while it is on track today for a 5th consecutive gain. Its Relative Strength Rating is 73, still below the 80+ minimum guideline for buy candidates. Halted its slide above its 200 DMA line ($117.40). More damaging losses would raise greater concerns. Fundamentals remain strong after it reported Sep '21 quarterly earnings +65% on +21% sales revenues versus the year ago period, continuing its strong earnings track record.
>>> FEATURED STOCK ARTICLE : Recent Violation of 50-Day Moving Average Triggered Sell Signal - 11/11/2021 |
View all notes |
Set NEW NOTE alert |
Company Profile |
SEC
News |
Chart |
Request a new note
C
A
S
I |
TTD
-
NASDAQ
The Trade Desk Inc Cl A
Comml Svcs-Advertising
|
$102.74
|
-0.53
-0.51% |
$105.69
|
5,997,980
119.08% of 50 DAV
50 DAV is 5,037,000
|
$114.09
-9.95%
|
11/9/2021
|
$95.16
|
PP = $90.00
|
|
MB = $94.50
|
Most Recent Note - 11/22/2021 1:31:34 PM
G - Abruptly pulling back with today's 3rd loss in 4 sessions after a spurt of volume-driven gains left it very extended from the previously noted 9-month cup-with-handle shaped base. Prior highs define initial support to watch.
>>> FEATURED STOCK ARTICLE : Powerful Volume-Driven Gains for New Highs - 11/9/2021 |
View all notes |
Set NEW NOTE alert |
Company Profile |
SEC
News |
Chart |
Request a new note
C
A
S
I |
Symbol/Exchange
Company Name
Industry Group |
PRICE |
CHANGE
(%Change) |
Day High |
Volume
(% DAV)
(% 50 day avg vol) |
52 Wk Hi
% From Hi |
Featured
Date |
Price
Featured |
Pivot Featured |
|
Max Buy |
MEDP
-
NASDAQ
Medpace Holdings Inc
Medical-Research Eqp/Svc
|
$212.62
|
-7.97
-3.61% |
$220.92
|
206,165
123.45% of 50 DAV
50 DAV is 167,000
|
$231.00
-7.96%
|
9/10/2021
|
$196.32
|
PP = $196.22
|
|
MB = $206.03
|
Most Recent Note - 11/23/2021 5:34:44 PM
G - Suffered a 2nd consecutive big loss today while abruptly retreating from its 52-week high. As recently noted, Sep '21 earnings rose +18% on +28% sales revenues versus the year ago period, below the +25% minimum earnings guideline (C criteria), raising fundamental concerns. Its 50 DMA line ($202) and prior highs in the $199 area define important near-term support to watch.
>>> FEATURED STOCK ARTICLE : Medpace Hovering at High With Volume Totals Cooling - 11/17/2021 |
View all notes |
Set NEW NOTE alert |
Company Profile |
SEC
News |
Chart |
Request a new note
C
A
S
I |
JEF
-
NYSE
Jefferies Financial Grp
Finance-Invest Bnk/Bkrs
|
$40.42
|
+0.39
0.97% |
$40.53
|
831,483
45.84% of 50 DAV
50 DAV is 1,814,000
|
$44.47
-9.11%
|
6/28/2021
|
$31.81
|
PP = $34.42
|
|
MB = $36.14
|
Most Recent Note - 11/23/2021 5:29:33 PM
G - Found prompt support near its 50 DMA line ($40.44) after a streak of losses. More damaging losses would raise greater concerns. Reported Aug '21 quarterly earnings +40% on +20% sales revenues versus the year ago period.
>>> FEATURED STOCK ARTICLE : Extended From Prior Highs and Stubbornly Holding Ground - 11/1/2021 |
View all notes |
Set NEW NOTE alert |
Company Profile |
SEC
News |
Chart |
Request a new note
C
A
S
I |
AVTR
-
NYSE
Avantor Inc
Medical-Research Eqp/Svc
|
$39.11
|
-0.83
-2.08% |
$40.04
|
3,120,119
72.22% of 50 DAV
50 DAV is 4,320,000
|
$44.37
-11.85%
|
6/10/2021
|
$32.94
|
PP = $34.09
|
|
MB = $35.79
|
Most Recent Note - 11/18/2021 2:50:53 PM
G - Still sputtering and meeting resistance at its 50 DMA line ($40). A rebound above the 50 DMA line is needed for its outlook to improve, and it faces overhead supply up to the $44 level. Reported Sep '21 quarterly earnings +46% above the year ago period. Completed a Secondary Offering on 9/13/21.
>>> FEATURED STOCK ARTICLE : Faces Resistance While Sputtering Below 50 DMA Line - 11/12/2021 |
View all notes |
Set NEW NOTE alert |
Company Profile |
SEC
News |
Chart |
Request a new note
C
A
S
I |
MIME
-
NASDAQ
Mimecast Limited
Computer Sftwr-Security
|
$78.07
|
-0.28
-0.36% |
$79.73
|
641,495
111.56% of 50 DAV
50 DAV is 575,000
|
$85.48
-8.67%
|
10/18/2021
|
$68.17
|
PP = $71.55
|
|
MB = $75.13
|
Most Recent Note - 11/22/2021 1:33:09 PM
G - Abruptly retreating from its all-time high with today's 3rd consecutive loss. Very extended from the previously noted base. Prior highs in the $71 area define important near-term support along with its 50 DMA line ($71.08).
>>> FEATURED STOCK ARTICLE : MIME Consolidating Less Than 4% Off High Building New Base - 10/21/2021 |
View all notes |
Set NEW NOTE alert |
Company Profile |
SEC
News |
Chart |
Request a new note
C
A
S
I |
ZD
-
NASDAQ
Ziff Davis Inc
Internet-Content
|
$115.39
|
-1.20
-1.03% |
$116.50
|
502,858
117.99% of 50 DAV
50 DAV is 426,200
|
$135.00
-14.53%
|
10/25/2021
|
$126.07
|
PP = $128.19
|
|
MB = $134.60
|
Most Recent Note - 11/18/2021 2:42:53 PM
G - Color code is changed to green while slumping below its 50 DMA line ($122.91) with today's 5th consecutive loss raising concerns. Only a prompt rebound above the 50 DMA line would help its outlook improve. Quarterly and annual earnings (C and A criteria) history has been strong.
>>> FEATURED STOCK ARTICLE : Internet Content Firm Perched Near Prior High - 10/25/2021 |
View all notes |
Set NEW NOTE alert |
Company Profile |
SEC
News |
Chart |
Request a new note
C
A
S
I |
Symbol/Exchange
Company Name
Industry Group |
PRICE |
CHANGE
(%Change) |
Day High |
Volume
(% DAV)
(% 50 day avg vol) |
52 Wk Hi
% From Hi |
Featured
Date |
Price
Featured |
Pivot Featured |
|
Max Buy |