You are not logged in.
This means you
CAN ONLY VIEW reports that were published prior to Sunday, March 30, 2025.
You
MUST UPGRADE YOUR MEMBERSHIP if you want to see any current reports.
AFTER MARKET UPDATE - MONDAY, DECEMBER 13TH, 2021
Previous After Market Report Next After Market Report >>>
|
|
|
|
DOW |
-320.04 |
35,650.95 |
-0.89% |
|
Volume |
1,026,406,176 |
+24% |
|
Volume |
4,498,538,600 |
+3% |
|
NASDAQ |
-217.32 |
15,413.28 |
-1.39% |
|
Advancers |
1,009 |
31% |
|
Advancers |
1,308 |
29% |
|
S&P 500 |
-43.05 |
4,668.97 |
-0.91% |
|
Decliners |
2,293 |
69% |
|
Decliners |
3,223 |
71% |
|
Russell 2000 |
-31.31 |
2,180.50 |
-1.42% |
|
52 Wk Highs |
89 |
|
|
52 Wk Highs |
65 |
|
|
S&P 600 |
-23.62 |
1,353.99 |
-1.71% |
|
52 Wk Lows |
120 |
|
|
52 Wk Lows |
332 |
|
|
Concerns have grown as the major indices are now in a market correction (M criteria). Disciplined investors know to preserve capital by following sell rules designed to lock in gains and limit losses. New buying efforts should be avoided until a new confirmed rally is noted marked by a solid follow-through day.
|
 |
Major Averages Suffer Losses With Higher Volume Totals
Kenneth J. Gruneisen - Passed the CAN SLIM® Master's Exam
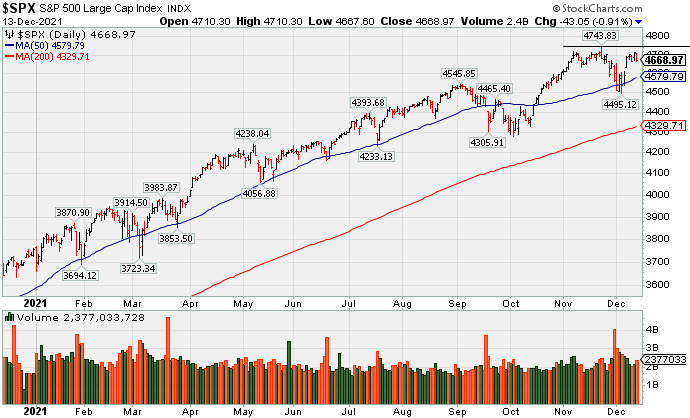
The S&P 500 fell 0.9% on the heels of its biggest weekly advance since February (+3.8%) that had propelled the broad benchmark to its first record in nearly a month. The Dow shed 320 points, while the tech-heavy Nasdaq Composite slid 1.4%. The volume totals reported were higher than the prior session on the NYSE and on the Nasdaq exchange. Breadth was negative as decliners led advancers by more than a 2-1 margin on the NYSE and on the Nasdaq exchange. There were 31 high-ranked companies from the Leaders List that hit new 52-week highs and were listed on the BreakOuts Page versus 24 on the prior session. New 52-week lows totals expanded and outnumbered new 52-week highs totals on the NYSE and on the Nasdaq exchange. Recent weakness signaled a more worrisome market correction (M criteria). A proper follow-through day requires a solid gain from at least one of the major averages backed by higher volume coupled with an increase in the number of stocks hitting new 52-week highs over the prior session. Until then, investors are reminded to avoid new buying efforts and raise cash levels by selling stocks that weaken on a case-by-case basis as dictated by the rules of the fact-based investment system.
PICTURED: The S&P 500 Index suffered a loss on Monday with higher volume.
U.S. stocks finished firmly lower on Monday as investors struck a cautious tone ahead of this week’s deluge of global central bank policy decisions. Treasuries rallied, with the yield on the 10-year note down seven basis points (0.07%) to 1.42%. Seven of 11 S&P 500 sectors closed in negative territory, with the more traditionally defensive groups bucking the downtrend.
Health Care was a notable advancer, with Pfizer (PFE +4.59%) and BioNTech (BNTX +7.97%) rising after an Israeli study showed their COVID-19 booster shot offered strong protection against severe infection from the Omicron variant. Separately, Pfizer said it would purchase Arena Pharmaceuticals (ARNA +80.38%) for roughly $6.7 billion. Meanwhile, Bristol Myers (BMY +4.77%) jumped on an announcement the company would boost its dividend and increase its share repurchase plan.
Energy led laggards in the S&P 500 as all stocks in the sector ended lower. The Consumer Dictionary group also underperformed as travel-related stocks continued to see a headwind on pandemic-related worries. In other corporate news, Apple (AAPL -2.07%) turned lower amid weakness in growth-related shares, but still remains within striking distance of reaching the $3 trillion market cap milestone.
This week, all eyes will be on the U.S. Federal Reserve’s (Fed’s) monetary policy decision Wednesday. The central bank is widely anticipated to announce plans to dial back its bond-buying program at a faster pace in light of persistent inflation. |
 Kenneth J. Gruneisen started out as a licensed stockbroker in August 1987, a couple of months prior to the historic stock market crash that took the Dow Jones Industrial Average down -22.6% in a single day. He has published daily fact-based fundamental and technical analysis on high-ranked stocks online for two decades. Through FACTBASEDINVESTING.COM, Kenneth provides educational articles, news, market commentary, and other information regarding proven investment systems that work in good times and bad.
Comments contained in the body of this report are technical opinions only and are not necessarily those of Gruneisen Growth Corp. The material herein has been obtained from sources believed to be reliable and accurate, however, its accuracy and completeness cannot be guaranteed. Our firm, employees, and customers may effect transactions, including transactions contrary to any recommendation herein, or have positions in the securities mentioned herein or options with respect thereto. Any recommendation contained in this report may not be suitable for all investors and it is not to be deemed an offer or solicitation on our part with respect to the purchase or sale of any securities. |
|
 |
Semiconductor, Energy, Financial, and Retail Indexes Led Decliners
Kenneth J. Gruneisen - Passed the CAN SLIM® Master's Exam
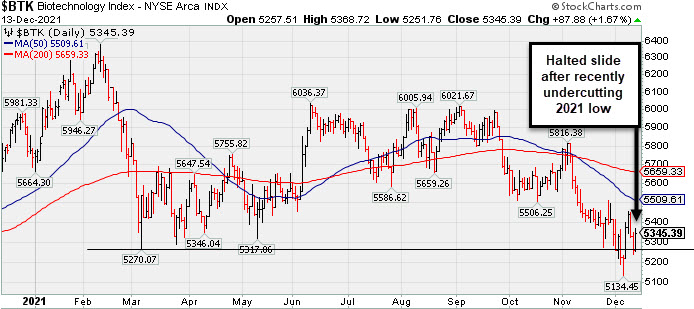
Weakness in the Bank Index ($BKX -2.29%), Broker/Dealer Index ($XBD -0.85%), and Retail Index ($RLX -1.71%) created a drag on the major averages. The Oil Services Index ($OSX -4.61%) and Integrated Oil Index ($XOI -2.62%) were standout decliners. The Gold & Silver Index ($XAU +0.08%) was unchanged. The tech sector was mixed as the Semiconductor Index ($SOX -2.56%) slumped and the Networking Index ($NWX -0.37%) edged lower, meanwhile the Biotech Index ($BTK +1.67%) posted a gain.
PICTURED: The Biotech Index ($BTK +1.67%) halted its slide after recently undercutting its 2021 low.
| Oil Services |
$OSX |
52.69 |
-2.55 |
-4.61% |
+18.85% |
| Integrated Oil |
$XOI |
1,153.31 |
-31.07 |
-2.62% |
+45.53% |
| Semiconductor |
$SOX |
3,814.43 |
-100.24 |
-2.56% |
+36.45% |
| Networking |
$NWX |
918.87 |
-3.44 |
-0.37% |
+28.13% |
| Broker/Dealer |
$XBD |
474.00 |
-4.05 |
-0.85% |
+25.53% |
| Retail |
$RLX |
4,228.79 |
-73.48 |
-1.71% |
+18.68% |
| Gold & Silver |
$XAU |
124.15 |
+0.11 |
+0.08% |
-13.90% |
| Bank |
$BKX |
130.26 |
-3.05 |
-2.29% |
+33.04% |
| Biotech |
$BTK |
5,345.39 |
+87.88 |
+1.67% |
-6.86% |
|
|
|
 |
Consolidating Near All-Time High With Little Resistance Remaining
Kenneth J. Gruneisen - Passed the CAN SLIM® Master's Exam
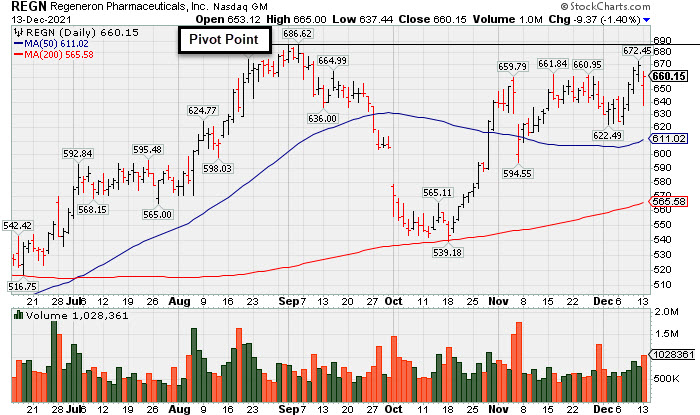
Regeneron Pharmaceutical (REGN -$9.37 or -1.40% to $660.15) was highlighted in yellow with new pivot point cited based on its 9/01/21 high plus 10 cents in the earlier mid-day report (read here). It showed resilience and finished near the session high for a small loss after gapping down and trading much lower. It still remains perched within close striking distance of its all-time high. Subsequent gains above the pivot point backed by at least +40% above average volume may trigger a technical buy signal. The market direction (M criteria) remains a concern regarding any new buying until a new confirmed rally with a follow-through day.
REGN was shown in this FSU section that evening with an annotated graph under the headline, "Regeneron Featured Hitting a New High". It found support above its 200 DMA line and then rebounded since dropped from the Featured Stocks list on 9/28/21. Its Relative Strength rating has improved to 89, well above the 80+ minimum guideline for buy candidates.
The high-ranked DRUGS - Biotechnology firm reported earnings +84% on +51% sales revenues for the Sep '21 quarter versus the year ago period. That marked its 5th quarterly comparison above the +25% minimum earnings guideline (C criteria) and with a strong sales revenues growth rate. Its annual earnings (A criteria) growth has been strong. It has a 99 Earnings Per Share Rating.
There are 2,665 top-rated funds that own its shares as of Sep '21, up from 2,376 in Dec '20, a reassuring sign concerning the I criteria. Its current Up/Down Volume Ratio of 1.0 is an unbiased indication its shares have been neutral concerning accumulation/distribution over the past 50 days. REGN completed a Secondary Offering on 5/28/20. There are 96.2 million shares in the public float (S criteria) which can contribute to greater volatility in the event of institutional buying or selling.
|
|
|
Color Codes Explained :
Y - Better candidates highlighted by our
staff of experts.
G - Previously featured
in past reports as yellow but may no longer be buyable under the
guidelines.
***Last / Change / Volume data in this table is the closing quote data***
Symbol/Exchange
Company Name
Industry Group |
PRICE |
CHANGE
(%Change) |
Day High |
Volume
(% DAV)
(% 50 day avg vol) |
52 Wk Hi
% From Hi |
Featured
Date |
Price
Featured |
Pivot Featured |
|
Max Buy |
 BLDR
-
NYSE
BLDR
-
NYSE
Builders Firstsource Inc
Bldg-Constr Prds/Misc
|
$77.44
|
-2.13
-2.68% |
$80.22
|
2,975,536
133.79% of 50 DAV
50 DAV is 2,224,000
|
$80.95
-4.34%
|
8/12/2021
|
$52.38
|
PP = $54.09
|
|
MB = $56.79
|
Most Recent Note - 12/10/2021 5:00:43 PM
G - Perched at its all-time high after today's 5th consecutive volume-driven gain, very extended from any sound base. Reported Sep '21 quarterly earnings +308% on +140% sales revenues versus the year ago period. It is well above its 50 DMA line ($64.17). See the latest FSU analysis for more details and a new annotated graph.
>>> FEATURED STOCK ARTICLE : Perched at Record High After +52% Rally in 4 Months - 12/10/2021 |
View all notes |
Set NEW NOTE alert |
Company Profile |
SEC
News |
Chart |
Request a new note
C
A
S
I |
KFRC
-
NASDAQ
Kforce Inc
Comml Svcs-Staffing
|
$71.95
|
-1.35
-1.84% |
$73.14
|
94,472
89.97% of 50 DAV
50 DAV is 105,000
|
$81.47
-11.69%
|
9/10/2021
|
$59.53
|
PP = $64.48
|
|
MB = $67.70
|
 Most Recent Note - 12/13/2021 5:16:11 PM
G - Consolidating above its 50 DMA line ($71.27) which defines important near-term support to watch. Recently reported Sep '21 quarterly earnings +8% on +10% sales revenues versus the year ago period, below the +25% minimum earnings guideline (C criteria), raising fundamental concerns.
>>> FEATURED STOCK ARTICLE : Extended From Base and Latest Quarter Earnings Growth Sub Par - 11/19/2021 |
View all notes |
Set NEW NOTE alert |
Company Profile |
SEC
News |
Chart |
Request a new note
C
A
S
I |
REGN
-
NASDAQ
Regeneron Pharmaceutical
DRUGS - Biotechnology
|
$660.15
|
-9.37
-1.40% |
$665.00
|
1,029,549
131.66% of 50 DAV
50 DAV is 782,000
|
$686.62
-3.86%
|
12/13/2021
|
$647.95
|
PP = $686.72
|
|
MB = $721.06
|
Most Recent Note - 12/13/2021 1:00:05 PM
Y - Color code is changed to yellow with new pivot point cited based on its 9/01/21 high plus 10 cents. Gapped down today yet it remains perched within striking distance of its all-time high. Subsequent gains above the pivot point backed by at least +40% above average volume may trigger a technical buy signal. Its Relative Strength rating has improved to 90, well above the 80+ minimum guideline for buy candidates. Found support at its 200 DMA line and rebounded since dropped from the Featured Stocks List on 10/01/21. The market direction (M criteria) remains a concern regarding any new buying until a new confirmed rally with a follow-through day."
>>> FEATURED STOCK ARTICLE : Regeneron Featured Hitting a New High - 8/20/2021 |
View all notes |
Set NEW NOTE alert |
Company Profile |
SEC
News |
Chart |
Request a new note
C
A
S
I |
CAMT
-
NASDAQ
Camtek Ltd
ELECTRONICS - Scientific and Technical Instrum
|
$42.76
|
-1.91
-4.28% |
$44.64
|
319,846
126.92% of 50 DAV
50 DAV is 252,000
|
$49.60
-13.79%
|
11/9/2021
|
$45.43
|
PP = $46.11
|
|
MB = $48.42
|
Most Recent Note - 12/13/2021 5:19:04 PM
Y - Volume was higher today with a big loss testing support near its 50 DMA line ($42.40). More damaging losses would raise greater concerns. Fundamentals remain strong.
>>> FEATURED STOCK ARTICLE : Rebound Above 50-Day Moving Average Helped Outlook - 11/5/2021 |
View all notes |
Set NEW NOTE alert |
Company Profile |
SEC
News |
Chart |
Request a new note
C
A
S
I |
AMD
-
NASDAQ
Advanced Micro Devices
ELECTRONICS - Semiconductor - Broad Line
|
$133.80
|
-4.75
-3.43% |
$139.40
|
41,858,322
76.21% of 50 DAV
50 DAV is 54,928,000
|
$164.46
-18.64%
|
10/27/2021
|
$124.91
|
PP = $122.59
|
|
MB = $128.72
|
Most Recent Note - 12/13/2021 5:21:43 PM
G - Suffered another big loss today with below average volume, testing its 50 DMA line ($132.54) which defines important support to watch. Fundamentals remain strong after it reported Sep '21 quarterly earnings +78% on +54% sales revenues versus the year ago period.
>>> FEATURED STOCK ARTICLE : AMD Pulling Back After Considerable Rally - 12/1/2021 |
View all notes |
Set NEW NOTE alert |
Company Profile |
SEC
News |
Chart |
Request a new note
C
A
S
I |
Symbol/Exchange
Company Name
Industry Group |
PRICE |
CHANGE
(%Change) |
Day High |
Volume
(% DAV)
(% 50 day avg vol) |
52 Wk Hi
% From Hi |
Featured
Date |
Price
Featured |
Pivot Featured |
|
Max Buy |
UMC
-
NYSE
United Microelectrnc Adr
ELECTRONICS - Semiconductor - Integrated Cir
|
$11.01
|
-0.32
-2.82% |
$11.30
|
5,423,536
65.44% of 50 DAV
50 DAV is 8,288,000
|
$12.68
-13.17%
|
12/1/2021
|
$12.60
|
PP = $12.72
|
|
MB = $13.36
|
Most Recent Note - 12/9/2021 6:15:26 PM
Y - Pulled back with lighter volume today for a 2nd consecutive loss. New pivot point cited was based on its 9/03/21 high plus 10 cents. Its 50 DMA line ($11.05) defines near-term support. A gain and solid close above the pivot point may clinch a new (or add-on) technical buy signal. Reported Sep '21 quarterly earnings +100% on +30% sales revenues versus the year ago period. Recently found support above its 200 DMA line ($10.14).
>>> FEATURED STOCK ARTICLE : Rebound Above 50-Day Moving Average Showed Resilience - 11/30/2021 |
View all notes |
Set NEW NOTE alert |
Company Profile |
SEC
News |
Chart |
Request a new note
C
A
S
I |
ENTG
-
NASDAQ
Entegris Inc
ELECTRONICS - Semiconductor Equipment and Mate
|
$142.28
|
-4.61
-3.14% |
$148.08
|
745,884
71.65% of 50 DAV
50 DAV is 1,041,000
|
$158.00
-9.95%
|
8/4/2021
|
$125.33
|
PP = $126.51
|
|
MB = $132.84
|
Most Recent Note - 12/9/2021 6:10:38 PM
G - Extended from any sound base, consolidating above its 50 DMA line ($140) which defines important near-term support to watch. Fundamentals remain strong after it recently reported Sep '21 quarterly earnings +37% on +20% sales revenues versus the year ago period.
>>> FEATURED STOCK ARTICLE : Best Ever Close After Volume-Driven Gain - 11/29/2021 |
View all notes |
Set NEW NOTE alert |
Company Profile |
SEC
News |
Chart |
Request a new note
C
A
S
I |
SKY
-
NYSE
Skyline Champion Corp
Bldg-Mobile/Mfg andamp; RV
|
$79.46
|
-2.84
-3.45% |
$83.49
|
494,607
120.64% of 50 DAV
50 DAV is 410,000
|
$85.92
-7.52%
|
11/3/2021
|
$72.19
|
PP = $66.92
|
|
MB = $70.27
|
Most Recent Note - 12/13/2021 5:20:01 PM
G - Suffered another volume-driven loss today, encountering distributional pressure. Its 50 DMA line ($71.39) and prior highs in the $66 area define important near-term support to watch. Reported very strong Mar, Jun and Sep '21 quarterly results versus the year ago periods well above the +25% minimum earnings guideline (C criteria). Annual earnings (A criteria) history has been strong.
>>> FEATURED STOCK ARTICLE : Breakaway Gap After 10-Week Flat Base - 11/3/2021 |
View all notes |
Set NEW NOTE alert |
Company Profile |
SEC
News |
Chart |
Request a new note
C
A
S
I |
DHI
-
NYSE
D R Horton Inc
MATERIALS and CONSTRUCTION - Residential Construction
|
$108.02
|
-1.63
-1.49% |
$110.45
|
3,626,022
145.74% of 50 DAV
50 DAV is 2,488,000
|
$109.76
-1.59%
|
12/6/2021
|
$104.40
|
PP = $106.99
|
|
MB = $112.34
|
Most Recent Note - 12/10/2021 5:02:59 PM
Y - Hit a new all-time high with today's gain backed by +31% above average volume. Highlighted in yellow with pivot point cited based on its 5/10/21 high plus 10 cents in the 12/06/21 mid-day report. Reported Sep '21 earnings +68% on +27% sales revenues versus the year-ago period, its 8th strong quarterly comparison above the +25% minimum guideline (C criteria). Annual earnings growth (A criteria) has been strong. The market direction (M criteria) remains a concern regarding any new buying until a new confirmed rally with a follow-through day.
>>> FEATURED STOCK ARTICLE : Builder Built a Solid Base And Challenged Prior High - 12/6/2021 |
View all notes |
Set NEW NOTE alert |
Company Profile |
SEC
News |
Chart |
Request a new note
C
A
S
I |
WSM
-
NYSE
Williams Sonoma Inc
RETAIL - Home Furnishing Stores
|
$169.64
|
-5.79
-3.30% |
$176.63
|
1,228,669
134.43% of 50 DAV
50 DAV is 914,000
|
$223.32
-24.04%
|
11/3/2021
|
$205.00
|
PP = $195.09
|
|
MB = $204.84
|
Most Recent Note - 12/13/2021 3:44:37 PM
Slumping below its 200 DMA line ($173) with today's loss adding to damaging volume-driven losses and it will be dropped from the Featured Stocks list tonight. A rebound above its 50 DMA line ($191) is needed for its outlook to improve. Fundamental remain strong after it reported Oct '21 quarterly earnings +30% on +16% sales revenues versus the year ago period.
>>> FEATURED STOCK ARTICLE : Volume-Driven Gains May Signal a New Meaningful Leg Up - 11/4/2021 |
View all notes |
Set NEW NOTE alert |
Company Profile |
SEC
News |
Chart |
Request a new note
C
A
S
I |
Symbol/Exchange
Company Name
Industry Group |
PRICE |
CHANGE
(%Change) |
Day High |
Volume
(% DAV)
(% 50 day avg vol) |
52 Wk Hi
% From Hi |
Featured
Date |
Price
Featured |
Pivot Featured |
|
Max Buy |
TITN
-
NASDAQ
Titan Machinery Inc
SPECIALTY RETAIL
|
$32.68
|
-1.16
-3.43% |
$33.92
|
169,432
106.56% of 50 DAV
50 DAV is 159,000
|
$38.58
-15.29%
|
11/23/2021
|
$36.22
|
PP = $35.34
|
|
MB = $37.11
|
Most Recent Note - 12/13/2021 5:23:25 PM
G - Suffered another loss today on higher (near average) volume, still slumping back into the prior base. Reported Oct '21 quarterly earnings +81% on +26% sales revenues over the year ago period, its 4th strong quarterly comparison.
>>> FEATURED STOCK ARTICLE : Strong Close With Gain Backed by +467% Above Average Volume - 11/23/2021 |
View all notes |
Set NEW NOTE alert |
Company Profile |
SEC
News |
Chart |
Request a new note
C
A
S
I |
CLFD
-
NASDAQ
Clearfield Inc
TELECOMMUNICATIONS - Cables / Satalite Equipment
|
$63.21
|
-1.95
-2.99% |
$65.28
|
83,623
66.37% of 50 DAV
50 DAV is 126,000
|
$72.00
-12.21%
|
7/23/2021
|
$40.23
|
PP = $43.74
|
|
MB = $45.93
|
Most Recent Note - 12/13/2021 3:48:00 PM
G - Volume totals have been cooling while consolidating above its 50 DMA line ($59.63) which defines near-term support to watch. Reported Sep '21 quarterly earnings +141% on +66% sales revenues above the year ago period.
>>> FEATURED STOCK ARTICLE : Perched Near High Extended From Any Sound Base - 11/22/2021 |
View all notes |
Set NEW NOTE alert |
Company Profile |
SEC
News |
Chart |
Request a new note
C
A
S
I |
ODFL
-
NASDAQ
Old Dominion Fght Line
TRANSPORTATION - Trucking
|
$358.92
|
+2.63
0.74% |
$361.42
|
884,377
152.22% of 50 DAV
50 DAV is 581,000
|
$373.58
-3.92%
|
12/7/2021
|
$365.61
|
PP = $364.17
|
|
MB = $382.38
|
Most Recent Note - 12/13/2021 5:17:35 PM
Y - Hovering in a tight range near its all-time high. Subsequent volume-driven gains are needed to clinch a buy signal, and the broader market direction (M criteria) remains a concern until a follow-through day. Reported earnings +44% on +32% sales revenues for the Sep '21 quarter, its 5th consecutive comparison above the +25% minimum guideline (C criteria).
>>> FEATURED STOCK ARTICLE : Perched at All Time High After Tight Consolidation Several Weeks - 12/7/2021 |
View all notes |
Set NEW NOTE alert |
Company Profile |
SEC
News |
Chart |
Request a new note
C
A
S
I |
ENPH
-
NASDAQ
Enphase Energy Inc
Energy-Solar
|
$213.52
|
-1.50
-0.70% |
$220.35
|
2,404,567
99.77% of 50 DAV
50 DAV is 2,410,000
|
$282.46
-24.41%
|
10/28/2021
|
$218.00
|
PP = $229.14
|
|
MB = $240.60
|
Most Recent Note - 12/9/2021 6:08:39 PM
G - Quietly consolidating above its 50 DMA line ($212). More damaging losses would raise serious concerns and trigger a technical sell signal. Undercut the prior high ($229) raising concerns while recently slumping back into the prior base.
>>> FEATURED STOCK ARTICLE : Pullback Testing Near Prior High - 12/2/2021 |
View all notes |
Set NEW NOTE alert |
Company Profile |
SEC
News |
Chart |
Request a new note
C
A
S
I |
SMPL
-
NASDAQ
Simply Good Foods Co
Food-Confectionery
|
$37.68
|
+0.32
0.86% |
$38.31
|
306,596
83.54% of 50 DAV
50 DAV is 367,000
|
$41.35
-8.88%
|
10/25/2021
|
$38.30
|
PP = $38.60
|
|
MB = $40.53
|
Most Recent Note - 12/9/2021 6:23:47 PM
G - Today's loss with higher (average) volume led to a close back below its 50 DMA line ($37.68) hurting its technical stance, and its color code is changed to green, The prior low and 200 DMA line ($35.25) define the next important support.
>>> FEATURED STOCK ARTICLE : Consolidating Above Prior High Following Recent Technical Breakout - 11/15/2021 |
View all notes |
Set NEW NOTE alert |
Company Profile |
SEC
News |
Chart |
Request a new note
C
A
S
I |
Symbol/Exchange
Company Name
Industry Group |
PRICE |
CHANGE
(%Change) |
Day High |
Volume
(% DAV)
(% 50 day avg vol) |
52 Wk Hi
% From Hi |
Featured
Date |
Price
Featured |
Pivot Featured |
|
Max Buy |
WDAY
-
NYSE
Workday Inc Cl A
Computer Sftwr-Enterprse
|
$280.92
|
+1.24
0.44% |
$283.67
|
1,095,508
68.36% of 50 DAV
50 DAV is 1,602,500
|
$307.81
-8.74%
|
9/7/2021
|
$275.69
|
PP = $282.87
|
|
MB = $297.01
|
Most Recent Note - 12/13/2021 3:46:12 PM
Y - Consolidating just above its 50 DMA line ($278.66) with volume totals cooling. Its Relative Strength Rating has improved to 83, above the 80+ minimum guideline for buy candidates. Reported Oct '21 quarterly earnings +28% on +20% sales revenues versus the year ago period. Fundamentals remain strong.
>>> FEATURED STOCK ARTICLE : Getting Extended From Previously Noted Base - 11/16/2021 |
View all notes |
Set NEW NOTE alert |
Company Profile |
SEC
News |
Chart |
Request a new note
C
A
S
I |
CTLT
-
NYSE
"Catalent, Inc"
DRUGS - Biotechnology
|
$124.88
|
+2.56
2.09% |
$125.23
|
790,312
85.16% of 50 DAV
50 DAV is 928,000
|
$142.64
-12.45%
|
8/25/2021
|
$128.72
|
PP = $127.78
|
|
MB = $134.17
|
Most Recent Note - 12/9/2021 6:19:25 PM
G - A rebound above its 50 DMA line ($129.56) is needed for its outlook to improve. Tested near the prior low ($119) and 200 DMA line ($118) which define important near-term support to watch. More damaging losses would raise greater concerns. Its Relative Strength Rating is 71, above the 80+ minimum guideline for buy candidates. Fundamentals remain strong after it reported Sep '21 quarterly earnings +65% on +21% sales revenues versus the year ago period, continuing its strong earnings track record.
>>> FEATURED STOCK ARTICLE : Recent Violation of 50-Day Moving Average Triggered Sell Signal - 11/11/2021 |
View all notes |
Set NEW NOTE alert |
Company Profile |
SEC
News |
Chart |
Request a new note
C
A
S
I |
TTD
-
NASDAQ
The Trade Desk Inc Cl A
Comml Svcs-Advertising
|
$92.50
|
-1.56
-1.66% |
$95.21
|
3,038,613
57.42% of 50 DAV
50 DAV is 5,292,000
|
$114.09
-18.92%
|
11/9/2021
|
$95.16
|
PP = $90.00
|
|
MB = $94.50
|
Most Recent Note - 12/9/2021 6:13:42 PM
G - Consolidating near its "max buy" level. It has not formed a sound base of sufficient length but found support near the prior high ($90). More damaging losses would raise serious concerns and its 50 DMA line ($85.81) defines additional support to watch.
>>> FEATURED STOCK ARTICLE : Powerful Volume-Driven Gains for New Highs - 11/9/2021 |
View all notes |
Set NEW NOTE alert |
Company Profile |
SEC
News |
Chart |
Request a new note
C
A
S
I |
MEDP
-
NASDAQ
Medpace Holdings Inc
Medical-Research Eqp/Svc
|
$206.26
|
+1.60
0.78% |
$208.00
|
123,743
77.34% of 50 DAV
50 DAV is 160,000
|
$231.00
-10.71%
|
9/10/2021
|
$196.32
|
PP = $196.22
|
|
MB = $206.03
|
Most Recent Note - 12/9/2021 6:17:27 PM
G - Pulled back today with +21% above average volume and closed just below its 50 DMA line ($207). More damaging losses may trigger a worrisome technical sell signal. Prior highs in the $199 area define the next important near-term support to watch. Recently noted repeatedly - "Sep '21 earnings rose +18% on +28% sales revenues versus the year ago period, below the +25% minimum earnings guideline (C criteria), raising fundamental concerns.
>>> FEATURED STOCK ARTICLE : Medpace Hovering at High With Volume Totals Cooling - 11/17/2021 |
View all notes |
Set NEW NOTE alert |
Company Profile |
SEC
News |
Chart |
Request a new note
C
A
S
I |
JEF
-
NYSE
Jefferies Financial Grp
Finance-Invest Bnk/Bkrs
|
$37.53
|
-0.77
-2.01% |
$38.34
|
859,738
54.00% of 50 DAV
50 DAV is 1,592,000
|
$44.47
-15.61%
|
6/28/2021
|
$31.81
|
PP = $34.42
|
|
MB = $36.14
|
Most Recent Note - 12/9/2021 5:56:09 PM
G - Still sputtering with volume totals cooling, meanwhile, a rebound above the 50 DMA line ($40.83) is needed for its outlook to improve. Reported Aug '21 quarterly earnings +40% on +20% sales revenues versus the year ago period. See the latest FSU analysis for more details and a new annotated graph.
>>> FEATURED STOCK ARTICLE : Volume Totals Cooling While Lingering Below 50-Day Moving Average - 12/9/2021 |
View all notes |
Set NEW NOTE alert |
Company Profile |
SEC
News |
Chart |
Request a new note
C
A
S
I |
Symbol/Exchange
Company Name
Industry Group |
PRICE |
CHANGE
(%Change) |
Day High |
Volume
(% DAV)
(% 50 day avg vol) |
52 Wk Hi
% From Hi |
Featured
Date |
Price
Featured |
Pivot Featured |
|
Max Buy |
AVTR
-
NYSE
Avantor Inc
Medical-Research Eqp/Svc
|
$39.19
|
-0.16
-0.41% |
$39.61
|
2,606,163
70.74% of 50 DAV
50 DAV is 3,684,000
|
$44.37
-11.67%
|
6/10/2021
|
$32.94
|
PP = $34.09
|
|
MB = $35.79
|
Most Recent Note - 12/9/2021 6:03:17 PM
G - Consolidating above its 50 DMA line ($39.11) helping its technical stance improve. Faces overhead supply up to the $44 level. Prior lows in the high $36 area define important near-term support. Reported Sep '21 quarterly earnings +46% above the year ago period. Completed a Secondary Offering on 9/13/21.
>>> FEATURED STOCK ARTICLE : Faces Resistance While Sputtering Below 50 DMA Line - 11/12/2021 |
View all notes |
Set NEW NOTE alert |
Company Profile |
SEC
News |
Chart |
Request a new note
C
A
S
I |
MIME
-
NASDAQ
Mimecast Limited
Computer Sftwr-Security
|
$79.24
|
-0.01
-0.01% |
$79.48
|
3,112,698
345.86% of 50 DAV
50 DAV is 900,000
|
$85.48
-7.30%
|
10/18/2021
|
$68.17
|
PP = $71.55
|
|
MB = $75.13
|
Most Recent Note - 12/13/2021 12:50:47 PM
G - Holding its ground after gapping up on 12/07/21 M&A news. Found prompt support at its 50 DMA line ($74.50 and prior highs in the $71 area. More damaging losses would raise concerns and trigger technical sell signals.
>>> FEATURED STOCK ARTICLE : Extended From Latest Base While Fundamentals Remain Strong - 11/26/2021 |
View all notes |
Set NEW NOTE alert |
Company Profile |
SEC
News |
Chart |
Request a new note
C
A
S
I |
AZTA
-
NASDAQ
"Azenta, Inc."
ELECTRONICS - Semiconductor Equipment
|
$100.51
|
-2.00
-1.95% |
$103.38
|
626,798
117.18% of 50 DAV
50 DAV is 534,900
|
$124.79
-19.46%
|
9/20/2021
|
$101.21
|
PP = $108.82
|
|
MB = $114.26
|
Most Recent Note - 12/9/2021 6:05:17 PM
G - Slumped today after meeting resistance near its 50 DMA line ($110.89). A rebound above the 50 DMA line is needed for its outlook to improve. See the latest FSU analysis for more details and an annotated graph.
>>> FEATURED STOCK ARTICLE : Recently Undercut Prior High and 50-Day Moving Average - 12/8/2021 |
View all notes |
Set NEW NOTE alert |
Company Profile |
SEC
News |
Chart |
Request a new note
C
A
S
I |
|
|
|
THESE ARE NOT BUY RECOMMENDATIONS!
Comments contained in the body of this report are technical
opinions only. The material herein has been obtained
from sources believed to be reliable and accurate, however,
its accuracy and completeness cannot be guaranteed.
This site is not an investment advisor, hence it does
not endorse or recommend any securities or other investments.
Any recommendation contained in this report may not
be suitable for all investors and it is not to be deemed
an offer or solicitation on our part with respect to
the purchase or sale of any securities. All trademarks,
service marks and trade names appearing in this report
are the property of their respective owners, and are
likewise used for identification purposes only.
This report is a service available
only to active Paid Premium Members.
You may opt-out of receiving report notifications
at any time. Questions or comments may be submitted
by writing to Premium Membership Services 665 S.E. 10 Street, Suite 201 Deerfield Beach, FL 33441-5634 or by calling 1-800-965-8307
or 954-785-1121.
|
|
|