***Last / Change / Volume data in this table is the closing quote data***
Symbol/Exchange
Company Name
Industry Group |
PRICE |
CHANGE
(%Change) |
Day High |
Volume
(% DAV)
(% 50 day avg vol) |
52 Wk Hi
% From Hi |
Featured
Date |
Price
Featured |
Pivot Featured |
|
Max Buy |
 SIVB
-
NASDAQ
SIVB
-
NASDAQ
S V B Financial Group
BANKING - Regional - Pacific Banks
|
$692.33
|
-32.17
-4.44% |
$720.92
|
744,026
224.78% of 50 DAV
50 DAV is 331,000
|
$763.22
-9.29%
|
8/6/2021
|
$589.70
|
PP = $608.94
|
|
MB = $639.39
|
 Most Recent Note - 11/30/2021 5:42:49 PM
G - Violated its 50 DMA line ($703) with today's more damaging loss on higher volume raising concerns and triggering a technical sell signal. Only a prompt rebound above the 50 DMA line would help its outlook improve. Recently reported Sep '21 quarterly earnings -14% on +43% sales revenues versus the year ago period, below the +25% minimum earnings guideline (C criteria), raising fundamental concerns. Completed a new Public Offering on 8/11/21.
>>> FEATURED STOCK ARTICLE : Latest Quarter Raised Fundamental Concerns - 10/29/2021 |
View all notes |
Set NEW NOTE alert |
Company Profile |
SEC
News |
Chart |
Request a new note
C
A
S
I |
BLDR
-
NYSE
Builders Firstsource Inc
Bldg-Constr Prds/Misc
|
$69.44
|
-2.41
-3.35% |
$71.50
|
2,726,161
138.03% of 50 DAV
50 DAV is 1,975,000
|
$74.15
-6.35%
|
8/12/2021
|
$52.38
|
PP = $54.09
|
|
MB = $56.79
|
Most Recent Note - 11/30/2021 5:44:16 PM
G - Very extended from any sound base, pulling back today with higher volume after wedging into new all-time high territory. Reported Sep '21 quarterly earnings +308% on +140% sales revenues versus the year ago period. Its 50 DMA line ($60.80) and prior highs in the $55 area define important near-term support to watch on pullbacks.
>>> FEATURED STOCK ARTICLE : Earnings News Due Thursday for High-Ranked Building Products Firm - 11/2/2021 |
View all notes |
Set NEW NOTE alert |
Company Profile |
SEC
News |
Chart |
Request a new note
C
A
S
I |
DSGX
-
NASDAQ
Descartes Systems Group
COMPUTER SOFTWARE and SERVICES - Business Software and Services
|
$80.36
|
-2.76
-3.32% |
$83.68
|
143,490
166.85% of 50 DAV
50 DAV is 86,000
|
$91.39
-12.07%
|
11/18/2021
|
$90.77
|
PP = $87.56
|
|
MB = $91.94
|
Most Recent Note - 11/30/2021 5:46:37 PM
G - Due to report Oct '21 quarterly results tomorrow. Color code is changed to green after violating its 50 DMA line ($83.46) with today's big loss with higher volume. There was a "negative reversal" noted on 11/18/21 as it finished near the session low with a loss on above average volume after highlighted in yellow in the mid-day report with pivot point cited based on its 9/23/21 high plus 10 cents. Members were reminded - "While recently wedging from a 6-week base, gains above a stock's pivot point must be backed by at least +40% above average volume to clinch a proper technical buy signal."
>>> FEATURED STOCK ARTICLE : Reversed After Wedging to New Highs - 11/18/2021 |
View all notes |
Set NEW NOTE alert |
Company Profile |
SEC
News |
Chart |
Request a new note
C
A
S
I |
KFRC
-
NASDAQ
Kforce Inc
Comml Svcs-Staffing
|
$76.63
|
-2.20
-2.79% |
$78.44
|
251,811
237.56% of 50 DAV
50 DAV is 106,000
|
$81.47
-5.94%
|
9/10/2021
|
$59.53
|
PP = $64.48
|
|
MB = $67.70
|
Most Recent Note - 11/29/2021 12:59:55 PM
G - Still hovering near its all-time high. Its prior high and 50 DMA line ($68.66) define important near-term support to watch on pullbacks. Recently reported Sep '21 quarterly earnings +8% on +10% sales revenues versus the year ago period, below the +25% minimum earnings guideline (C criteria), raising fundamental concerns.
>>> FEATURED STOCK ARTICLE : Extended From Base and Latest Quarter Earnings Growth Sub Par - 11/19/2021 |
View all notes |
Set NEW NOTE alert |
Company Profile |
SEC
News |
Chart |
Request a new note
C
A
S
I |
GNRC
-
NYSE
Generac Hldgs Inc
Electrical-Power/Equipmt
|
$421.24
|
-3.34
-0.79% |
$433.52
|
1,554,845
238.47% of 50 DAV
50 DAV is 652,000
|
$524.31
-19.66%
|
8/30/2021
|
$449.36
|
PP = $457.10
|
|
MB = $479.96
|
Most Recent Note - 11/26/2021 2:37:09 PM
G - Sputtering below its 50 DMA line ($442) which has acted as resistance. Weak action came after it recently reported Sep '21 quarterly earnings +13% on +34% sales revenues versus the year ago period, below the +25% minimum earnings guideline (C criteria), raising fundamental concerns.
>>> FEATURED STOCK ARTICLE : Halted Slide at 50-Day Moving Average After Earnings News - 11/8/2021 |
View all notes |
Set NEW NOTE alert |
Company Profile |
SEC
News |
Chart |
Request a new note
C
A
S
I |
Symbol/Exchange
Company Name
Industry Group |
PRICE |
CHANGE
(%Change) |
Day High |
Volume
(% DAV)
(% 50 day avg vol) |
52 Wk Hi
% From Hi |
Featured
Date |
Price
Featured |
Pivot Featured |
|
Max Buy |
CAMT
-
NASDAQ
Camtek Ltd
ELECTRONICS - Scientific and Technical Instrum
|
$46.12
|
-0.20
-0.43% |
$47.72
|
525,143
222.52% of 50 DAV
50 DAV is 236,000
|
$49.60
-7.02%
|
11/9/2021
|
$45.43
|
PP = $46.11
|
|
MB = $48.42
|
Most Recent Note - 11/29/2021 5:02:51 PM
Y - Posted a solid gain today with higher volume, finding prompt support near the prior high. Weak action came after recently proposing a new $140 Million note offering. Fundamentals remain strong.
>>> FEATURED STOCK ARTICLE : Rebound Above 50-Day Moving Average Helped Outlook - 11/5/2021 |
View all notes |
Set NEW NOTE alert |
Company Profile |
SEC
News |
Chart |
Request a new note
C
A
S
I |
AMD
-
NASDAQ
Advanced Micro Devices
ELECTRONICS - Semiconductor - Broad Line
|
$158.37
|
-3.54
-2.19% |
$164.46
|
74,678,106
141.49% of 50 DAV
50 DAV is 52,780,000
|
$162.51
-2.55%
|
10/27/2021
|
$124.91
|
PP = $122.59
|
|
MB = $128.72
|
Most Recent Note - 11/30/2021 11:50:38 AM
G - Pulling back after early gains into new high territory. Very extended from the previously noted base. Its 50 DMA line ($125) and prior high in the $122 area define important support to watch on pullbacks. Fundamentals remain strong after it reported Sep '21 quarterly earnings +78% on +54% sales revenues versus the year ago period.
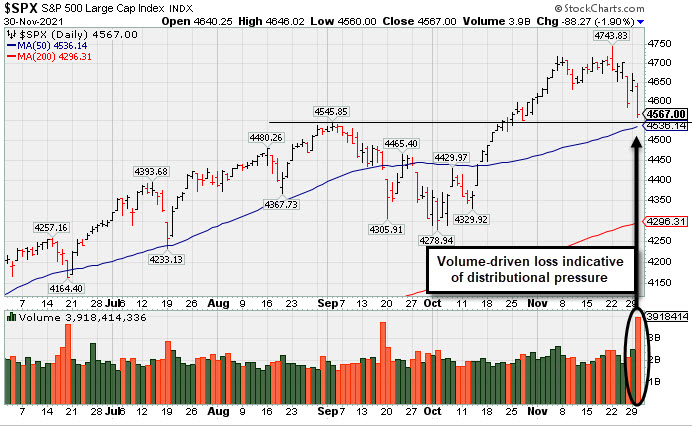
>>> FEATURED STOCK ARTICLE : Encountered Distributional Pressure After Reaching New High - 10/27/2021 |
View all notes |
Set NEW NOTE alert |
Company Profile |
SEC
News |
Chart |
Request a new note
C
A
S
I |
UMC
-
NYSE
United Microelectrnc Adr
ELECTRONICS - Semiconductor - Integrated Cir
|
$11.63
|
+0.20
1.75% |
$11.75
|
8,154,865
107.73% of 50 DAV
50 DAV is 7,570,000
|
$12.62
-7.84%
|
8/5/2021
|
$11.62
|
PP = $11.38
|
|
MB = $11.95
|
Most Recent Note - 11/30/2021 5:28:59 PM
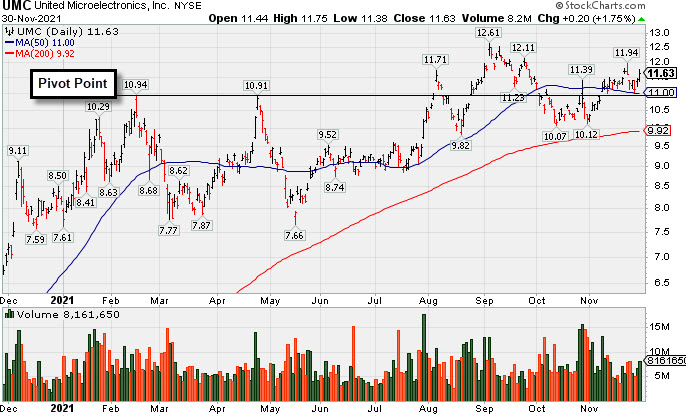
G - Posted a 2nd consecutive gain while consolidating above its 50 DMA line ($11.00) with volume totals near average. Reported Sep '21 quarterly earnings +100% on +30% sales revenues versus the year ago period. Recently found support above its 200 DMA line ($10.07). See the latest FSU analysis for more details and a new annotated graph.
>>> FEATURED STOCK ARTICLE : Rebound Above 50-Day Moving Average Showed Resilience - 11/30/2021 |
View all notes |
Set NEW NOTE alert |
Company Profile |
SEC
News |
Chart |
Request a new note
C
A
S
I |
BRKS
-
NASDAQ
Brooks Automation
ELECTRONICS - Semiconductor Equipment and Mate
|
$113.10
|
-3.18
-2.73% |
$116.93
|
1,017,223
166.46% of 50 DAV
50 DAV is 611,100
|
$124.79
-9.37%
|
9/20/2021
|
$101.21
|
PP = $108.82
|
|
MB = $114.26
|
Most Recent Note - 11/30/2021 5:36:27 PM
Y - Today's loss with above average volume led to a pullback below its "max buy" level and its color code is changed to yellow. Prior high ($110) and its 50 DMA line define important near-term support to watch where violations may trigger technical sell signals. Reported Sep 21 quarterly earnings +33% on +27% sales revenues versus the year ago period.
>>> FEATURED STOCK ARTICLE : Consolidating Still Well Above Prior High and 50 DMA Line - 11/24/2021 |
View all notes |
Set NEW NOTE alert |
Company Profile |
SEC
News |
Chart |
Request a new note
C
A
S
I |
ENTG
-
NASDAQ
Entegris Inc
ELECTRONICS - Semiconductor Equipment and Mate
|
$146.08
|
-8.67
-5.60% |
$157.49
|
7,401,712
833.53% of 50 DAV
50 DAV is 888,000
|
$158.00
-7.54%
|
8/4/2021
|
$125.33
|
PP = $126.51
|
|
MB = $132.84
|
Most Recent Note - 11/30/2021 5:38:31 PM
G - Suffered a big volume-driven loss today. Very extended from any sound base, its 50 DMA line ($137) and prior high ($136) define important near-term support to watch. Fundamentals remain strong after it recently reported Sep '21 quarterly earnings +37% on +20% sales revenues versus the year ago period. See the latest FSU analysis for more details and an annotated graph.
>>> FEATURED STOCK ARTICLE : Best Ever Close After Volume-Driven Gain - 11/29/2021 |
View all notes |
Set NEW NOTE alert |
Company Profile |
SEC
News |
Chart |
Request a new note
C
A
S
I |
Symbol/Exchange
Company Name
Industry Group |
PRICE |
CHANGE
(%Change) |
Day High |
Volume
(% DAV)
(% 50 day avg vol) |
52 Wk Hi
% From Hi |
Featured
Date |
Price
Featured |
Pivot Featured |
|
Max Buy |
SKY
-
NYSE
Skyline Champion Corp
Bldg-Mobile/Mfg andamp; RV
|
$78.25
|
-2.24
-2.78% |
$81.54
|
501,662
132.02% of 50 DAV
50 DAV is 380,000
|
$82.73
-5.42%
|
11/3/2021
|
$72.19
|
PP = $66.92
|
|
MB = $70.27
|
Most Recent Note - 11/30/2021 5:33:36 PM
G - Very extended from the previously noted flat base, it pulled back today with higher volume. Its 50 DMA line ($68) and prior highs in the $66 area define important near-term support to watch. Reported very strong Mar, Jun and Sep '21 quarterly results versus the year ago periods well above the +25% minimum earnings guideline (C criteria). Annual earnings (A criteria) history has been strong.
>>> FEATURED STOCK ARTICLE : Breakaway Gap After 10-Week Flat Base - 11/3/2021 |
View all notes |
Set NEW NOTE alert |
Company Profile |
SEC
News |
Chart |
Request a new note
C
A
S
I |
WSM
-
NYSE
Williams Sonoma Inc
RETAIL - Home Furnishing Stores
|
$194.84
|
-11.16
-5.42% |
$206.69
|
1,067,367
122.12% of 50 DAV
50 DAV is 874,000
|
$223.32
-12.75%
|
11/3/2021
|
$205.00
|
PP = $195.09
|
|
MB = $204.84
|
Most Recent Note - 11/30/2021 5:40:16 PM
Y - Color code is changed to yellow after slumping below its "max buy" level with a big loss today. Near-term support to watch is its 50 DMA line ($192.40). Fundamental remain strong after it reported Oct '21 quarterly earnings +30% on +16% sales revenues versus the year ago period.
>>> FEATURED STOCK ARTICLE : Volume-Driven Gains May Signal a New Meaningful Leg Up - 11/4/2021 |
View all notes |
Set NEW NOTE alert |
Company Profile |
SEC
News |
Chart |
Request a new note
C
A
S
I |
TITN
-
NASDAQ
Titan Machinery Inc
SPECIALTY RETAIL
|
$33.24
|
-0.19
-0.57% |
$33.84
|
220,500
142.26% of 50 DAV
50 DAV is 155,000
|
$38.58
-13.84%
|
11/23/2021
|
$36.22
|
PP = $35.34
|
|
MB = $37.11
|
Most Recent Note - 11/29/2021 1:17:52 PM
Y - Holding its ground today. Pulled back for 2nd consecutive losses after a gain for a new 52-week high clinched a technical buy signal. Highlighted in the 11/23/21 mid-day report in yellow with pivot point cited base on its 6/01/21 high plus 10 cents. Reported Oct '21 quarterly earnings +81% on +26% sales revenues over the year ago period, its 4th strong quarterly comparison. Volume and volatility often increase near earnings news. Following years of losses it has shown strong earnings growth for FY '19-21.
>>> FEATURED STOCK ARTICLE : Strong Close With Gain Backed by +467% Above Average Volume - 11/23/2021 |
View all notes |
Set NEW NOTE alert |
Company Profile |
SEC
News |
Chart |
Request a new note
C
A
S
I |
CLFD
-
NASDAQ
Clearfield Inc
TELECOMMUNICATIONS - Cables / Satalite Equipment
|
$64.74
|
-1.17
-1.78% |
$65.98
|
367,715
317.00% of 50 DAV
50 DAV is 116,000
|
$72.00
-10.08%
|
7/23/2021
|
$40.23
|
PP = $43.74
|
|
MB = $45.93
|
Most Recent Note - 11/29/2021 4:59:19 PM
G - Still hovering near its all-time high, very extended from the previously noted base. Its 50 DMA line ($55.68) defines near-term support to watch on pullbacks. Reported Sep '21 quarterly earnings +141% on +66% sales revenues above the year ago period.
>>> FEATURED STOCK ARTICLE : Perched Near High Extended From Any Sound Base - 11/22/2021 |
View all notes |
Set NEW NOTE alert |
Company Profile |
SEC
News |
Chart |
Request a new note
C
A
S
I |
ENPH
-
NASDAQ
Enphase Energy Inc
Energy-Solar
|
$250.00
|
-6.71
-2.61% |
$259.40
|
2,738,871
117.35% of 50 DAV
50 DAV is 2,334,000
|
$282.46
-11.49%
|
10/28/2021
|
$218.00
|
PP = $229.14
|
|
MB = $240.60
|
Most Recent Note - 11/29/2021 5:07:36 PM
G - Consolidating following a "negative reversal" last week at its all-time high. It is extended from the previously noted base. Prior high ($229) defines initial support to watch on pullbacks.
>>> FEATURED STOCK ARTICLE : Enphase is Challenging its All-Time High With Volume-Driven Gains - 10/28/2021 |
View all notes |
Set NEW NOTE alert |
Company Profile |
SEC
News |
Chart |
Request a new note
C
A
S
I |
Symbol/Exchange
Company Name
Industry Group |
PRICE |
CHANGE
(%Change) |
Day High |
Volume
(% DAV)
(% 50 day avg vol) |
52 Wk Hi
% From Hi |
Featured
Date |
Price
Featured |
Pivot Featured |
|
Max Buy |
SMPL
-
NASDAQ
Simply Good Foods Co
Food-Confectionery
|
$36.97
|
-0.80
-2.12% |
$38.08
|
362,226
101.18% of 50 DAV
50 DAV is 358,000
|
$41.35
-10.59%
|
10/25/2021
|
$38.30
|
PP = $38.60
|
|
MB = $40.53
|
Most Recent Note - 11/26/2021 2:50:51 PM
Y - Pulled back with higher (near average) volume today, testing near prior highs in the $38 area and its 50 DMA line ($37.30) which define important near-term support.
>>> FEATURED STOCK ARTICLE : Consolidating Above Prior High Following Recent Technical Breakout - 11/15/2021 |
View all notes |
Set NEW NOTE alert |
Company Profile |
SEC
News |
Chart |
Request a new note
C
A
S
I |
WDAY
-
NYSE
Workday Inc Cl A
Computer Sftwr-Enterprse
|
$274.23
|
-7.36
-2.61% |
$284.25
|
1,918,121
120.74% of 50 DAV
50 DAV is 1,588,700
|
$307.61
-10.85%
|
9/7/2021
|
$275.69
|
PP = $282.87
|
|
MB = $297.01
|
Most Recent Note - 11/29/2021 5:13:06 PM
Y - Color code is changed to yellow after finding prompt support near prior highs in the $278-282 area and its 50 DMA line following recent damaging losses that triggered a technical sell signal. Reported Oct '21 quarterly earnings +28% on +20% sales revenues versus the year ago period. Fundamentals remain strong.
>>> FEATURED STOCK ARTICLE : Getting Extended From Previously Noted Base - 11/16/2021 |
View all notes |
Set NEW NOTE alert |
Company Profile |
SEC
News |
Chart |
Request a new note
C
A
S
I |
CTLT
-
NYSE
Catalent Inc
DRUGS - Biotechnology
|
$128.66
|
-5.30
-3.96% |
$134.21
|
2,084,389
236.86% of 50 DAV
50 DAV is 880,000
|
$142.64
-9.80%
|
8/25/2021
|
$128.72
|
PP = $127.78
|
|
MB = $134.17
|
Most Recent Note - 11/30/2021 12:00:41 PM
G - After some encouraging gains today's loss has it pulling back below its 50 DMA line ($131) which recently acted as resistance. Its prior low ($119) and 200 DMA line ($117.73) define important near-term support to watch. More damaging losses would raise greater concerns. Its Relative Strength Rating is 84, above the 80+ minimum guideline for buy candidates. Fundamentals remain strong after it reported Sep '21 quarterly earnings +65% on +21% sales revenues versus the year ago period, continuing its strong earnings track record.
>>> FEATURED STOCK ARTICLE : Recent Violation of 50-Day Moving Average Triggered Sell Signal - 11/11/2021 |
View all notes |
Set NEW NOTE alert |
Company Profile |
SEC
News |
Chart |
Request a new note
C
A
S
I |
TTD
-
NASDAQ
The Trade Desk Inc Cl A
Comml Svcs-Advertising
|
$103.42
|
-3.64
-3.40% |
$110.87
|
5,656,526
110.37% of 50 DAV
50 DAV is 5,125,000
|
$114.09
-9.35%
|
11/9/2021
|
$95.16
|
PP = $90.00
|
|
MB = $94.50
|
Most Recent Note - 11/30/2021 5:49:54 PM
G - There was another "negative reversal" today after early gains. Extended from the previously noted 9-month cup-with-handle shaped base. Prior high ($90) and its 50 DMA line ($83) define initial support to watch.
>>> FEATURED STOCK ARTICLE : Powerful Volume-Driven Gains for New Highs - 11/9/2021 |
View all notes |
Set NEW NOTE alert |
Company Profile |
SEC
News |
Chart |
Request a new note
C
A
S
I |
MEDP
-
NASDAQ
Medpace Holdings Inc
Medical-Research Eqp/Svc
|
$207.41
|
-1.68
-0.80% |
$210.29
|
187,314
117.07% of 50 DAV
50 DAV is 160,000
|
$231.00
-10.21%
|
9/10/2021
|
$196.32
|
PP = $196.22
|
|
MB = $206.03
|
Most Recent Note - 11/30/2021 5:31:35 PM
G - Pulled back near its "max buy" level while testing its 50 DMA line ($204.67) with today's 3rd consecutive loss. More damaging losses may trigger a technical sell signal. As recently noted, Sep '21 earnings rose +18% on +28% sales revenues versus the year ago period, below the +25% minimum earnings guideline (C criteria), raising fundamental concerns. Below its 50 DMA line the prior highs in the $199 area define important near-term support to watch.
>>> FEATURED STOCK ARTICLE : Medpace Hovering at High With Volume Totals Cooling - 11/17/2021 |
View all notes |
Set NEW NOTE alert |
Company Profile |
SEC
News |
Chart |
Request a new note
C
A
S
I |
Symbol/Exchange
Company Name
Industry Group |
PRICE |
CHANGE
(%Change) |
Day High |
Volume
(% DAV)
(% 50 day avg vol) |
52 Wk Hi
% From Hi |
Featured
Date |
Price
Featured |
Pivot Featured |
|
Max Buy |
JEF
-
NYSE
Jefferies Financial Grp
Finance-Invest Bnk/Bkrs
|
$37.58
|
-0.79
-2.06% |
$38.33
|
2,192,406
126.66% of 50 DAV
50 DAV is 1,731,000
|
$44.47
-15.49%
|
6/28/2021
|
$31.81
|
PP = $34.42
|
|
MB = $36.14
|
Most Recent Note - 11/29/2021 5:17:50 PM
G - Today's weak close and loss with higher (near average) volume raised greater concerns. Only a rebound above the 50 DMA line ($40.59) would help its outlook improve. Reported Aug '21 quarterly earnings +40% on +20% sales revenues versus the year ago period.
>>> FEATURED STOCK ARTICLE : Extended From Prior Highs and Stubbornly Holding Ground - 11/1/2021 |
View all notes |
Set NEW NOTE alert |
Company Profile |
SEC
News |
Chart |
Request a new note
C
A
S
I |
AVTR
-
NYSE
Avantor Inc
Medical-Research Eqp/Svc
|
$39.48
|
-0.30
-0.75% |
$40.72
|
4,038,311
101.41% of 50 DAV
50 DAV is 3,982,000
|
$44.37
-11.02%
|
6/10/2021
|
$32.94
|
PP = $34.09
|
|
MB = $35.79
|
Most Recent Note - 11/26/2021 2:13:47 PM
G - Ended near the session low today, still sputtering and meeting resistance at its 50 DMA line ($39.73). A rebound above the 50 DMA line is needed for its outlook to improve, and it faces overhead supply up to the $44 level. Reported Sep '21 quarterly earnings +46% above the year ago period. Completed a Secondary Offering on 9/13/21.
>>> FEATURED STOCK ARTICLE : Faces Resistance While Sputtering Below 50 DMA Line - 11/12/2021 |
View all notes |
Set NEW NOTE alert |
Company Profile |
SEC
News |
Chart |
Request a new note
C
A
S
I |
MIME
-
NASDAQ
Mimecast Limited
Computer Sftwr-Security
|
$81.00
|
-1.56
-1.89% |
$83.50
|
738,434
134.51% of 50 DAV
50 DAV is 549,000
|
$85.48
-5.24%
|
10/18/2021
|
$68.17
|
PP = $71.55
|
|
MB = $75.13
|
Most Recent Note - 11/29/2021 5:06:18 PM
G - Posted a solid gain today with higher volume. Very extended from the previously noted base. Its 50 DMA line ($72) and prior highs in the $71 area define important near-term support to watch on pullbacks.
>>> FEATURED STOCK ARTICLE : Extended From Latest Base While Fundamentals Remain Strong - 11/26/2021 |
View all notes |
Set NEW NOTE alert |
Company Profile |
SEC
News |
Chart |
Request a new note
C
A
S
I |