You are not logged in.
This means you
CAN ONLY VIEW reports that were published prior to Sunday, March 30, 2025.
You
MUST UPGRADE YOUR MEMBERSHIP if you want to see any current reports.
AFTER MARKET UPDATE - THURSDAY, DECEMBER 16TH, 2021
Previous After Market Report Next After Market Report >>>
|
|
|
|
DOW |
-29.79 |
35,897.64 |
-0.08% |
|
Volume |
1,140,367,974 |
+1% |
|
Volume |
4,842,773,500 |
-8% |
|
NASDAQ |
-385.15 |
15,180.43 |
-2.47% |
|
Advancers |
1,494 |
46% |
|
Advancers |
1,570 |
35% |
|
S&P 500 |
-41.18 |
4,668.67 |
-0.87% |
|
Decliners |
1,775 |
54% |
|
Decliners |
2,876 |
65% |
|
Russell 2000 |
-42.75 |
2,152.46 |
-1.95% |
|
52 Wk Highs |
110 |
|
|
52 Wk Highs |
83 |
|
|
S&P 600 |
-22.23 |
1,340.90 |
-1.63% |
|
52 Wk Lows |
97 |
|
|
52 Wk Lows |
219 |
|
|
New buying efforts can be made in stocks meeting all key criteria of the fact-based investment system after the big gain Wednesday from the Nasdaq Composite Index (+2.1%) with higher volume and an expansion in leadership (stocks hitting new 52-week highs) established a new confirmed uptrend for the market (M criteria).
|
 |
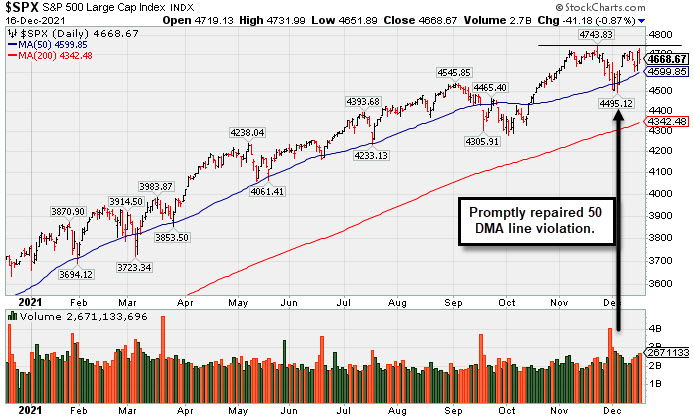
Major Indices Encounter Pressure, Hurting the New Rally
Kenneth J. Gruneisen - Passed the CAN SLIM® Master's Exam
The Dow reversed a more than 250 point rally to end 29 points lower. The S&P 500 slid 0.9%, while the tech-heavy Nasdaq Composite notched its worst one-day session since September, slumping 2.5% amid a rout in growth-related stocks. The small-cap Russell 2000 lost nearly 2%, remaining 12% below its November 8 peak. The volume totals reported were mixed, slightly higher than the prior session on the NYSE and lower on the Nasdaq exchange. Breadth was negative as decliners led advancers by a 6-5 margin on the NYSE and by a 7-4 margin on the Nasdaq exchange. There were 48 high-ranked companies from the Leaders List that hit new 52-week highs and were listed on the BreakOuts Page, versus the total of 23 on the prior session. New 52-week highs increased and outnumbered new 52-week lows on the NYSE, but new lows still outnumbered new 52-week highs on the Nasdaq exchange. Solid gains on Wednesday signaled a new confirmed uptrend for the market (M criteria), opening the door again to new buying efforts under the fact-based investment system.
 PICTURED: The S&P 500 Index suffered a distribution day on Thursday marked by a "negative reversal" and loss on higher volume. Caution may be advised as the weak action does not bode well for the fresh rally after confirming gains on Wednesday coupled with an increase in stocks hitting new 52-week highs met the definition of a proper follow-through day.
U.S. equities finished lower on Thursday as investors continued to assess monetary policy pivots from global central banks. Treasuries advanced, with the yield on the 10-year note down three basis points (0.03%) to 1.43% and the two-year note rate falling four basis points (0.04%) to 0.62%.
Eight of 11 S&P 500 sectors finished in positive territory. However, mega-cap stocks weighed on the broader market, with Apple (AAPL -3.93%) and Tesla (TSLA -5.03%) both slumping. In earnings, shares of Adobe (ADBE -10.19%) saw their worst one-day slump since March 2020, falling after a disappointing sales forecast.
Yesterday, the Federal Reserve (Fed) announced plans to double the pace of tapering its bond-buying program in an effort to aggressively combat elevated inflation. The Fed’s pandemic-era stimulus would likely end in March, opening the door for subsequent rate hikes. Earlier today, the Bank of England raised its benchmark interest rate, while the European Central Bank voted to temporarily increase its asset purchases in order to smooth the winding down of its emergency debt-buying program.
On the data front, weekly initial jobless claims came in at 206,000, up from the previous 188,000 figure that had marked a 52-year low. Separately, flash December readings from research firm Markit revealed that growth in both the U.S. manufacturing and services sectors unexpectedly decelerated. |
 Kenneth J. Gruneisen started out as a licensed stockbroker in August 1987, a couple of months prior to the historic stock market crash that took the Dow Jones Industrial Average down -22.6% in a single day. He has published daily fact-based fundamental and technical analysis on high-ranked stocks online for two decades. Through FACTBASEDINVESTING.COM, Kenneth provides educational articles, news, market commentary, and other information regarding proven investment systems that work in good times and bad.
Comments contained in the body of this report are technical opinions only and are not necessarily those of Gruneisen Growth Corp. The material herein has been obtained from sources believed to be reliable and accurate, however, its accuracy and completeness cannot be guaranteed. Our firm, employees, and customers may effect transactions, including transactions contrary to any recommendation herein, or have positions in the securities mentioned herein or options with respect thereto. Any recommendation contained in this report may not be suitable for all investors and it is not to be deemed an offer or solicitation on our part with respect to the purchase or sale of any securities. |
|
 |
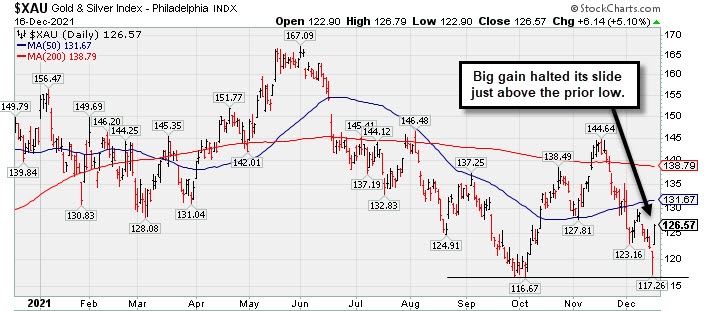
Gold & Silver Index Posted Standout Gain
Kenneth J. Gruneisen - Passed the CAN SLIM® Master's Exam
The Bank Index ($BKX +1.11%) posted a gain and the Broker/Dealer Index ($XBD +0.10%) inched higher while the Retail Index ($RLX -2.24%) was weak. The Semiconductor Index ($SOX -4.27%) led the tech sector's retreat while the Networking Index ($NWX -2.30%) and Biotech Index ($BTK -1.12%) also lost ground. The Oil Services Index ($OSX +0.21%) and the Integrated Oil Index ($XOI +0.74%) both rose modestly.
PICTURED: The Gold & Silver Index ($XAU +5.10%) posted a standout gain, halting its slide just above the prior low. It is below its 50-day and 200-day moving average (DMA) lines.
| Oil Services |
$OSX |
52.03 |
+0.11 |
+0.21% |
+17.37% |
| Integrated Oil |
$XOI |
1,158.75 |
+8.46 |
+0.74% |
+46.22% |
| Semiconductor |
$SOX |
3,766.32 |
-168.14 |
-4.27% |
+34.73% |
| Networking |
$NWX |
913.06 |
-21.50 |
-2.30% |
+27.32% |
| Broker/Dealer |
$XBD |
483.96 |
+0.49 |
+0.10% |
+28.17% |
| Retail |
$RLX |
4,195.40 |
-96.14 |
-2.24% |
+17.74% |
| Gold & Silver |
$XAU |
126.57 |
+6.14 |
+5.10% |
-12.22% |
| Bank |
$BKX |
133.27 |
+1.46 |
+1.11% |
+36.12% |
| Biotech |
$BTK |
5,420.98 |
-61.16 |
-1.12% |
-5.54% |
|
|
|
 |
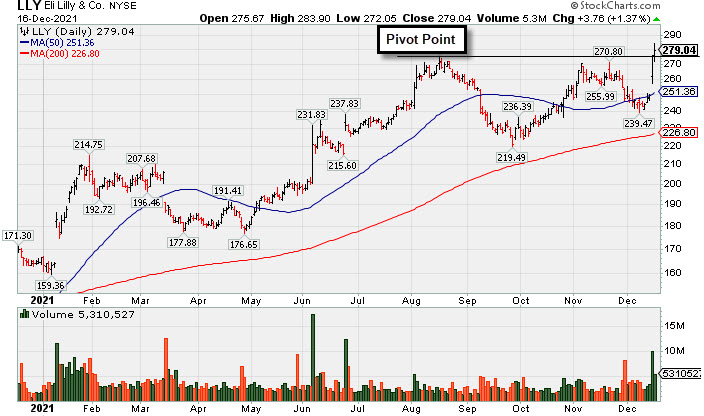
Eli Lilly & Co Powered to New Highs With Volume
Kenneth J. Gruneisen - Passed the CAN SLIM® Master's Exam
Eli Lilly & Co (LLY +$3.76 or +1.37% to $279.04) was highlighted in yellow in the earlier mid-day report (read here) with pivot point cited based on its 8/17/21 high plus 10 cents. It clinched a technical buy signal as volume was +78% above average as this giant Medical - Diversified firm powered to new all-time highs with today's 5th consecutive gain after a choppy 17-week consolidation.
LLY has an Earnings Per Share Rating of 93. It reported Sep '21 quarterly earnings +38% on +18% sales revenues versus the year ago period, and 3 of the past 4 quarterly comparisons were above the +25% minimum earnings guideline (C criteria). Annual earnings (A criteria) improved steadily since a downturn in FY '14.
The number of top-rated funds owning its shares rose from 3,055 in Dec '20 to 3,372 in Sep '21, a reassuring sign concerning the I criteria. Its current Up/Down Volume Ratio of 1.4 is an unbiased indication its shares have been under accumulation over the past 50 days. It has a Timeliness Rating of B and a Sponsorship Rating of B. However, there are 956.6 million shares outstanding, making it an unlikely sprinter, while it is also well-recognized already by the institutional crowd. |
|
|
Color Codes Explained :
Y - Better candidates highlighted by our
staff of experts.
G - Previously featured
in past reports as yellow but may no longer be buyable under the
guidelines.
***Last / Change / Volume data in this table is the closing quote data***
Symbol/Exchange
Company Name
Industry Group |
PRICE |
CHANGE
(%Change) |
Day High |
Volume
(% DAV)
(% 50 day avg vol) |
52 Wk Hi
% From Hi |
Featured
Date |
Price
Featured |
Pivot Featured |
|
Max Buy |
 BLDR
-
NYSE
BLDR
-
NYSE
Builders Firstsource Inc
Bldg-Constr Prds/Misc
|
$77.25
|
-1.01
-1.29% |
$79.15
|
2,427,866
105.74% of 50 DAV
50 DAV is 2,296,000
|
$80.95
-4.57%
|
8/12/2021
|
$52.38
|
PP = $54.09
|
|
MB = $56.79
|
 Most Recent Note - 12/16/2021 5:36:45 PM
G - Stubbornly holding its ground near its all-time high after noted volume-driven gains, very extended from any sound base. Reported Sep '21 quarterly earnings +308% on +140% sales revenues versus the year ago period. It is well above its 50 DMA line ($66.13) which defines near-term support to watch.
>>> FEATURED STOCK ARTICLE : Perched at Record High After +52% Rally in 4 Months - 12/10/2021 |
View all notes |
Set NEW NOTE alert |
Company Profile |
SEC
News |
Chart |
Request a new note
C
A
S
I |
KFRC
-
NASDAQ
Kforce Inc
Comml Svcs-Staffing
|
$73.11
|
-1.29
-1.73% |
$74.88
|
90,394
82.18% of 50 DAV
50 DAV is 110,000
|
$81.47
-10.26%
|
9/10/2021
|
$59.53
|
PP = $64.48
|
|
MB = $67.70
|
Most Recent Note - 12/15/2021 5:43:11 PM
G - Posted a solid gain today with average volume, finding prompt support at its 50 DMA line ($71.67). Recently reported Sep '21 quarterly earnings +8% on +10% sales revenues versus the year ago period, below the +25% minimum earnings guideline (C criteria), raising fundamental concerns.
>>> FEATURED STOCK ARTICLE : Extended From Base and Latest Quarter Earnings Growth Sub Par - 11/19/2021 |
View all notes |
Set NEW NOTE alert |
Company Profile |
SEC
News |
Chart |
Request a new note
C
A
S
I |
REGN
-
NASDAQ
Regeneron Pharmaceutical
DRUGS - Biotechnology
|
$631.74
|
-26.19
-3.98% |
$656.34
|
1,241,113
161.81% of 50 DAV
50 DAV is 767,000
|
$686.62
-7.99%
|
12/13/2021
|
$647.95
|
PP = $686.72
|
|
MB = $721.06
|
Most Recent Note - 12/16/2021 5:40:30 PM
Y - Suffered a big loss today with +61% above average volume raising concerns. Color code was recently changed to yellow with new pivot point cited based on its 9/01/21 high plus 10 cents. Subsequent gains above the pivot point backed by at least +40% above average volume may trigger a technical buy signal. Its Relative Strength rating has slumped to 84, but it is still above the 80+ minimum guideline for buy candidates.
>>> FEATURED STOCK ARTICLE : Consolidating Near All-Time High With Little Resistance Remaining - 12/13/2021 |
View all notes |
Set NEW NOTE alert |
Company Profile |
SEC
News |
Chart |
Request a new note
C
A
S
I |
LLY
-
NYSE
Eli Lilly & Co
Medical-Diversified
|
$279.04
|
+3.76
1.37% |
$283.91
|
5,295,835
178.55% of 50 DAV
50 DAV is 2,966,000
|
$275.87
1.15%
|
12/16/2021
|
$279.28
|
PP = $275.97
|
|
MB = $289.77
|
Most Recent Note - 12/16/2021 5:31:49 PM
Y - Finished strong today after highlighted in yellow in the earlier mid-day report with pivot point cited based on its 8/17/21 high plus 10 cents. This giant Medical - Diversified firm triggered a technical buy signal as it powered to new all-time highs with +78% above average volume behind its 5th consecutive gain after a choppy 17-week consolidation. Reported Sep '21 quarterly earnings +38% on +18% sales revenues versus the year ago period, and 3 of the past 4 quarterly comparisons were above the +25% minimum earnings guideline (C criteria). Annual earnings (A criteria) improved steadily since a downturn in FY '14. See the latest FSU analysis for more details and a new annotated graph.
>>> FEATURED STOCK ARTICLE : Eli Lilly & Co Powered to New Highs With Volume - 12/16/2021 |
View all notes |
Set NEW NOTE alert |
Company Profile |
SEC
News |
Chart |
Request a new note
C
A
S
I |
CAMT
-
NASDAQ
Camtek Ltd
ELECTRONICS - Scientific and Technical Instrum
|
$40.78
|
-2.54
-5.86% |
$44.00
|
141,375
55.01% of 50 DAV
50 DAV is 257,000
|
$49.60
-17.78%
|
11/9/2021
|
$45.43
|
PP = $46.11
|
|
MB = $48.42
|
Most Recent Note - 12/16/2021 5:46:54 PM
G - Reversed abruptly and slumped back below its DMA line ($42.57) today with lighter volume. Faces resistance due to overhead supply up to the $49 level. Fundamentals remain strong.
>>> FEATURED STOCK ARTICLE : Closed Above 50-Day Average After Big Gain With Light Volume - 12/15/2021 |
View all notes |
Set NEW NOTE alert |
Company Profile |
SEC
News |
Chart |
Request a new note
C
A
S
I |
Symbol/Exchange
Company Name
Industry Group |
PRICE |
CHANGE
(%Change) |
Day High |
Volume
(% DAV)
(% 50 day avg vol) |
52 Wk Hi
% From Hi |
Featured
Date |
Price
Featured |
Pivot Featured |
|
Max Buy |
AMD
-
NASDAQ
Advanced Micro Devices
ELECTRONICS - Semiconductor - Broad Line
|
$138.64
|
-7.86
-5.37% |
$147.93
|
63,147,429
112.89% of 50 DAV
50 DAV is 55,937,000
|
$164.46
-15.70%
|
10/27/2021
|
$124.91
|
PP = $122.59
|
|
MB = $128.72
|
Most Recent Note - 12/16/2021 5:34:54 PM
G - Erased much of the prior session's big gain as it reversed and suffered another big loss. Its 50 DMA line ($134.84) and prior low ($130.60 on 12/14/21) define important near term support where violations may trigger technical sell signals. Fundamentals remain strong after it reported Sep '21 quarterly earnings +78% on +54% sales revenues versus the year ago period.
>>> FEATURED STOCK ARTICLE : AMD Pulling Back After Considerable Rally - 12/1/2021 |
View all notes |
Set NEW NOTE alert |
Company Profile |
SEC
News |
Chart |
Request a new note
C
A
S
I |
UMC
-
NYSE
United Microelectrnc Adr
ELECTRONICS - Semiconductor - Integrated Cir
|
$11.01
|
-0.46
-4.01% |
$11.43
|
10,321,104
125.67% of 50 DAV
50 DAV is 8,213,000
|
$12.68
-13.17%
|
12/1/2021
|
$12.60
|
PP = $12.72
|
|
MB = $13.36
|
Most Recent Note - 12/16/2021 5:51:22 PM
Y - Pulled back today with higher volume retesting support near its 50 DMA line ($11.07). More damaging losses would raise concerns. A gain and solid close above the pivot point may help clinch a proper new (or add-on) technical buy signal. Reported Sep '21 quarterly earnings +100% on +30% sales revenues versus the year ago period.
>>> FEATURED STOCK ARTICLE : Rebound Above 50-Day Moving Average Showed Resilience - 11/30/2021 |
View all notes |
Set NEW NOTE alert |
Company Profile |
SEC
News |
Chart |
Request a new note
C
A
S
I |
ENTG
-
NASDAQ
Entegris Inc
ELECTRONICS - Semiconductor Equipment and Mate
|
$133.43
|
-9.11
-6.39% |
$143.44
|
1,742,495
158.12% of 50 DAV
50 DAV is 1,102,000
|
$158.00
-15.55%
|
8/4/2021
|
$125.33
|
PP = $126.51
|
|
MB = $132.84
|
Most Recent Note - 12/16/2021 5:45:11 PM
G - Suffered another damaging loss today with above average volume and finished weak, violating its 50 DMA line ($142) and triggering a technical sell signal. A rebound above the 50 DMA line is needed for its outlook to improve. Fundamentals remain strong after it recently reported Sep '21 quarterly earnings +37% on +20% sales revenues versus the year ago period.
>>> FEATURED STOCK ARTICLE : Best Ever Close After Volume-Driven Gain - 11/29/2021 |
View all notes |
Set NEW NOTE alert |
Company Profile |
SEC
News |
Chart |
Request a new note
C
A
S
I |
DHR
-
NYSE
Danaher Corp
Media-Diversified
|
$318.49
|
+3.51
1.11% |
$323.13
|
3,925,297
158.79% of 50 DAV
50 DAV is 2,472,000
|
$333.96
-4.63%
|
12/16/2021
|
$321.36
|
PP = $334.06
|
|
MB = $350.76
|
Most Recent Note - 12/16/2021 12:41:51 PM
Y - Color code is changed to yellow with pivot point cited base on its 9/10/21 high plus 10 cents. Consolidating above its 50 DMA line and perched within striking distance of its 52-week high. Subsequent gains above the pivot point with at least +40% above average volume may trigger a technical buy signal. Reported Sep '21 quarterly earnings +39% on +23% sales revenues versus the year ago period, its 6th strong comparison above the +25% minimum guideline (C criteria) and sales revenues growth has been strong. Annual earnings (A criteria) history has shown slow steady growth. Has a new CEO as of 9/01/20.
There are no Featured Stock Updates™ available for this stock at this time. You may request one by clicking the Request a New Note link below |
View all notes |
Set NEW NOTE alert |
Company Profile |
SEC
News |
Chart |
Request a new note
C
A
S
I |
SKY
-
NYSE
Skyline Champion Corp
Bldg-Mobile/Mfg andamp; RV
|
$73.82
|
-2.09
-2.75% |
$76.60
|
977,283
227.80% of 50 DAV
50 DAV is 429,000
|
$85.92
-14.08%
|
11/3/2021
|
$72.19
|
PP = $66.92
|
|
MB = $70.27
|
Most Recent Note - 12/16/2021 5:41:49 PM
G - Suffered a 4th consecutive volume-driven loss today, encountering worrisome distributional pressure. Its 50 DMA line ($72.32) defines important near-term support to watch above prior highs in the $66 area. Fundamentals remain strong.
>>> FEATURED STOCK ARTICLE : Pulling Back From All-Time High After Recent Rally - 12/14/2021 |
View all notes |
Set NEW NOTE alert |
Company Profile |
SEC
News |
Chart |
Request a new note
C
A
S
I |
Symbol/Exchange
Company Name
Industry Group |
PRICE |
CHANGE
(%Change) |
Day High |
Volume
(% DAV)
(% 50 day avg vol) |
52 Wk Hi
% From Hi |
Featured
Date |
Price
Featured |
Pivot Featured |
|
Max Buy |
DHI
-
NYSE
D R Horton Inc
MATERIALS and CONSTRUCTION - Residential Construction
|
$104.47
|
-2.90
-2.70% |
$106.66
|
5,430,213
204.45% of 50 DAV
50 DAV is 2,656,000
|
$110.45
-5.41%
|
12/6/2021
|
$104.40
|
PP = $106.99
|
|
MB = $112.34
|
Most Recent Note - 12/16/2021 12:35:58 PM
Y - Posted a solid gain with +156% above average volume and closed above its pivot point on the prior session clinching a technical buy signal. Highlighted in yellow with pivot point cited based on its 5/10/21 high plus 10 cents in the 12/06/21 mid-day report. Reported Sep '21 earnings +68% on +27% sales revenues versus the year-ago period, its 8th strong quarterly comparison above the +25% minimum guideline (C criteria). Annual earnings growth (A criteria) has been strong. The market is in an uptrend (M criteria) and allows for new buying after Wednesday's bullish action confirmed the rally with a follow-through day.
>>> FEATURED STOCK ARTICLE : Builder Built a Solid Base And Challenged Prior High - 12/6/2021 |
View all notes |
Set NEW NOTE alert |
Company Profile |
SEC
News |
Chart |
Request a new note
C
A
S
I |
TITN
-
NASDAQ
Titan Machinery Inc
SPECIALTY RETAIL
|
$33.02
|
-0.06
-0.18% |
$33.83
|
340,466
206.34% of 50 DAV
50 DAV is 165,000
|
$38.58
-14.41%
|
11/23/2021
|
$36.22
|
PP = $35.34
|
|
MB = $37.11
|
Most Recent Note - 12/13/2021 5:23:25 PM
G - Suffered another loss today on higher (near average) volume, still slumping back into the prior base. Reported Oct '21 quarterly earnings +81% on +26% sales revenues over the year ago period, its 4th strong quarterly comparison.
>>> FEATURED STOCK ARTICLE : Strong Close With Gain Backed by +467% Above Average Volume - 11/23/2021 |
View all notes |
Set NEW NOTE alert |
Company Profile |
SEC
News |
Chart |
Request a new note
C
A
S
I |
CLFD
-
NASDAQ
Clearfield Inc
TELECOMMUNICATIONS - Cables / Satalite Equipment
|
$68.44
|
-2.07
-2.94% |
$75.87
|
203,673
161.65% of 50 DAV
50 DAV is 126,000
|
$72.00
-4.94%
|
12/16/2021
|
$72.76
|
PP = $72.10
|
|
MB = $75.71
|
Most Recent Note - 12/16/2021 12:26:26 PM
Y - Powered to a new all-time high with today's 3rd consecutive big gain. Color code is changed to yellow with new pivot point cited based on its 11/15/21 high plus 10 cents. Recently formed a "square box" base as it found support well above its 50 DMA line ($61) when consolidating. A gain and close above the pivot point backed by at least +40% above average volume may trigger a new (or add-on) technical buy signal. Reported Sep '21 quarterly earnings +141% on +66% sales revenues above the year ago period.
>>> FEATURED STOCK ARTICLE : Perched Near High Extended From Any Sound Base - 11/22/2021 |
View all notes |
Set NEW NOTE alert |
Company Profile |
SEC
News |
Chart |
Request a new note
C
A
S
I |
ODFL
-
NASDAQ
Old Dominion Fght Line
TRANSPORTATION - Trucking
|
$351.20
|
-2.37
-0.67% |
$359.75
|
722,592
123.10% of 50 DAV
50 DAV is 587,000
|
$373.58
-5.99%
|
12/7/2021
|
$365.61
|
PP = $364.17
|
|
MB = $382.38
|
Most Recent Note - 12/13/2021 5:17:35 PM
Y - Hovering in a tight range near its all-time high. Subsequent volume-driven gains are needed to clinch a buy signal, and the broader market direction (M criteria) remains a concern until a follow-through day. Reported earnings +44% on +32% sales revenues for the Sep '21 quarter, its 5th consecutive comparison above the +25% minimum guideline (C criteria).
>>> FEATURED STOCK ARTICLE : Perched at All Time High After Tight Consolidation Several Weeks - 12/7/2021 |
View all notes |
Set NEW NOTE alert |
Company Profile |
SEC
News |
Chart |
Request a new note
C
A
S
I |
SMPL
-
NASDAQ
Simply Good Foods Co
Food-Confectionery
|
$37.84
|
+0.00
0.00% |
$38.80
|
504,086
136.24% of 50 DAV
50 DAV is 370,000
|
$41.35
-8.49%
|
10/25/2021
|
$38.30
|
PP = $38.60
|
|
MB = $40.53
|
Most Recent Note - 12/14/2021 5:28:42 PM
G - Still sputtering near its 50 DMA line ($37.83). The prior low and 200 DMA line ($35.37) define the next important support.
>>> FEATURED STOCK ARTICLE : Consolidating Above Prior High Following Recent Technical Breakout - 11/15/2021 |
View all notes |
Set NEW NOTE alert |
Company Profile |
SEC
News |
Chart |
Request a new note
C
A
S
I |
Symbol/Exchange
Company Name
Industry Group |
PRICE |
CHANGE
(%Change) |
Day High |
Volume
(% DAV)
(% 50 day avg vol) |
52 Wk Hi
% From Hi |
Featured
Date |
Price
Featured |
Pivot Featured |
|
Max Buy |
WDAY
-
NYSE
Workday Inc Cl A
Computer Sftwr-Enterprse
|
$272.23
|
-6.99
-2.50% |
$278.37
|
1,184,706
73.53% of 50 DAV
50 DAV is 1,611,200
|
$307.81
-11.56%
|
9/7/2021
|
$275.69
|
PP = $282.87
|
|
MB = $297.01
|
Most Recent Note - 12/16/2021 5:54:36 PM
G - Its Relative Strength Rating has fallen to 74, below the 80+ minimum guideline for buy candidates while now sputtering below its 50 DMA line ($280). A rebound above the 50 DMA line is needed for its outlook to improve. Prior low ($258.22 on 12/06/21) and 200 DMA line ($253.70) define the next important support to watch. Reported Oct '21 quarterly earnings +28% on +20% sales revenues versus the year ago period. Fundamentals remain strong.
>>> FEATURED STOCK ARTICLE : Getting Extended From Previously Noted Base - 11/16/2021 |
View all notes |
Set NEW NOTE alert |
Company Profile |
SEC
News |
Chart |
Request a new note
C
A
S
I |
CTLT
-
NYSE
"Catalent, Inc"
DRUGS - Biotechnology
|
$126.97
|
-0.11
-0.09% |
$130.97
|
748,997
81.84% of 50 DAV
50 DAV is 915,200
|
$142.64
-10.99%
|
8/25/2021
|
$128.72
|
PP = $127.78
|
|
MB = $134.17
|
Most Recent Note - 12/15/2021 5:41:38 PM
G - Posted a solid gain today with +11% above average volume. A rebound above its 50 DMA line ($129) is still needed for its outlook to improve. Prior low ($119) and 200 DMA line ($118) define important near-term support to watch. More damaging losses would raise greater concerns. Its Relative Strength Rating is 78, below the 80+ minimum guideline for buy candidates. Fundamentals remain strong after it reported Sep '21 quarterly earnings +65% on +21% sales revenues versus the year ago period, continuing its strong earnings track record.
>>> FEATURED STOCK ARTICLE : Recent Violation of 50-Day Moving Average Triggered Sell Signal - 11/11/2021 |
View all notes |
Set NEW NOTE alert |
Company Profile |
SEC
News |
Chart |
Request a new note
C
A
S
I |
TTD
-
NASDAQ
The Trade Desk Inc Cl A
Comml Svcs-Advertising
|
$87.11
|
-4.32
-4.72% |
$92.70
|
3,503,794
65.81% of 50 DAV
50 DAV is 5,324,000
|
$114.09
-23.65%
|
11/9/2021
|
$95.16
|
PP = $90.00
|
|
MB = $94.50
|
Most Recent Note - 12/16/2021 5:50:06 PM
G - Slumped today with below average volume, raising concerns as it undercut the prior high ($90) and closed below its 50 DMA line ($88.02) both which were noted as important support to watch. Only a prompt rebound above the 50 DMA line would help its outlook improve.
>>> FEATURED STOCK ARTICLE : Powerful Volume-Driven Gains for New Highs - 11/9/2021 |
View all notes |
Set NEW NOTE alert |
Company Profile |
SEC
News |
Chart |
Request a new note
C
A
S
I |
MEDP
-
NASDAQ
Medpace Holdings Inc
Medical-Research Eqp/Svc
|
$209.60
|
-0.72
-0.34% |
$211.70
|
240,609
152.28% of 50 DAV
50 DAV is 158,000
|
$231.00
-9.26%
|
9/10/2021
|
$196.32
|
PP = $196.22
|
|
MB = $206.03
|
Most Recent Note - 12/15/2021 5:44:54 PM
G - Posted a solid gain today and rebounded above its 50 DMA line ($208.34) helping its outlook improve. Prior highs in the $199 area define important near-term support to watch. More damaging losses may trigger a worrisome technical sell signal. Recently noted repeatedly - "Sep '21 earnings rose +18% on +28% sales revenues versus the year ago period, below the +25% minimum earnings guideline (C criteria), raising fundamental concerns.
>>> FEATURED STOCK ARTICLE : Medpace Hovering at High With Volume Totals Cooling - 11/17/2021 |
View all notes |
Set NEW NOTE alert |
Company Profile |
SEC
News |
Chart |
Request a new note
C
A
S
I |
JEF
-
NYSE
Jefferies Financial Grp
Finance-Invest Bnk/Bkrs
|
$38.23
|
-0.34
-0.88% |
$39.04
|
1,216,260
81.46% of 50 DAV
50 DAV is 1,493,000
|
$44.47
-14.03%
|
6/28/2021
|
$31.81
|
PP = $34.42
|
|
MB = $36.14
|
Most Recent Note - 12/16/2021 5:38:09 PM
G - Still sputtering and in need of a rebound above the 50 DMA line ($40.85) for its outlook to improve. Reported Aug '21 quarterly earnings +40% on +20% sales revenues versus the year ago period.
>>> FEATURED STOCK ARTICLE : Volume Totals Cooling While Lingering Below 50-Day Moving Average - 12/9/2021 |
View all notes |
Set NEW NOTE alert |
Company Profile |
SEC
News |
Chart |
Request a new note
C
A
S
I |
Symbol/Exchange
Company Name
Industry Group |
PRICE |
CHANGE
(%Change) |
Day High |
Volume
(% DAV)
(% 50 day avg vol) |
52 Wk Hi
% From Hi |
Featured
Date |
Price
Featured |
Pivot Featured |
|
Max Buy |
AVTR
-
NYSE
Avantor Inc
Medical-Research Eqp/Svc
|
$39.52
|
-0.23
-0.58% |
$40.35
|
4,833,755
130.47% of 50 DAV
50 DAV is 3,705,000
|
$44.37
-10.93%
|
6/10/2021
|
$32.94
|
PP = $34.09
|
|
MB = $35.79
|
Most Recent Note - 12/15/2021 5:46:34 PM
G - Posted a solid volume-driven gain today rebounding above its 50 DMA line ($39) helping its technical stance improve. Faces overhead supply up to the $44 level. Prior lows in the high $36 area define important near-term support. Reported Sep '21 quarterly earnings +46% above the year ago period. Completed a Secondary Offering on 9/13/21.
>>> FEATURED STOCK ARTICLE : Faces Resistance While Sputtering Below 50 DMA Line - 11/12/2021 |
View all notes |
Set NEW NOTE alert |
Company Profile |
SEC
News |
Chart |
Request a new note
C
A
S
I |
MIME
-
NASDAQ
Mimecast Limited
Computer Sftwr-Security
|
$79.01
|
-0.35
-0.44% |
$79.32
|
6,033,600
533.95% of 50 DAV
50 DAV is 1,130,000
|
$85.48
-7.57%
|
10/18/2021
|
$68.17
|
PP = $71.55
|
|
MB = $75.13
|
Most Recent Note - 12/16/2021 1:11:39 PM
G - Holding its ground after a gap up on 12/07/21 M&A news. Found prompt support at its 50 DMA line ($75.45). More damaging losses would raise concerns and trigger technical sell signals.
>>> FEATURED STOCK ARTICLE : Extended From Latest Base While Fundamentals Remain Strong - 11/26/2021 |
View all notes |
Set NEW NOTE alert |
Company Profile |
SEC
News |
Chart |
Request a new note
C
A
S
I |
|
|
|
THESE ARE NOT BUY RECOMMENDATIONS!
Comments contained in the body of this report are technical
opinions only. The material herein has been obtained
from sources believed to be reliable and accurate, however,
its accuracy and completeness cannot be guaranteed.
This site is not an investment advisor, hence it does
not endorse or recommend any securities or other investments.
Any recommendation contained in this report may not
be suitable for all investors and it is not to be deemed
an offer or solicitation on our part with respect to
the purchase or sale of any securities. All trademarks,
service marks and trade names appearing in this report
are the property of their respective owners, and are
likewise used for identification purposes only.
This report is a service available
only to active Paid Premium Members.
You may opt-out of receiving report notifications
at any time. Questions or comments may be submitted
by writing to Premium Membership Services 665 S.E. 10 Street, Suite 201 Deerfield Beach, FL 33441-5634 or by calling 1-800-965-8307
or 954-785-1121.
|
|
|