***Last / Change / Volume data in this table is the closing quote data***
Symbol/Exchange
Company Name
Industry Group |
PRICE |
CHANGE
(%Change) |
Day High |
Volume
(% DAV)
(% 50 day avg vol) |
52 Wk Hi
% From Hi |
Featured
Date |
Price
Featured |
Pivot Featured |
|
Max Buy |
 SIVB
-
NASDAQ
SIVB
-
NASDAQ
S V B Financial Group
BANKING - Regional - Pacific Banks
|
$727.79
|
-17.18
-2.31% |
$740.98
|
466,257
136.73% of 50 DAV
50 DAV is 341,000
|
$763.22
-4.64%
|
8/6/2021
|
$589.70
|
PP = $608.94
|
|
MB = $639.39
|
Most Recent Note - 11/18/2021 2:57:24 PM
G - Volume totals have been cooling while hovering near its all-time high, extended from the previously noted base. Recently reported Sep '21 quarterly earnings -14% on +43% sales revenues versus the year ago period, below the +25% minimum earnings guideline (C criteria), raising fundamental concerns. Its 50 DMA line ($685) defines important near-term support to watch on pullbacks. Completed a new Public Offering on 8/11/21.
>>> FEATURED STOCK ARTICLE : Latest Quarter Raised Fundamental Concerns - 10/29/2021 |
View all notes |
Set NEW NOTE alert |
Company Profile |
SEC
News |
Chart |
Request a new note
C
A
S
I |
BLDR
-
NYSE
Builders Firstsource Inc
Bldg-Constr Prds/Misc
|
$70.24
|
-0.95
-1.33% |
$72.07
|
2,697,592
137.77% of 50 DAV
50 DAV is 1,958,000
|
$72.08
-2.55%
|
8/12/2021
|
$52.38
|
PP = $54.09
|
|
MB = $56.79
|
Most Recent Note - 11/18/2021 11:57:52 AM
G - Hitting yet another new all-time high today after stubbornly holding its ground, and it is very extended from any sound base. Bullish action came after it reported Sep '21 quarterly earnings +308% on +140% sales revenues versus the year ago period. Its 50 DMA line ($58.15) and prior highs in the $55 area define important near-term support to watch on pullbacks.
>>> FEATURED STOCK ARTICLE : Earnings News Due Thursday for High-Ranked Building Products Firm - 11/2/2021 |
View all notes |
Set NEW NOTE alert |
Company Profile |
SEC
News |
Chart |
Request a new note
C
A
S
I |
DSGX
-
NASDAQ
Descartes Systems Group
COMPUTER SOFTWARE and SERVICES - Business Software and Services
|
$89.98
|
+0.38
0.42% |
$91.22
|
100,588
110.54% of 50 DAV
50 DAV is 91,000
|
$91.39
-1.54%
|
11/18/2021
|
$90.77
|
PP = $87.56
|
|
MB = $91.94
|
Most Recent Note - 11/18/2021 5:53:42 PM
Y - There was a "negative reversal" today as it finished near the session low with a loss on above average volume after highlighted in yellow in the earlier mid-day report with pivot point cited based on its 9/23/21 high plus 10 cents. While recently wedging from a 6-week base, gains above a stock's pivot point must be backed by at least +40% above average volume to clinch a proper technical buy signal. Reported strong Oct '20, Jan, Apr, and Jul '21 quarterly earnings above the +25% minimum earnings guideline (C criteria) versus the year ago periods with acceleration in its sales revenues growth rate. Annual earnings history (A criteria) has been steady, a fair match with regard to the fact-based investment system. Completed a new Public Offering on 6/05/19. See the latest FSU analysis for more details and a new annotated graph.
>>> FEATURED STOCK ARTICLE : Reversed After Wedging to New Highs - 11/18/2021 |
View all notes |
Set NEW NOTE alert |
Company Profile |
SEC
News |
Chart |
Request a new note
C
A
S
I |
KFRC
-
NASDAQ
Kforce Inc
Comml Svcs-Staffing
|
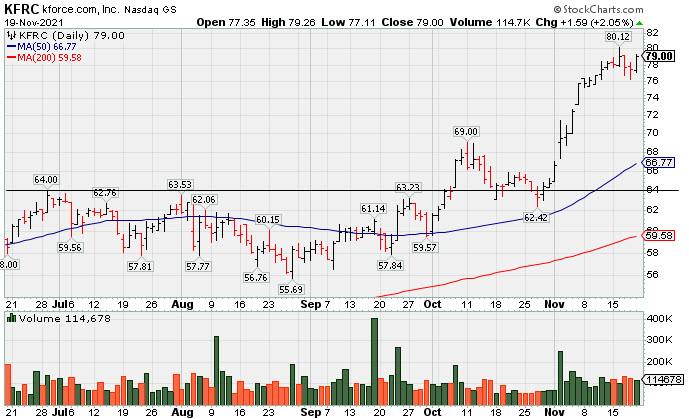
$79.00
|
+1.59
2.05% |
$79.26
|
114,678
106.18% of 50 DAV
50 DAV is 108,000
|
$80.12
-1.40%
|
9/10/2021
|
$59.53
|
PP = $64.48
|
|
MB = $67.70
|
 Most Recent Note - 11/19/2021 5:30:41 PM
G - Extended from any sound base and stubbornly holding its ground near its all-time high. Its prior high and 50 DMA line ($66.38) define important near-term support to watch on pullbacks. Recently reported Sep '21 quarterly earnings +8% on +10% sales revenues versus the year ago period, below the +25% minimum earnings guideline (C criteria), raising fundamental concerns. See the latest FSU analysis for more details and a new annotated graph.
>>> FEATURED STOCK ARTICLE : Extended From Base and Latest Quarter Earnings Growth Sub Par - 11/19/2021 |
View all notes |
Set NEW NOTE alert |
Company Profile |
SEC
News |
Chart |
Request a new note
C
A
S
I |
GNRC
-
NYSE
Generac Hldgs Inc
Electrical-Power/Equipmt
|
$434.25
|
+12.16
2.88% |
$438.93
|
747,825
115.23% of 50 DAV
50 DAV is 649,000
|
$524.31
-17.18%
|
8/30/2021
|
$449.36
|
PP = $457.10
|
|
MB = $479.96
|
Most Recent Note - 11/19/2021 5:34:02 PM
G - Posted a big gain with +14% above average volume, rebounding near its 50 DMA line ($442) which may act as resistance. Weak action came after it recently reported Sep '21 quarterly earnings +13% on +34% sales revenues versus the year ago period, below the +25% minimum earnings guideline (C criteria), raising fundamental concerns.
>>> FEATURED STOCK ARTICLE : Halted Slide at 50-Day Moving Average After Earnings News - 11/8/2021 |
View all notes |
Set NEW NOTE alert |
Company Profile |
SEC
News |
Chart |
Request a new note
C
A
S
I |
Symbol/Exchange
Company Name
Industry Group |
PRICE |
CHANGE
(%Change) |
Day High |
Volume
(% DAV)
(% 50 day avg vol) |
52 Wk Hi
% From Hi |
Featured
Date |
Price
Featured |
Pivot Featured |
|
Max Buy |
CAMT
-
NASDAQ
Camtek Ltd
ELECTRONICS - Scientific and Technical Instrum
|
$44.69
|
-0.27
-0.60% |
$45.25
|
860,112
421.62% of 50 DAV
50 DAV is 204,000
|
$49.60
-9.90%
|
11/9/2021
|
$45.43
|
PP = $46.11
|
|
MB = $48.42
|
Most Recent Note - 11/19/2021 12:47:42 PM
Y - Suffering another volume-driven loss today. Gapped down on the prior session slumping below the prior high and back into the prior base after proposing a new $140 Million note offering. Fundamentals remain strong.
>>> FEATURED STOCK ARTICLE : Rebound Above 50-Day Moving Average Helped Outlook - 11/5/2021 |
View all notes |
Set NEW NOTE alert |
Company Profile |
SEC
News |
Chart |
Request a new note
C
A
S
I |
AMD
-
NASDAQ
Advanced Micro Devices
ELECTRONICS - Semiconductor - Broad Line
|
$155.41
|
+0.39
0.25% |
$156.92
|
41,561,379
81.43% of 50 DAV
50 DAV is 51,041,000
|
$158.89
-2.19%
|
10/27/2021
|
$124.91
|
PP = $122.59
|
|
MB = $128.72
|
Most Recent Note - 11/18/2021 11:52:56 AM
G - Hitting another new all-time high with today's gain, very extended from the previously noted base. Disciplined investors avoid chasing extended stocks. Prior high in the $122 area and its 50 DMA line define support to watch on pullbacks. Fundamentals remain strong after it reported Sep '21 quarterly earnings +78% on +54% sales revenues versus the year ago period.
>>> FEATURED STOCK ARTICLE : Encountered Distributional Pressure After Reaching New High - 10/27/2021 |
View all notes |
Set NEW NOTE alert |
Company Profile |
SEC
News |
Chart |
Request a new note
C
A
S
I |
UMC
-
NYSE
United Microelectrnc Adr
ELECTRONICS - Semiconductor - Integrated Cir
|
$11.68
|
+0.20
1.74% |
$11.78
|
5,512,927
74.82% of 50 DAV
50 DAV is 7,368,000
|
$12.62
-7.45%
|
8/5/2021
|
$11.62
|
PP = $11.38
|
|
MB = $11.95
|
Most Recent Note - 11/17/2021 8:04:00 PM
G - Holding its ground above its 50 DMA line ($11.08) with volume totals cooling. Reported Sep '21 quarterly earnings +100% on +30% sales revenues versus the year ago period. Recently found support above its 200 DMA line ($10.02).
>>> FEATURED STOCK ARTICLE : Earnings News Due From Taiwan-Based Semiconductor Firm - 10/26/2021 |
View all notes |
Set NEW NOTE alert |
Company Profile |
SEC
News |
Chart |
Request a new note
C
A
S
I |
BRKS
-
NASDAQ
Brooks Automation
ELECTRONICS - Semiconductor Equipment and Mate
|
$119.53
|
-0.02
-0.02% |
$120.63
|
423,299
68.37% of 50 DAV
50 DAV is 619,100
|
$124.79
-4.22%
|
9/20/2021
|
$101.21
|
PP = $108.82
|
|
MB = $114.26
|
Most Recent Note - 11/16/2021 12:41:40 PM
G - Color code is changed to green after rallying back above its "max buy" level with today's early gain. Prior high ($110) and its 50 DMA line ($106.42) define near-term support to watch on pullbacks. Reported Sep 21 quarterly earnings +33% on +27% sales revenues versus the year ago period.
>>> FEATURED STOCK ARTICLE : 5th Quiet Gain Has Brooks Perched Near Prior Highs - 10/20/2021 |
View all notes |
Set NEW NOTE alert |
Company Profile |
SEC
News |
Chart |
Request a new note
C
A
S
I |
ENTG
-
NASDAQ
Entegris Inc
ELECTRONICS - Semiconductor Equipment and Mate
|
$154.01
|
+0.19
0.12% |
$155.55
|
764,038
88.02% of 50 DAV
50 DAV is 868,000
|
$154.91
-0.58%
|
8/4/2021
|
$125.33
|
PP = $126.51
|
|
MB = $132.84
|
Most Recent Note - 11/15/2021 4:43:32 PM
G - Perched at its all-time high with today's small gain on light volume, very extended from any sound base. Prior high ($136) and its 50 DMA line ($132.22) define near-term support to watch. Fundamentals remain strong after it recently reported Sep '21 quarterly earnings +37% on +20% sales revenues versus the year ago period.
>>> FEATURED STOCK ARTICLE : Hit New Record High With Another Volume-Driven Gain - 10/22/2021 |
View all notes |
Set NEW NOTE alert |
Company Profile |
SEC
News |
Chart |
Request a new note
C
A
S
I |
Symbol/Exchange
Company Name
Industry Group |
PRICE |
CHANGE
(%Change) |
Day High |
Volume
(% DAV)
(% 50 day avg vol) |
52 Wk Hi
% From Hi |
Featured
Date |
Price
Featured |
Pivot Featured |
|
Max Buy |
SKY
-
NYSE
Skyline Champion Corp
Bldg-Mobile/Mfg andamp; RV
|
$80.75
|
+0.01
0.01% |
$82.73
|
666,066
169.48% of 50 DAV
50 DAV is 393,000
|
$81.68
-1.14%
|
11/3/2021
|
$72.19
|
PP = $66.92
|
|
MB = $70.27
|
Most Recent Note - 11/16/2021 5:21:50 PM
G - Hit a new all-time high and finished near the session high with today's big volume-driven gain. Very extended from the previously noted flat base. Prior highs in the $66 area define initial support to watch above its 50 DMA line ($65) on pullbacks. Reported very strong Mar, Jun and Sep '21 quarterly results versus the year ago periods well above the +25% minimum earnings guideline (C criteria). Annual earnings (A criteria) history has been strong.
>>> FEATURED STOCK ARTICLE : Breakaway Gap After 10-Week Flat Base - 11/3/2021 |
View all notes |
Set NEW NOTE alert |
Company Profile |
SEC
News |
Chart |
Request a new note
C
A
S
I |
WSM
-
NYSE
Williams Sonoma Inc
RETAIL - Home Furnishing Stores
|
$215.65
|
-3.24
-1.48% |
$220.58
|
2,213,782
253.87% of 50 DAV
50 DAV is 872,000
|
$222.60
-3.12%
|
11/3/2021
|
$205.00
|
PP = $195.09
|
|
MB = $204.84
|
Most Recent Note - 11/19/2021 1:11:00 PM
G - Reported Oct '21 quarterly earnings +30% on +16% sales revenues versus the year ago period. Volume and volatility often increase near earnings news. Churning above average volume while recently hovering near its all-time high, extended from the previously noted base. Prior highs define near-term support to watch above its 50 DMA line ($189.49).
>>> FEATURED STOCK ARTICLE : Volume-Driven Gains May Signal a New Meaningful Leg Up - 11/4/2021 |
View all notes |
Set NEW NOTE alert |
Company Profile |
SEC
News |
Chart |
Request a new note
C
A
S
I |
CLFD
-
NASDAQ
Clearfield Inc
TELECOMMUNICATIONS - Cables / Satalite Equipment
|
$66.92
|
-0.46
-0.68% |
$69.23
|
87,793
77.01% of 50 DAV
50 DAV is 114,000
|
$72.00
-7.06%
|
7/23/2021
|
$40.23
|
PP = $43.74
|
|
MB = $45.93
|
Most Recent Note - 11/15/2021 12:15:10 PM
G - Reversed into the red after hitting yet another new all-time high with today's early gain. It is very extended from the previously noted base. Its 50 DMA line ($51.76) defines near-term support to watch on pullbacks. Reported Sep '21 quarterly earnings +141% on +66% sales revenues above the year ago period.
>>> FEATURED STOCK ARTICLE : Extended From Prior Base After Latest Rally - 10/18/2021 |
View all notes |
Set NEW NOTE alert |
Company Profile |
SEC
News |
Chart |
Request a new note
C
A
S
I |
TGH
-
NYSE
Textainer Group Holdings
TRANSPORTATION - Logistics
|
$35.17
|
-1.38
-3.78% |
$36.17
|
794,706
164.20% of 50 DAV
50 DAV is 484,000
|
$41.24
-14.72%
|
10/7/2021
|
$36.97
|
PP = $36.80
|
|
MB = $38.64
|
Most Recent Note - 11/19/2021 1:03:13 PM
G - Color code is changed to green with today's loss undercutting its 50 DMA line ($36.50) raising concerns and triggering a technical sell signal. Only a prompt rebound above the 50 DMA line would help its outlook to improve. Fundamentals remain strong.
>>> FEATURED STOCK ARTICLE : Pulling Back Below "Max Buy" Level With Lighter Volume - 11/10/2021 |
View all notes |
Set NEW NOTE alert |
Company Profile |
SEC
News |
Chart |
Request a new note
C
A
S
I |
ENPH
-
NASDAQ
Enphase Energy Inc
Energy-Solar
|
$267.74
|
+13.26
5.21% |
$272.00
|
2,709,779
115.80% of 50 DAV
50 DAV is 2,340,000
|
$260.56
2.76%
|
10/28/2021
|
$218.00
|
PP = $229.14
|
|
MB = $240.60
|
Most Recent Note - 11/19/2021 5:32:14 PM
G - Powered to a new all-time high with today's gain on +15% above average volume, getting more extended from the previously noted base. Prior high ($229) defines initial support to watch on pullbacks.
>>> FEATURED STOCK ARTICLE : Enphase is Challenging its All-Time High With Volume-Driven Gains - 10/28/2021 |
View all notes |
Set NEW NOTE alert |
Company Profile |
SEC
News |
Chart |
Request a new note
C
A
S
I |
Symbol/Exchange
Company Name
Industry Group |
PRICE |
CHANGE
(%Change) |
Day High |
Volume
(% DAV)
(% 50 day avg vol) |
52 Wk Hi
% From Hi |
Featured
Date |
Price
Featured |
Pivot Featured |
|
Max Buy |
SMPL
-
NASDAQ
Simply Good Foods Co
Food-Confectionery
|
$39.01
|
-0.37
-0.94% |
$39.48
|
319,828
85.98% of 50 DAV
50 DAV is 372,000
|
$41.35
-5.66%
|
10/25/2021
|
$38.30
|
PP = $38.60
|
|
MB = $40.53
|
Most Recent Note - 11/15/2021 4:26:03 PM
Y - Still quietly consolidating above prior highs and below its "max buy" level. Prior highs in the $38 area define initial support to watch above its 50 DMA line ($36.61).
>>> FEATURED STOCK ARTICLE : Consolidating Above Prior High Following Recent Technical Breakout - 11/15/2021 |
View all notes |
Set NEW NOTE alert |
Company Profile |
SEC
News |
Chart |
Request a new note
C
A
S
I |
WDAY
-
NASDAQ
Workday Inc Cl A
Computer Sftwr-Enterprse
|
$286.60
|
-12.49
-4.18% |
$297.50
|
6,688,700
474.38% of 50 DAV
50 DAV is 1,410,000
|
$307.81
-6.89%
|
9/7/2021
|
$275.69
|
PP = $282.87
|
|
MB = $297.01
|
Most Recent Note - 11/19/2021 1:09:27 PM
Y - Color code is changed to yellow after pulling back below its "max buy" level with today's 2nd volume-driven loss off its record high. Reported Oct '21 quarterly earnings +28% on +20% sales revenues versus the year ago period. Volume and volatility often increase near earnings news. Prior highs in the $278-282 area define initial support above its 50 DMA line ($275) where any violations would raise concerns. Fundamentals remain strong.
>>> FEATURED STOCK ARTICLE : Getting Extended From Previously Noted Base - 11/16/2021 |
View all notes |
Set NEW NOTE alert |
Company Profile |
SEC
News |
Chart |
Request a new note
C
A
S
I |
CTLT
-
NYSE
"Catalent, Inc"
DRUGS - Biotechnology
|
$127.11
|
-0.92
-0.72% |
$129.62
|
982,667
108.91% of 50 DAV
50 DAV is 902,300
|
$142.64
-10.89%
|
8/25/2021
|
$128.72
|
PP = $127.78
|
|
MB = $134.17
|
Most Recent Note - 11/17/2021 12:25:00 PM
G - The 50 DMA line ($132.63) may act as resistance while it is on track today for a 5th consecutive gain. Its Relative Strength Rating is 73, still below the 80+ minimum guideline for buy candidates. Halted its slide above its 200 DMA line ($117.40). More damaging losses would raise greater concerns. Fundamentals remain strong after it reported Sep '21 quarterly earnings +65% on +21% sales revenues versus the year ago period, continuing its strong earnings track record.
>>> FEATURED STOCK ARTICLE : Recent Violation of 50-Day Moving Average Triggered Sell Signal - 11/11/2021 |
View all notes |
Set NEW NOTE alert |
Company Profile |
SEC
News |
Chart |
Request a new note
C
A
S
I |
TTD
-
NASDAQ
The Trade Desk Inc Cl A
Comml Svcs-Advertising
|
$107.79
|
+2.32
2.20% |
$110.63
|
4,354,381
88.45% of 50 DAV
50 DAV is 4,923,000
|
$114.09
-5.52%
|
11/9/2021
|
$95.16
|
PP = $90.00
|
|
MB = $94.50
|
Most Recent Note - 11/18/2021 2:46:13 PM
G - Pulling back with lighter volume after a spurt of volume-driven gains left it very extended from the previously noted 9-month cup-with-handle shaped base. Prior highs define initial support to watch.
>>> FEATURED STOCK ARTICLE : Powerful Volume-Driven Gains for New Highs - 11/9/2021 |
View all notes |
Set NEW NOTE alert |
Company Profile |
SEC
News |
Chart |
Request a new note
C
A
S
I |
MEDP
-
NASDAQ
Medpace Holdings Inc
Medical-Research Eqp/Svc
|
$227.01
|
+0.74
0.33% |
$231.00
|
150,576
85.55% of 50 DAV
50 DAV is 176,000
|
$229.49
-1.08%
|
9/10/2021
|
$196.32
|
PP = $196.22
|
|
MB = $206.03
|
Most Recent Note - 11/17/2021 8:02:37 PM
G - Volume totals have still been cooling while stubbornly holding its ground near its 52-week high. Recent bullish action came even after it reported Sep '21 earnings +18% on +28% sales revenues versus the year ago period, below the +25% minimum earnings guideline (C criteria), raising fundamental concerns. Prior highs in the $199 area define important near-term support coinciding with its 50 DMA line. See the latest FSU analysis for more details and a new annotated graph.
>>> FEATURED STOCK ARTICLE : Medpace Hovering at High With Volume Totals Cooling - 11/17/2021 |
View all notes |
Set NEW NOTE alert |
Company Profile |
SEC
News |
Chart |
Request a new note
C
A
S
I |
Symbol/Exchange
Company Name
Industry Group |
PRICE |
CHANGE
(%Change) |
Day High |
Volume
(% DAV)
(% 50 day avg vol) |
52 Wk Hi
% From Hi |
Featured
Date |
Price
Featured |
Pivot Featured |
|
Max Buy |
JEF
-
NYSE
Jefferies Financial Grp
Finance-Invest Bnk/Bkrs
|
$39.59
|
-0.59
-1.47% |
$39.95
|
1,480,161
81.46% of 50 DAV
50 DAV is 1,817,000
|
$44.47
-10.97%
|
6/28/2021
|
$31.81
|
PP = $34.42
|
|
MB = $36.14
|
Most Recent Note - 11/16/2021 5:19:35 PM
G - Gapped down today for a 3rd consecutive loss. Encountering distributional pressure in recent weeks while hovering near its all-time high. Its 50 DMA line ($40.09) defines important near-term support to watch on pullbacks. Reported Aug '21 quarterly earnings +40% on +20% sales revenues versus the year ago period.
>>> FEATURED STOCK ARTICLE : Extended From Prior Highs and Stubbornly Holding Ground - 11/1/2021 |
View all notes |
Set NEW NOTE alert |
Company Profile |
SEC
News |
Chart |
Request a new note
C
A
S
I |
AVTR
-
NYSE
Avantor Inc
Medical-Research Eqp/Svc
|
$39.66
|
+0.38
0.97% |
$39.98
|
3,084,053
69.57% of 50 DAV
50 DAV is 4,433,000
|
$44.37
-10.62%
|
6/10/2021
|
$32.94
|
PP = $34.09
|
|
MB = $35.79
|
Most Recent Note - 11/18/2021 2:50:53 PM
G - Still sputtering and meeting resistance at its 50 DMA line ($40). A rebound above the 50 DMA line is needed for its outlook to improve, and it faces overhead supply up to the $44 level. Reported Sep '21 quarterly earnings +46% above the year ago period. Completed a Secondary Offering on 9/13/21.
>>> FEATURED STOCK ARTICLE : Faces Resistance While Sputtering Below 50 DMA Line - 11/12/2021 |
View all notes |
Set NEW NOTE alert |
Company Profile |
SEC
News |
Chart |
Request a new note
C
A
S
I |
MIME
-
NASDAQ
Mimecast Limited
Computer Sftwr-Security
|
$83.20
|
-0.46
-0.55% |
$84.99
|
440,695
77.45% of 50 DAV
50 DAV is 569,000
|
$85.48
-2.67%
|
10/18/2021
|
$68.17
|
PP = $71.55
|
|
MB = $75.13
|
Most Recent Note - 11/18/2021 2:56:29 PM
G - Reversed into the red after hitting another new all-time high today following 5 consecutive gains. Very extended from the previously noted base. Prior highs in the $71 area define initial support above its 50 DMA line ($70.59).
>>> FEATURED STOCK ARTICLE : MIME Consolidating Less Than 4% Off High Building New Base - 10/21/2021 |
View all notes |
Set NEW NOTE alert |
Company Profile |
SEC
News |
Chart |
Request a new note
C
A
S
I |
ZD
-
NASDAQ
Ziff Davis Inc
Internet-Content
|
$121.08
|
-0.76
-0.62% |
$124.59
|
284,108
66.69% of 50 DAV
50 DAV is 426,000
|
$135.00
-10.31%
|
10/25/2021
|
$126.07
|
PP = $128.19
|
|
MB = $134.60
|
Most Recent Note - 11/18/2021 2:42:53 PM
G - Color code is changed to green while slumping below its 50 DMA line ($122.91) with today's 5th consecutive loss raising concerns. Only a prompt rebound above the 50 DMA line would help its outlook improve. Quarterly and annual earnings (C and A criteria) history has been strong.
>>> FEATURED STOCK ARTICLE : Internet Content Firm Perched Near Prior High - 10/25/2021 |
View all notes |
Set NEW NOTE alert |
Company Profile |
SEC
News |
Chart |
Request a new note
C
A
S
I |