You are not logged in.
This means you
CAN ONLY VIEW reports that were published prior to Tuesday, April 8, 2025.
You
MUST UPGRADE YOUR MEMBERSHIP if you want to see any current reports.
AFTER MARKET UPDATE - TUESDAY, DECEMBER 21ST, 2021
Previous After Market Report Next After Market Report >>>
|
|
|
|
DOW |
+560.54 |
35,492.70 |
+1.60% |
|
Volume |
960,805,576 |
-13% |
|
Volume |
4,509,037,700 |
-0% |
|
NASDAQ |
+360.14 |
15,341.09 |
+2.40% |
|
Advancers |
2,678 |
82% |
|
Advancers |
3,363 |
74% |
|
S&P 500 |
+81.21 |
4,649.23 |
+1.78% |
|
Decliners |
591 |
18% |
|
Decliners |
1,152 |
26% |
|
Russell 2000 |
+63.07 |
2,202.95 |
+2.95% |
|
52 Wk Highs |
43 |
|
|
52 Wk Highs |
42 |
|
|
S&P 600 |
+38.97 |
1,363.85 |
+2.94% |
|
52 Wk Lows |
61 |
|
|
52 Wk Lows |
168 |
|
|
Leadership has been very thin as a notedly brief new rally has been followed by additional pressure. Great caution is advised until an additional follow-through day establishes a solidly reconfirmed uptrend again for the market (M criteria).
|
 |
Breadth Positive as Indices Rebounded From Recent Damage
Kenneth J. Gruneisen - Passed the CAN SLIM® Master's Exam
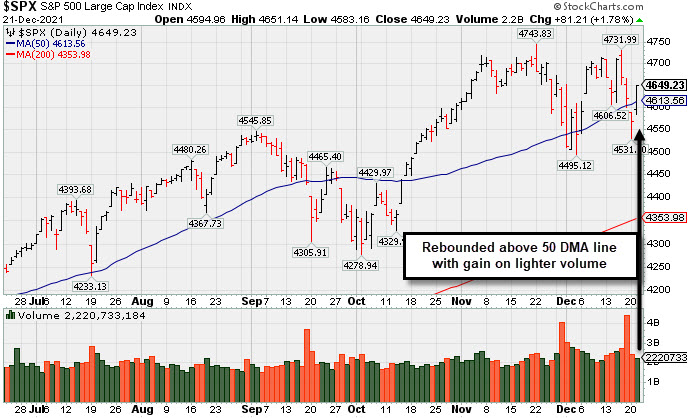
The broad benchmark S&P 500 Index advanced 1.8%, recouping all of Monday’s decline. The Dow climbed 560 points, while the Nasdaq Composite rallied 2.4%. The small-cap Russell 2000 gained 2.7%. The volume totals reported were lighter than the prior session on the NYSE and on the Nasdaq exchange. Breadth was clearly positive as advancers led decliners by almost a 5-1 margin on the NYSE and by a 3-1 margin on the Nasdaq exchange. Leadership improved as there were 20 high-ranked companies from the Leaders List that hit new 52-week highs and were listed on the BreakOuts Page, versus the total of 3 on the prior session. New 52-week highs were still outnumbered by new 52-week lows on the NYSE and on the Nasdaq exchange. Weak action for the market averages (M criteria) put great pressure immediately on the brief new rally. New buying efforts are to be carefully made under the fact-based investment system's strict criteria.
 PICTURED: The S&P 500 Index posted a gain with lighter volume and rebounded above its 50-day moving average on Tuesday. The weak action of its prior 3 losses did not undercut its prior low, technically keeping the latest brief rally alive, however, caution may still be advised. No rally is sustainable without a healthy crop of stocks leading the way and hitting new 52-week highs, so it will be very important in the near term to see an expansion and further technical improvements.
U.S. stocks rebounded on Tuesday as Wall Street looked to recover from the S&P 500’s biggest three-day drawdown since September (-3%). Risk sentiment was buoyed amid reports that a version of the Biden Administration’s Build Back Better social spending plan could still be negotiated on Capitol Hill. Additionally, President Biden encouraged wide-spreading testing as a new strategy to curb the impact of the Omicron coronavirus variant, instead of lockdowns deployed early in the pandemic.
Nine of 11 S&P 500 sectors finished in positive territory, with Energy and Technology stocks pacing the gain. Chipmakers provided a tailwind, with Micron Technology Inc. (MU +10.54%) gapped up as strong demand for its memory chips drove bullish forecasts. Consumer Staples lagged with General Mills Inc. (GIS - 4.03%) fell after missing Wall Street’s profit expectations. In other earnings, Nike Inc. (NKE +6.15%) rose after robust profit and sales figures overshadowed ongoing supply chain issues. Elsewhere, reports indicated the U.S. Food and Drug Administration (FDA) could provide authorization for the Pfizer Inc. (PFE -3.39%) and Merck & Co. (MRK -1.14%) COVID-19 treatment pills both sometime this week.
Treasuries weakened, with the yield on the 10-year note up five basis points (0.05%) to 1.47%. On the data front, the U.S. current account deficit widened more than anticipated in the third quarter to reflect a $214.8 billion shortfall, the largest gap since 2006. In commodities, WTI crude rebounded 4.2% to $71.47/barrel after yesterday suffering its biggest one-day drop of the month (-3.7%). |
 Kenneth J. Gruneisen started out as a licensed stockbroker in August 1987, a couple of months prior to the historic stock market crash that took the Dow Jones Industrial Average down -22.6% in a single day. He has published daily fact-based fundamental and technical analysis on high-ranked stocks online for two decades. Through FACTBASEDINVESTING.COM, Kenneth provides educational articles, news, market commentary, and other information regarding proven investment systems that work in good times and bad.
Comments contained in the body of this report are technical opinions only and are not necessarily those of Gruneisen Growth Corp. The material herein has been obtained from sources believed to be reliable and accurate, however, its accuracy and completeness cannot be guaranteed. Our firm, employees, and customers may effect transactions, including transactions contrary to any recommendation herein, or have positions in the securities mentioned herein or options with respect thereto. Any recommendation contained in this report may not be suitable for all investors and it is not to be deemed an offer or solicitation on our part with respect to the purchase or sale of any securities. |
|
 |
Energy, Financial, Tech and Retail Indexes Led Group Gainers
Kenneth J. Gruneisen - Passed the CAN SLIM® Master's Exam
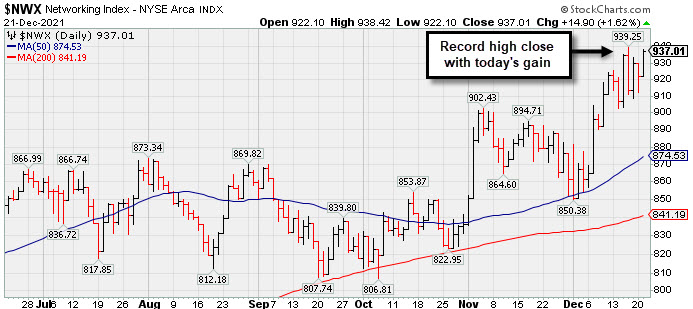
The Broker/Dealer Index ($XBD +2.68%) and Bank Index ($BKX +2.65%) both posted solid gains and the Retail Index ($RLX +1.45%) also was a positive influence on the major averages. The Oil Services Index ($OSX +5.20%) and Integrated Oil Index ($XOI +3.50%) both posted standout gains. The Gold & Silver Index ($XAU +1.27%) posted a smaller gain. The Semiconductor Index ($SOX +3.35%) led the tech sector's bounce while the Networking Index ($NWX +1.62%) also posted a solid gain, but the Biotech Index ($BTK -0.01%) finished flat.
PICTURED: The Networking Index ($NWX +1.62%) found support at its 50-day moving average (DMA) line and has rallied to a new record high close.
| Oil Services |
$OSX |
52.84 |
+2.61 |
+5.20% |
+19.21% |
| Integrated Oil |
$XOI |
1,159.90 |
+39.24 |
+3.50% |
+46.36% |
| Semiconductor |
$SOX |
3,857.30 |
+124.91 |
+3.35% |
+37.98% |
| Networking |
$NWX |
937.01 |
+14.90 |
+1.62% |
+30.66% |
| Broker/Dealer |
$XBD |
479.68 |
+12.54 |
+2.68% |
+27.03% |
| Retail |
$RLX |
4,183.29 |
+59.79 |
+1.45% |
+17.40% |
| Gold & Silver |
$XAU |
127.98 |
+1.60 |
+1.27% |
-11.24% |
| Bank |
$BKX |
130.06 |
+3.36 |
+2.65% |
+32.84% |
| Biotech |
$BTK |
5,584.54 |
-0.66 |
-0.01% |
-2.69% |
|
|
|
 |
Rebounding With Volume-Driven Gains
Kenneth J. Gruneisen - Passed the CAN SLIM® Master's Exam
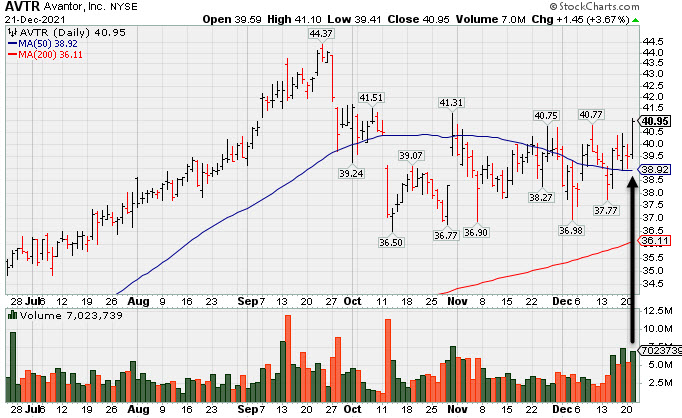
Avantor Inc (AVTR +$1.45 or +3.67% to $40.95) posted a 3rd solid volume-driven gain in the span of 5 sessions, rebounding further above its 50-day moving average (DMA) line ($39) helping its technical stance improve. It still faces resistance due to overhead supply up to the $44 level. Prior lows in the high $36 area define important near-term support.
It has an Earnings Per Share Rating of 97 based on strong fundamentals. The Sep '21 quarter marked its 5th consecutive quarterly comparison with earnings above the year ago period by at least the +25% minimum guideline (C criteria). Annual earnings growth has been strong (A criteria). Bullish action came after it reported Sep '21 quarterly earnings +46% above the year ago period.
AVTR traded up as much as +34.7% since highlighted in the 6/10/21 mid-day report (read here) yellow with pivot point cited based on its 4/29/21 high plus 10 cents. It completed a Secondary Offering on 9/13/21. It was last shown in this FSU section on 11/12/21 with an annotated graph included with additional analysis under the headline, "Faces Resistance While Sputtering Below 50 DMA Line".
Following its $14 IPO on 5/17/19 it completed Secondary Offerings on 5/21/20, 8/21/20 and 11/09/20. The high-ranked Medical-Research Eqp/Svc firm has seen the number of top-rated funds owning its shares rise from 562 in Jun '20 to 1,234 in Sep '21 a reassuring sign concerning the I criteria. Its current Up/Down Volume ratio of 1.0 is an unbiased indication its shares have been neutral concerning accumulation/distribution over the past 50 days. It has a Timeliness Rating of B and a Sponsorship Rating of B.
|
|
|
Color Codes Explained :
Y - Better candidates highlighted by our
staff of experts.
G - Previously featured
in past reports as yellow but may no longer be buyable under the
guidelines.
***Last / Change / Volume data in this table is the closing quote data***
Symbol/Exchange
Company Name
Industry Group |
PRICE |
CHANGE
(%Change) |
Day High |
Volume
(% DAV)
(% 50 day avg vol) |
52 Wk Hi
% From Hi |
Featured
Date |
Price
Featured |
Pivot Featured |
|
Max Buy |
 BLDR
-
NYSE
BLDR
-
NYSE
Builders Firstsource Inc
Bldg-Constr Prds/Misc
|
$78.69
|
+3.56
4.74% |
$78.69
|
2,772,527
111.62% of 50 DAV
50 DAV is 2,484,000
|
$80.95
-2.79%
|
8/12/2021
|
$52.38
|
PP = $54.09
|
|
MB = $56.79
|
 Most Recent Note - 12/21/2021 5:58:51 PM
G - Posted a solid gain today after stubbornly holding its ground near its all-time high. Very extended from any sound base. Reported Sep '21 quarterly earnings +308% on +140% sales revenues versus the year ago period. It is well above its 50 DMA line ($67.44) which defines near-term support to watch.
>>> FEATURED STOCK ARTICLE : Perched at Record High After +52% Rally in 4 Months - 12/10/2021 |
View all notes |
Set NEW NOTE alert |
Company Profile |
SEC
News |
Chart |
Request a new note
C
A
S
I |
KFRC
-
NASDAQ
Kforce Inc
Comml Svcs-Staffing
|
$73.86
|
+0.23
0.31% |
$75.00
|
85,077
76.65% of 50 DAV
50 DAV is 111,000
|
$81.47
-9.34%
|
9/10/2021
|
$59.53
|
PP = $64.48
|
|
MB = $67.70
|
Most Recent Note - 12/21/2021 6:06:19 PM
G - Prior low ($71.05 on 12/14/21) defines important near-term support after finding prompt support at its 50 DMA line ($72.25). Recently reported Sep '21 quarterly earnings +8% on +10% sales revenues versus the year ago period, below the +25% minimum earnings guideline (C criteria), raising fundamental concerns.
>>> FEATURED STOCK ARTICLE : Extended From Base and Latest Quarter Earnings Growth Sub Par - 11/19/2021 |
View all notes |
Set NEW NOTE alert |
Company Profile |
SEC
News |
Chart |
Request a new note
C
A
S
I |
REGN
-
NASDAQ
Regeneron Pharmaceutical
DRUGS - Biotechnology
|
$606.81
|
+3.67
0.61% |
$608.58
|
1,100,328
137.59% of 50 DAV
50 DAV is 799,700
|
$686.62
-11.62%
|
12/13/2021
|
$647.95
|
PP = $686.72
|
|
MB = $721.06
|
Most Recent Note - 12/16/2021 5:40:30 PM
Y - Suffered a big loss today with +61% above average volume raising concerns. Color code was recently changed to yellow with new pivot point cited based on its 9/01/21 high plus 10 cents. Subsequent gains above the pivot point backed by at least +40% above average volume may trigger a technical buy signal. Its Relative Strength rating has slumped to 84, but it is still above the 80+ minimum guideline for buy candidates.
>>> FEATURED STOCK ARTICLE : Consolidating Near All-Time High With Little Resistance Remaining - 12/13/2021 |
View all notes |
Set NEW NOTE alert |
Company Profile |
SEC
News |
Chart |
Request a new note
C
A
S
I |
LLY
-
NYSE
Eli Lilly & Co
Medical-Diversified
|
$264.88
|
+1.40
0.53% |
$265.95
|
2,682,640
84.95% of 50 DAV
50 DAV is 3,158,000
|
$283.91
-6.70%
|
12/16/2021
|
$279.28
|
PP = $275.97
|
|
MB = $289.77
|
Most Recent Note - 12/21/2021 6:07:42 PM
Y - Posted a quiet gain today after retreating from its all-time high. Finished strong after highlighted in yellow in the 12/16/21 mid-day report with pivot point cited based on its 8/17/21 high plus 10 cents. This giant Medical - Diversified firm triggered a technical buy signal as it powered to new all-time highs with +78% above average volume behind its 5th consecutive gain after a choppy 17-week consolidation. Reported Sep '21 quarterly earnings +38% on +18% sales revenues versus the year ago period, and 3 of the past 4 quarterly comparisons were above the +25% minimum earnings guideline (C criteria). Annual earnings (A criteria) improved steadily since a downturn in FY '14.
>>> FEATURED STOCK ARTICLE : Eli Lilly & Co Powered to New Highs With Volume - 12/16/2021 |
View all notes |
Set NEW NOTE alert |
Company Profile |
SEC
News |
Chart |
Request a new note
C
A
S
I |
CAMT
-
NASDAQ
Camtek Ltd
ELECTRONICS - Scientific and Technical Instrum
|
$42.46
|
+1.53
3.74% |
$42.78
|
151,163
58.36% of 50 DAV
50 DAV is 259,000
|
$49.60
-14.40%
|
11/9/2021
|
$45.43
|
PP = $46.11
|
|
MB = $48.42
|
Most Recent Note - 12/16/2021 5:46:54 PM
G - Reversed abruptly and slumped back below its DMA line ($42.57) today with lighter volume. Faces resistance due to overhead supply up to the $49 level. Fundamentals remain strong.
>>> FEATURED STOCK ARTICLE : Closed Above 50-Day Average After Big Gain With Light Volume - 12/15/2021 |
View all notes |
Set NEW NOTE alert |
Company Profile |
SEC
News |
Chart |
Request a new note
C
A
S
I |
Symbol/Exchange
Company Name
Industry Group |
PRICE |
CHANGE
(%Change) |
Day High |
Volume
(% DAV)
(% 50 day avg vol) |
52 Wk Hi
% From Hi |
Featured
Date |
Price
Featured |
Pivot Featured |
|
Max Buy |
AMD
-
NASDAQ
Advanced Micro Devices
ELECTRONICS - Semiconductor - Broad Line
|
$144.25
|
+8.45
6.22% |
$144.50
|
57,307,798
100.79% of 50 DAV
50 DAV is 56,857,000
|
$164.46
-12.29%
|
10/27/2021
|
$124.91
|
PP = $122.59
|
|
MB = $128.72
|
Most Recent Note - 12/21/2021 5:57:32 PM
G - Posted a big gain today with average volume as it rallied off of Its 50 DMA line ($136.87). The prior low ($130.60 on 12/14/21) defines the next important near term support where a violations may trigger a more worrisome technical sell signal. Fundamentals remain strong after it reported Sep '21 quarterly earnings +78% on +54% sales revenues versus the year ago period.
>>> FEATURED STOCK ARTICLE : AMD Pulling Back After Considerable Rally - 12/1/2021 |
View all notes |
Set NEW NOTE alert |
Company Profile |
SEC
News |
Chart |
Request a new note
C
A
S
I |
UMC
-
NYSE
United Microelectrnc Adr
ELECTRONICS - Semiconductor - Integrated Cir
|
$11.42
|
+0.49
4.48% |
$11.43
|
5,769,461
71.12% of 50 DAV
50 DAV is 8,112,000
|
$12.68
-9.94%
|
12/1/2021
|
$12.60
|
PP = $12.72
|
|
MB = $13.36
|
Most Recent Note - 12/21/2021 6:02:20 PM
Y - Posted a gain today with lighter volume. Recently retesting support near its 50 DMA line ($11.09). More damaging losses would raise concerns. A gain and solid close above the pivot point may help clinch a proper new (or add-on) technical buy signal. Reported Sep '21 quarterly earnings +100% on +30% sales revenues versus the year ago period.
>>> FEATURED STOCK ARTICLE : Rebound Above 50-Day Moving Average Showed Resilience - 11/30/2021 |
View all notes |
Set NEW NOTE alert |
Company Profile |
SEC
News |
Chart |
Request a new note
C
A
S
I |
ENTG
-
NASDAQ
Entegris Inc
ELECTRONICS - Semiconductor Equipment and Mate
|
$132.96
|
+3.12
2.40% |
$133.33
|
1,371,388
118.43% of 50 DAV
50 DAV is 1,158,000
|
$158.00
-15.85%
|
8/4/2021
|
$125.33
|
PP = $126.51
|
|
MB = $132.84
|
Most Recent Note - 12/16/2021 5:45:11 PM
G - Suffered another damaging loss today with above average volume and finished weak, violating its 50 DMA line ($142) and triggering a technical sell signal. A rebound above the 50 DMA line is needed for its outlook to improve. Fundamentals remain strong after it recently reported Sep '21 quarterly earnings +37% on +20% sales revenues versus the year ago period.
>>> FEATURED STOCK ARTICLE : Best Ever Close After Volume-Driven Gain - 11/29/2021 |
View all notes |
Set NEW NOTE alert |
Company Profile |
SEC
News |
Chart |
Request a new note
C
A
S
I |
DHR
-
NYSE
Danaher Corp
Medical-Diversified
|
$313.92
|
-0.37
-0.12% |
$316.12
|
2,166,847
80.79% of 50 DAV
50 DAV is 2,682,000
|
$333.96
-6.00%
|
12/16/2021
|
$321.36
|
PP = $334.06
|
|
MB = $350.76
|
Most Recent Note - 12/17/2021 5:34:56 PM
Y - Pulled back today with heavy volume, consolidating above its 50 DMA line and perched within striking distance of its 52-week high. Highlighted in yellow with pivot point cited base on its 9/10/21 high plus 10 cents in the 12/16/21 mid-day report. Subsequent gains above the pivot point with at least +40% above average volume may trigger a technical buy signal. Reported Sep '21 quarterly earnings +39% on +23% sales revenues versus the year ago period, its 6th strong comparison above the +25% minimum guideline (C criteria) and sales revenues growth has been strong. Annual earnings (A criteria) history has shown slow steady growth. Has a new CEO as of 9/01/20. See the latest FSU analysis for more details and a new annotated graph.
>>> FEATURED STOCK ARTICLE : Consolidating Near Prior Highs Above 50-Day Moving Average - 12/17/2021 |
View all notes |
Set NEW NOTE alert |
Company Profile |
SEC
News |
Chart |
Request a new note
C
A
S
I |
SKY
-
NYSE
Skyline Champion Corp
Bldg-Mobile/Mfg andamp; RV
|
$73.24
|
+3.20
4.57% |
$73.79
|
697,734
148.77% of 50 DAV
50 DAV is 469,000
|
$85.92
-14.76%
|
11/3/2021
|
$72.19
|
PP = $66.92
|
|
MB = $70.27
|
Most Recent Note - 12/21/2021 6:04:07 PM
G - Today's big gain and prompt rebound above the 50 DMA line ($73) helped its outlook improve after 6 consecutive damaging volume-driven losses. The next important near-term support to watch is prior highs in the $66 area. Fundamentals remain strong.
>>> FEATURED STOCK ARTICLE : Pulling Back From All-Time High After Recent Rally - 12/14/2021 |
View all notes |
Set NEW NOTE alert |
Company Profile |
SEC
News |
Chart |
Request a new note
C
A
S
I |
Symbol/Exchange
Company Name
Industry Group |
PRICE |
CHANGE
(%Change) |
Day High |
Volume
(% DAV)
(% 50 day avg vol) |
52 Wk Hi
% From Hi |
Featured
Date |
Price
Featured |
Pivot Featured |
|
Max Buy |
DHI
-
NYSE
D R Horton Inc
MATERIALS and CONSTRUCTION - Residential Construction
|
$103.49
|
+2.11
2.08% |
$103.57
|
1,836,659
66.02% of 50 DAV
50 DAV is 2,782,000
|
$110.45
-6.30%
|
12/6/2021
|
$104.40
|
PP = $106.99
|
|
MB = $112.34
|
Most Recent Note - 12/16/2021 12:35:58 PM
Y - Posted a solid gain with +156% above average volume and closed above its pivot point on the prior session clinching a technical buy signal. Highlighted in yellow with pivot point cited based on its 5/10/21 high plus 10 cents in the 12/06/21 mid-day report. Reported Sep '21 earnings +68% on +27% sales revenues versus the year-ago period, its 8th strong quarterly comparison above the +25% minimum guideline (C criteria). Annual earnings growth (A criteria) has been strong. The market is in an uptrend (M criteria) and allows for new buying after Wednesday's bullish action confirmed the rally with a follow-through day.
>>> FEATURED STOCK ARTICLE : Builder Built a Solid Base And Challenged Prior High - 12/6/2021 |
View all notes |
Set NEW NOTE alert |
Company Profile |
SEC
News |
Chart |
Request a new note
C
A
S
I |
TITN
-
NASDAQ
Titan Machinery Inc
SPECIALTY RETAIL
|
$31.80
|
+0.60
1.92% |
$32.15
|
164,991
95.93% of 50 DAV
50 DAV is 172,000
|
$38.58
-17.57%
|
11/23/2021
|
$36.22
|
PP = $35.34
|
|
MB = $37.11
|
Most Recent Note - 12/20/2021 12:01:21 PM
G - Gapped down today violating its 50 DMA line ($31.25) with a 3rd consecutive volume-driven loss triggering a technical sell signal. Only a prompt rebound above the 50 DMA line would help its outlook improve. Reported Oct '21 quarterly earnings +81% on +26% sales revenues over the year ago period, its 4th strong quarterly comparison.
>>> FEATURED STOCK ARTICLE : Strong Close With Gain Backed by +467% Above Average Volume - 11/23/2021 |
View all notes |
Set NEW NOTE alert |
Company Profile |
SEC
News |
Chart |
Request a new note
C
A
S
I |
CLFD
-
NASDAQ
Clearfield Inc
TELECOMMUNICATIONS - Cables / Satalite Equipment
|
$75.82
|
+5.06
7.15% |
$76.07
|
227,520
175.02% of 50 DAV
50 DAV is 130,000
|
$75.87
-0.07%
|
12/16/2021
|
$72.76
|
PP = $72.10
|
|
MB = $75.71
|
Most Recent Note - 12/21/2021 12:29:25 PM
Y - Perched near its all-time high with today's 3rd consecutive gain after recently trading in a wider range intra-day. Color code was changed to yellow with new pivot point cited based on its 11/15/21 high plus 10 cents. Recently formed a "square box" base as it found support well above its 50 DMA line ($62.06) when consolidating. A gain and close above the pivot point backed by at least +40% above average volume may trigger a new (or add-on) technical buy signal. Reported Sep '21 quarterly earnings +141% on +66% sales revenues above the year ago period.
>>> FEATURED STOCK ARTICLE : Perched Near High Extended From Any Sound Base - 11/22/2021 |
View all notes |
Set NEW NOTE alert |
Company Profile |
SEC
News |
Chart |
Request a new note
C
A
S
I |
ODFL
-
NASDAQ
Old Dominion Fght Line
TRANSPORTATION - Trucking
|
$339.44
|
+5.59
1.67% |
$339.89
|
544,079
88.90% of 50 DAV
50 DAV is 612,000
|
$373.58
-9.14%
|
12/7/2021
|
$365.61
|
PP = $364.17
|
|
MB = $382.38
|
Most Recent Note - 12/20/2021 12:04:24 PM
G - Violated its 50 DMA line ($340) with today's loss triggering a technical sell signal and its color code is changed to green. Only a prompt rebound above the 50 DMA line would help its outlook improve.
>>> FEATURED STOCK ARTICLE : Perched at All Time High After Tight Consolidation Several Weeks - 12/7/2021 |
View all notes |
Set NEW NOTE alert |
Company Profile |
SEC
News |
Chart |
Request a new note
C
A
S
I |
SMPL
-
NASDAQ
Simply Good Foods Co
Food-Confectionery
|
$39.71
|
+1.14
2.96% |
$40.04
|
535,768
126.96% of 50 DAV
50 DAV is 422,000
|
$41.35
-3.97%
|
10/25/2021
|
$38.30
|
PP = $38.60
|
|
MB = $40.53
|
Most Recent Note - 12/20/2021 1:01:10 PM
G - Consolidating above its 50 DMA line ($38.04). The prior low and 200 DMA line ($35.54) define the next important support.
>>> FEATURED STOCK ARTICLE : Consolidating Above Prior High Following Recent Technical Breakout - 11/15/2021 |
View all notes |
Set NEW NOTE alert |
Company Profile |
SEC
News |
Chart |
Request a new note
C
A
S
I |
Symbol/Exchange
Company Name
Industry Group |
PRICE |
CHANGE
(%Change) |
Day High |
Volume
(% DAV)
(% 50 day avg vol) |
52 Wk Hi
% From Hi |
Featured
Date |
Price
Featured |
Pivot Featured |
|
Max Buy |
WDAY
-
NYSE
Workday Inc Cl A
Computer Sftwr-Enterprse
|
$278.86
|
+9.16
3.40% |
$279.55
|
1,389,271
85.02% of 50 DAV
50 DAV is 1,634,000
|
$307.81
-9.41%
|
9/7/2021
|
$275.69
|
PP = $282.87
|
|
MB = $297.01
|
Most Recent Note - 12/16/2021 5:54:36 PM
G - Its Relative Strength Rating has fallen to 74, below the 80+ minimum guideline for buy candidates while now sputtering below its 50 DMA line ($280). A rebound above the 50 DMA line is needed for its outlook to improve. Prior low ($258.22 on 12/06/21) and 200 DMA line ($253.70) define the next important support to watch. Reported Oct '21 quarterly earnings +28% on +20% sales revenues versus the year ago period. Fundamentals remain strong.
>>> FEATURED STOCK ARTICLE : Getting Extended From Previously Noted Base - 11/16/2021 |
View all notes |
Set NEW NOTE alert |
Company Profile |
SEC
News |
Chart |
Request a new note
C
A
S
I |
TTD
-
NASDAQ
The Trade Desk Inc Cl A
Comml Svcs-Advertising
|
$93.53
|
+5.49
6.24% |
$93.75
|
3,887,620
72.26% of 50 DAV
50 DAV is 5,380,000
|
$114.09
-18.02%
|
11/9/2021
|
$95.16
|
PP = $90.00
|
|
MB = $94.50
|
Most Recent Note - 12/21/2021 6:01:11 PM
G - Today's gain with below average volume helped it rebound above the prior high ($90) after finding prompt support near its 50 DMA line ($89.21). Recent resilience has helped its outlook improve, but it faces overhead supply up to the $114 level.
>>> FEATURED STOCK ARTICLE : Quietly Slumping Into Prior Base and Below 50-Day Moving Average - 12/20/2021 |
View all notes |
Set NEW NOTE alert |
Company Profile |
SEC
News |
Chart |
Request a new note
C
A
S
I |
MEDP
-
NASDAQ
Medpace Holdings Inc
Medical-Research Eqp/Svc
|
$217.42
|
+3.68
1.72% |
$217.57
|
152,961
90.51% of 50 DAV
50 DAV is 169,000
|
$231.00
-5.88%
|
9/10/2021
|
$196.32
|
PP = $196.22
|
|
MB = $206.03
|
Most Recent Note - 12/21/2021 6:11:26 PM
G - Found support near its 50 DMA line ($210) recently, and prior highs in the $199 area also define important near-term support to watch. More damaging losses may trigger a worrisome technical sell signal. Recently noted repeatedly - "Sep '21 earnings rose +18% on +28% sales revenues versus the year ago period, below the +25% minimum earnings guideline (C criteria), raising fundamental concerns.
>>> FEATURED STOCK ARTICLE : Medpace Hovering at High With Volume Totals Cooling - 11/17/2021 |
View all notes |
Set NEW NOTE alert |
Company Profile |
SEC
News |
Chart |
Request a new note
C
A
S
I |
AVTR
-
NYSE
Avantor Inc
Medical-Research Eqp/Svc
|
$40.95
|
+1.45
3.67% |
$41.11
|
7,019,052
176.67% of 50 DAV
50 DAV is 3,973,000
|
$44.37
-7.71%
|
6/10/2021
|
$32.94
|
PP = $34.09
|
|
MB = $35.79
|
Most Recent Note - 12/21/2021 5:55:21 PM
G - Posted a 3rd solid volume-driven gain in the span of 5 session, rebounding further above its 50 DMA line ($39) helping its technical stance improve. Faces overhead supply up to the $44 level. Prior lows in the high $36 area define important near-term support. Reported Sep '21 quarterly earnings +46% above the year ago period. Completed a Secondary Offering on 9/13/21. See the latest FSU analysis for more details and a new annotated graph.
>>> FEATURED STOCK ARTICLE : Rebounding With Volume-Driven Gains - 12/21/2021 |
View all notes |
Set NEW NOTE alert |
Company Profile |
SEC
News |
Chart |
Request a new note
C
A
S
I |
MIME
-
NASDAQ
Mimecast Limited
Computer Sftwr-Security
|
$79.01
|
+0.08
0.10% |
$79.30
|
2,563,163
182.04% of 50 DAV
50 DAV is 1,408,000
|
$85.48
-7.57%
|
10/18/2021
|
$68.17
|
PP = $71.55
|
|
MB = $75.13
|
Most Recent Note - 12/21/2021 12:34:31 PM
G - Holding its ground after a gap up on 12/07/21 M&A news. Found prompt support at its 50 DMA line. More damaging losses would raise concerns and trigger technical sell signals.
>>> FEATURED STOCK ARTICLE : Extended From Latest Base While Fundamentals Remain Strong - 11/26/2021 |
View all notes |
Set NEW NOTE alert |
Company Profile |
SEC
News |
Chart |
Request a new note
C
A
S
I |
Symbol/Exchange
Company Name
Industry Group |
PRICE |
CHANGE
(%Change) |
Day High |
Volume
(% DAV)
(% 50 day avg vol) |
52 Wk Hi
% From Hi |
Featured
Date |
Price
Featured |
Pivot Featured |
|
Max Buy |
|
|
|
THESE ARE NOT BUY RECOMMENDATIONS!
Comments contained in the body of this report are technical
opinions only. The material herein has been obtained
from sources believed to be reliable and accurate, however,
its accuracy and completeness cannot be guaranteed.
This site is not an investment advisor, hence it does
not endorse or recommend any securities or other investments.
Any recommendation contained in this report may not
be suitable for all investors and it is not to be deemed
an offer or solicitation on our part with respect to
the purchase or sale of any securities. All trademarks,
service marks and trade names appearing in this report
are the property of their respective owners, and are
likewise used for identification purposes only.
This report is a service available
only to active Paid Premium Members.
You may opt-out of receiving report notifications
at any time. Questions or comments may be submitted
by writing to Premium Membership Services 665 S.E. 10 Street, Suite 201 Deerfield Beach, FL 33441-5634 or by calling 1-800-965-8307
or 954-785-1121.
|
|
|