You are not logged in.
This means you
CAN ONLY VIEW reports that were published prior to Tuesday, April 1, 2025.
You
MUST UPGRADE YOUR MEMBERSHIP if you want to see any current reports.
AFTER MARKET UPDATE - THURSDAY, NOVEMBER 18TH, 2021
Previous After Market Report Next After Market Report >>>
|
|
|
|
DOW |
-60.10 |
35,870.95 |
-0.17% |
|
Volume |
868,203,851 |
+8% |
|
Volume |
5,364,295,400 |
+6% |
|
NASDAQ |
+72.14 |
15,993.71 |
+0.45% |
|
Advancers |
1,146 |
35% |
|
Advancers |
1,475 |
33% |
|
S&P 500 |
+15.87 |
4,704.54 |
+0.34% |
|
Decliners |
2,151 |
65% |
|
Decliners |
3,036 |
67% |
|
Russell 2000 |
-13.42 |
2,363.59 |
-0.56% |
|
52 Wk Highs |
118 |
|
|
52 Wk Highs |
158 |
|
|
S&P 600 |
-5.17 |
1,439.28 |
-0.36% |
|
52 Wk Lows |
108 |
|
|
52 Wk Lows |
410 |
|
|
 |
Breadth Negative as Major Indices Ended Mixed
Kenneth J. Gruneisen - Passed the CAN SLIM® Master's Exam
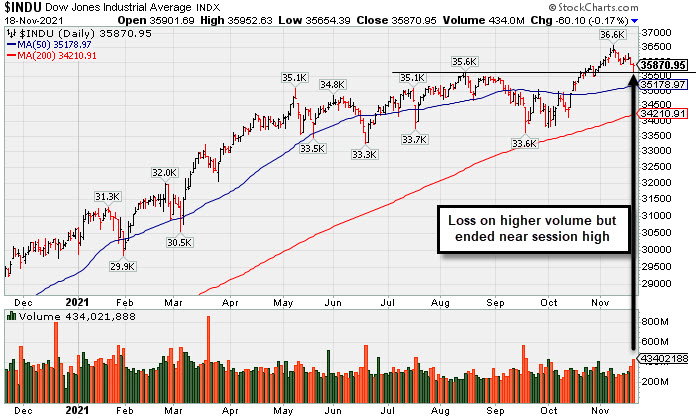
The S&P 500 and Nasdaq Composite climbed 0.3% and 0.5%, respectively, with both benchmarks closing at fresh record levels. The Philadelphia semiconductor index (SOX) scaled its own peak, up 1.8%. The Dow slipped 60 points, while the small-cap Russell 2000 lost 0.6%. The volume totals reported were higher than the prior session on the NYSE and on the Nasdaq exchange. Breadth was negative as decliners led advancers by about a 2-1 margin on the NYSE and on the Nasdaq exchange. There were 59 high-ranked companies from the Leaders List that hit new 52-week highs and were listed on the BreakOuts Page versus 65 on the prior session. New 52-week highs outnumbered new 52-week lows on the NYSE but new lows expanded outnumbered new highs on the Nasdaq exchange. The major indices (M criteria) are in a confirmed uptrend. Investors are reminded to only make proper new buys as per the fundamental and technical rules of the fact-based investment system.
PICTURED: The Dow Jones Industrial Average finished near the session high after testing near the August high as it suffered a loss on higher volume.
U.S. stocks finished mixed on Thursday, with growth-related shares outperforming more cyclical and value-oriented pockets of the market. On the data front, initial jobless claims fell for a seventh consecutive week to 268,000, approaching the 256,000 level from mid-March 2020. Separately, the Philadelphia Fed business outlook soared to 39.0 in November, back near April’s 48-year peak of 50.2. Rounding out the docket, an update from the Kansas City Fed showed manufacturing activity in the region eased more than projected this month. In central bank news, New York Fed President John Williams acknowledged that broader-based inflationary pressures are being observed. Treasuries were modestly higher, with the yield on the 10-year note down one basis point to 1.58%.
Mega-cap names in the Consumer Discretionary and Information Technology groups pushed equities higher, with Amazon (AMZN) and Apple (AAPL) rising 4.2% and 3.2%, respectively. The e-commerce giant benefitted from upbeat earnings results from traditional retailers, while the iPhone maker climbed on reports the company is increasing its focus on developing autonomous electric vehicles. In earnings, NVIDIA (NVDA +8.6%) rallied to a record after exceeding Wall Street profit and revenue expectations and providing a solid outlook. Meanwhile, Cisco Systems (CSCO -5.9%) fell as ongoing supply chain issues incited a weak current-quarter revenue forecast. In the retail space, Macy’s (M +21.6%) rose after boosting its guidance, while Kohl’s (KSS +10.4%) following strong results. |
 Kenneth J. Gruneisen started out as a licensed stockbroker in August 1987, a couple of months prior to the historic stock market crash that took the Dow Jones Industrial Average down -22.6% in a single day. He has published daily fact-based fundamental and technical analysis on high-ranked stocks online for two decades. Through FACTBASEDINVESTING.COM, Kenneth provides educational articles, news, market commentary, and other information regarding proven investment systems that work in good times and bad.
Comments contained in the body of this report are technical opinions only and are not necessarily those of Gruneisen Growth Corp. The material herein has been obtained from sources believed to be reliable and accurate, however, its accuracy and completeness cannot be guaranteed. Our firm, employees, and customers may effect transactions, including transactions contrary to any recommendation herein, or have positions in the securities mentioned herein or options with respect thereto. Any recommendation contained in this report may not be suitable for all investors and it is not to be deemed an offer or solicitation on our part with respect to the purchase or sale of any securities. |
|
 |
Retail and Semiconductor Indexes Rose
Kenneth J. Gruneisen - Passed the CAN SLIM® Master's Exam
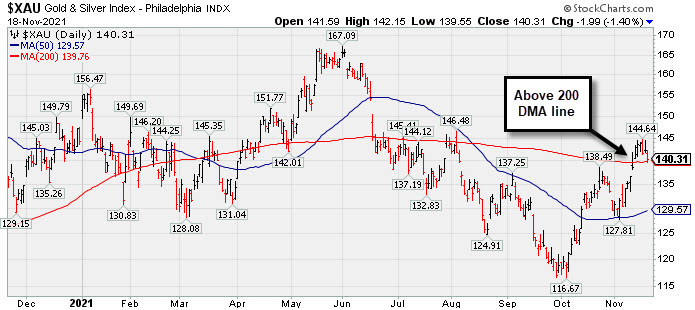
The Bank Index ($BKX -0.37%) and Broker/Dealer Index ($XBD -0.28%) both edged lower while the Retail Index ($RLX +2.84%) posted a standout gain. The Semiconductor Index ($SOX +1.79%) led the tech sector while the Networking Index ($NWX -0.51%) and Biotech Index ($BTK -0.47%) both edged lower. The Gold & Silver Index ($XAU -1.40%), Oil Services Index ($OSX -2.89%), and Integrated Oil Index ($XOI -0.61%) suffered unanimous losses.
PICTURED: The Gold & Silver Index ($XAU -1.40%) recently rebounded above its 200-day moving average (DMA) line.
| Oil Services |
$OSX |
54.85 |
-1.63 |
-2.89% |
+23.73% |
| Integrated Oil |
$XOI |
1,173.51 |
-7.15 |
-0.61% |
+48.08% |
| Semiconductor |
$SOX |
3,899.96 |
+68.52 |
+1.79% |
+39.51% |
| Networking |
$NWX |
888.07 |
-4.58 |
-0.51% |
+23.84% |
| Broker/Dealer |
$XBD |
491.33 |
-1.36 |
-0.28% |
+30.12% |
| Retail |
$RLX |
4,473.60 |
+123.69 |
+2.84% |
+25.55% |
| Gold & Silver |
$XAU |
140.31 |
-1.99 |
-1.40% |
-2.69% |
| Bank |
$BKX |
138.06 |
-0.51 |
-0.37% |
+41.00% |
| Biotech |
$BTK |
5,389.69 |
-25.49 |
-0.47% |
-6.09% |
|
|
|
 |
Reversed After Wedging to New Highs
Kenneth J. Gruneisen - Passed the CAN SLIM® Master's Exam
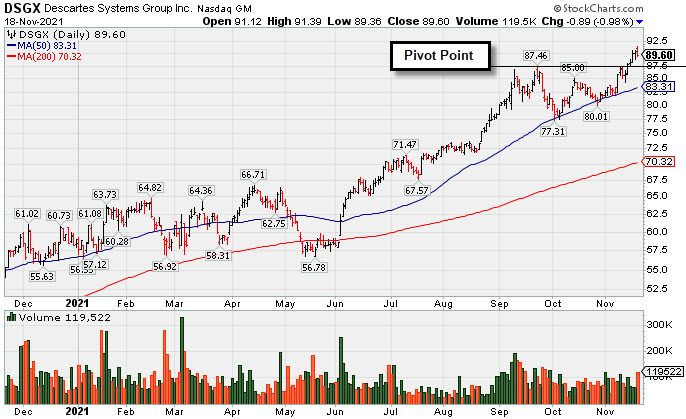
Descartes Systems Group (DSGX +$0.28 or +0.31% to $90.77) was highlighted in the earlier mid-day report in yellow with pivot point cited based on its 9/23/21 high plus 10 cents. it reversed into the red after hitting a new all-time high, breaking a streak of 5 consecutive gains. It recently wedged from a 6-week base with gains lacking great volume conviction. Subsequent gains above the pivot point must be backed by at least +40% above average volume to clinch a proper technical buy signal.
The high-ranked COMPUTER SOFTWARE & SERVICES - Business Software & Services firm reported strong Oct '20, Jan, Apr, and Jul '21 quarterly earnings above the +25% minimum earnings guideline (C criteria) versus the year ago periods with acceleration in its sales revenues growth rate. Annual earnings history (A criteria) has been steady, a fair match with regard to the fact-based investment system. Completed a new Public Offering on 6/05/19.
The number of top-rated funds owning its share rose from 442 in Dec '20 to 500 in Sep '21, a reassuring sign concerning the I criteria. It has a Timeliness Rating of B and a Sponsorship Rating of B. There are 84.6 million shares outstanding (S criteria) which can contribute to greater price volatility in the event of institutional buying or selling. |
|
|
Color Codes Explained :
Y - Better candidates highlighted by our
staff of experts.
G - Previously featured
in past reports as yellow but may no longer be buyable under the
guidelines.
***Last / Change / Volume data in this table is the closing quote data***
Symbol/Exchange
Company Name
Industry Group |
PRICE |
CHANGE
(%Change) |
Day High |
Volume
(% DAV)
(% 50 day avg vol) |
52 Wk Hi
% From Hi |
Featured
Date |
Price
Featured |
Pivot Featured |
|
Max Buy |
 SIVB
-
NASDAQ
SIVB
-
NASDAQ
S V B Financial Group
BANKING - Regional - Pacific Banks
|
$744.97
|
-0.29
-0.04% |
$754.84
|
209,435
61.06% of 50 DAV
50 DAV is 343,000
|
$763.22
-2.39%
|
8/6/2021
|
$589.70
|
PP = $608.94
|
|
MB = $639.39
|
 Most Recent Note - 11/18/2021 2:57:24 PM
G - Volume totals have been cooling while hovering near its all-time high, extended from the previously noted base. Recently reported Sep '21 quarterly earnings -14% on +43% sales revenues versus the year ago period, below the +25% minimum earnings guideline (C criteria), raising fundamental concerns. Its 50 DMA line ($685) defines important near-term support to watch on pullbacks. Completed a new Public Offering on 8/11/21.
>>> FEATURED STOCK ARTICLE : Latest Quarter Raised Fundamental Concerns - 10/29/2021 |
View all notes |
Set NEW NOTE alert |
Company Profile |
SEC
News |
Chart |
Request a new note
C
A
S
I |
BLDR
-
NYSE
Builders Firstsource Inc
Bldg-Constr Prds/Misc
|
$71.19
|
+1.94
2.80% |
$72.08
|
3,206,170
166.90% of 50 DAV
50 DAV is 1,921,000
|
$69.59
2.30%
|
8/12/2021
|
$52.38
|
PP = $54.09
|
|
MB = $56.79
|
Most Recent Note - 11/18/2021 11:57:52 AM
G - Hitting yet another new all-time high today after stubbornly holding its ground, and it is very extended from any sound base. Bullish action came after it reported Sep '21 quarterly earnings +308% on +140% sales revenues versus the year ago period. Its 50 DMA line ($58.15) and prior highs in the $55 area define important near-term support to watch on pullbacks.
>>> FEATURED STOCK ARTICLE : Earnings News Due Thursday for High-Ranked Building Products Firm - 11/2/2021 |
View all notes |
Set NEW NOTE alert |
Company Profile |
SEC
News |
Chart |
Request a new note
C
A
S
I |
DSGX
-
NASDAQ
Descartes Systems Group
COMPUTER SOFTWARE and SERVICES - Business Software and Services
|
$89.60
|
-0.89
-0.98% |
$91.39
|
119,524
131.35% of 50 DAV
50 DAV is 91,000
|
$90.74
-1.26%
|
11/18/2021
|
$90.77
|
PP = $87.56
|
|
MB = $91.94
|
Most Recent Note - 11/18/2021 5:53:42 PM
Y - There was a "negative reversal" today as it finished near the session low with a loss on above average volume after highlighted in yellow in the earlier mid-day report with pivot point cited based on its 9/23/21 high plus 10 cents. While recently wedging from a 6-week base, gains above a stock's pivot point must be backed by at least +40% above average volume to clinch a proper technical buy signal. Reported strong Oct '20, Jan, Apr, and Jul '21 quarterly earnings above the +25% minimum earnings guideline (C criteria) versus the year ago periods with acceleration in its sales revenues growth rate. Annual earnings history (A criteria) has been steady, a fair match with regard to the fact-based investment system. Completed a new Public Offering on 6/05/19. See the latest FSU analysis for more details and a new annotated graph.
>>> FEATURED STOCK ARTICLE : Reversed After Wedging to New Highs - 11/18/2021 |
View all notes |
Set NEW NOTE alert |
Company Profile |
SEC
News |
Chart |
Request a new note
C
A
S
I |
KFRC
-
NASDAQ
Kforce Inc
Comml Svcs-Staffing
|
$77.41
|
-0.23
-0.30% |
$78.35
|
123,858
114.68% of 50 DAV
50 DAV is 108,000
|
$80.12
-3.38%
|
9/10/2021
|
$59.53
|
PP = $64.48
|
|
MB = $67.70
|
Most Recent Note - 11/18/2021 2:54:49 PM
G - Extended from any sound base and holding its ground near its all-time high. Its prior high and 50 DMA line ($66.38) define important near-term support to watch on pullbacks. Recently reported Sep '21 quarterly earnings +8% on +10% sales revenues versus the year ago period, below the +25% minimum earnings guideline (C criteria), raising fundamental concerns.
>>> FEATURED STOCK ARTICLE : Pulling Back Near Prior Highs Following Technical Breakout - 10/15/2021 |
View all notes |
Set NEW NOTE alert |
Company Profile |
SEC
News |
Chart |
Request a new note
C
A
S
I |
GNRC
-
NYSE
Generac Hldgs Inc
Electrical-Power/Equipmt
|
$422.09
|
-4.55
-1.07% |
$430.32
|
487,063
74.82% of 50 DAV
50 DAV is 651,000
|
$524.31
-19.50%
|
8/30/2021
|
$449.36
|
PP = $457.10
|
|
MB = $479.96
|
Most Recent Note - 11/15/2021 3:57:55 PM
G - Sputtering below its 50 DMA line ($444) with a loss today on light volume. Churned above average volume after a "negative reversal" noted at its all-time high. Weak action came after it reported Sep '21 quarterly earnings +13% on +34% sales revenues versus the year ago period, below the +25% minimum earnings guideline (C criteria), raising fundamental concerns.
>>> FEATURED STOCK ARTICLE : Halted Slide at 50-Day Moving Average After Earnings News - 11/8/2021 |
View all notes |
Set NEW NOTE alert |
Company Profile |
SEC
News |
Chart |
Request a new note
C
A
S
I |
Symbol/Exchange
Company Name
Industry Group |
PRICE |
CHANGE
(%Change) |
Day High |
Volume
(% DAV)
(% 50 day avg vol) |
52 Wk Hi
% From Hi |
Featured
Date |
Price
Featured |
Pivot Featured |
|
Max Buy |
CAMT
-
NASDAQ
Camtek Ltd
ELECTRONICS - Scientific and Technical Instrum
|
$44.96
|
-2.56
-5.39% |
$44.98
|
1,949,368
1,160.34% of 50 DAV
50 DAV is 168,000
|
$49.60
-9.35%
|
11/9/2021
|
$45.43
|
PP = $46.11
|
|
MB = $48.42
|
Most Recent Note - 11/18/2021 11:58:32 AM
Y - Gapped down today slumping below the prior high and back into the prior base after proposing a new $140 Million note offering. Fundamentals remain strong.
>>> FEATURED STOCK ARTICLE : Rebound Above 50-Day Moving Average Helped Outlook - 11/5/2021 |
View all notes |
Set NEW NOTE alert |
Company Profile |
SEC
News |
Chart |
Request a new note
C
A
S
I |
AMD
-
NASDAQ
Advanced Micro Devices
ELECTRONICS - Semiconductor - Broad Line
|
$155.02
|
+3.68
2.43% |
$158.89
|
60,508,385
119.90% of 50 DAV
50 DAV is 50,466,000
|
$155.65
-0.40%
|
10/27/2021
|
$124.91
|
PP = $122.59
|
|
MB = $128.72
|
Most Recent Note - 11/18/2021 11:52:56 AM
G - Hitting another new all-time high with today's gain, very extended from the previously noted base. Disciplined investors avoid chasing extended stocks. Prior high in the $122 area and its 50 DMA line define support to watch on pullbacks. Fundamentals remain strong after it reported Sep '21 quarterly earnings +78% on +54% sales revenues versus the year ago period.
>>> FEATURED STOCK ARTICLE : Encountered Distributional Pressure After Reaching New High - 10/27/2021 |
View all notes |
Set NEW NOTE alert |
Company Profile |
SEC
News |
Chart |
Request a new note
C
A
S
I |
UMC
-
NYSE
United Microelectrnc Adr
ELECTRONICS - Semiconductor - Integrated Cir
|
$11.48
|
+0.18
1.59% |
$11.52
|
6,983,400
95.23% of 50 DAV
50 DAV is 7,333,000
|
$12.62
-9.03%
|
8/5/2021
|
$11.62
|
PP = $11.38
|
|
MB = $11.95
|
Most Recent Note - 11/17/2021 8:04:00 PM
G - Holding its ground above its 50 DMA line ($11.08) with volume totals cooling. Reported Sep '21 quarterly earnings +100% on +30% sales revenues versus the year ago period. Recently found support above its 200 DMA line ($10.02).
>>> FEATURED STOCK ARTICLE : Earnings News Due From Taiwan-Based Semiconductor Firm - 10/26/2021 |
View all notes |
Set NEW NOTE alert |
Company Profile |
SEC
News |
Chart |
Request a new note
C
A
S
I |
BRKS
-
NASDAQ
Brooks Automation
ELECTRONICS - Semiconductor Equipment and Mate
|
$119.55
|
+0.04
0.03% |
$120.10
|
484,752
78.36% of 50 DAV
50 DAV is 618,600
|
$124.79
-4.20%
|
9/20/2021
|
$101.21
|
PP = $108.82
|
|
MB = $114.26
|
Most Recent Note - 11/16/2021 12:41:40 PM
G - Color code is changed to green after rallying back above its "max buy" level with today's early gain. Prior high ($110) and its 50 DMA line ($106.42) define near-term support to watch on pullbacks. Reported Sep 21 quarterly earnings +33% on +27% sales revenues versus the year ago period.
>>> FEATURED STOCK ARTICLE : 5th Quiet Gain Has Brooks Perched Near Prior Highs - 10/20/2021 |
View all notes |
Set NEW NOTE alert |
Company Profile |
SEC
News |
Chart |
Request a new note
C
A
S
I |
ENTG
-
NASDAQ
Entegris Inc
ELECTRONICS - Semiconductor Equipment and Mate
|
$153.82
|
+1.15
0.75% |
$154.91
|
723,263
83.81% of 50 DAV
50 DAV is 863,000
|
$154.04
-0.14%
|
8/4/2021
|
$125.33
|
PP = $126.51
|
|
MB = $132.84
|
Most Recent Note - 11/15/2021 4:43:32 PM
G - Perched at its all-time high with today's small gain on light volume, very extended from any sound base. Prior high ($136) and its 50 DMA line ($132.22) define near-term support to watch. Fundamentals remain strong after it recently reported Sep '21 quarterly earnings +37% on +20% sales revenues versus the year ago period.
>>> FEATURED STOCK ARTICLE : Hit New Record High With Another Volume-Driven Gain - 10/22/2021 |
View all notes |
Set NEW NOTE alert |
Company Profile |
SEC
News |
Chart |
Request a new note
C
A
S
I |
Symbol/Exchange
Company Name
Industry Group |
PRICE |
CHANGE
(%Change) |
Day High |
Volume
(% DAV)
(% 50 day avg vol) |
52 Wk Hi
% From Hi |
Featured
Date |
Price
Featured |
Pivot Featured |
|
Max Buy |
SKY
-
NYSE
Skyline Champion Corp
Bldg-Mobile/Mfg andamp; RV
|
$80.74
|
+1.29
1.62% |
$81.68
|
602,599
156.11% of 50 DAV
50 DAV is 386,000
|
$79.80
1.18%
|
11/3/2021
|
$72.19
|
PP = $66.92
|
|
MB = $70.27
|
Most Recent Note - 11/16/2021 5:21:50 PM
G - Hit a new all-time high and finished near the session high with today's big volume-driven gain. Very extended from the previously noted flat base. Prior highs in the $66 area define initial support to watch above its 50 DMA line ($65) on pullbacks. Reported very strong Mar, Jun and Sep '21 quarterly results versus the year ago periods well above the +25% minimum earnings guideline (C criteria). Annual earnings (A criteria) history has been strong.
>>> FEATURED STOCK ARTICLE : Breakaway Gap After 10-Week Flat Base - 11/3/2021 |
View all notes |
Set NEW NOTE alert |
Company Profile |
SEC
News |
Chart |
Request a new note
C
A
S
I |
WSM
-
NYSE
Williams Sonoma Inc
RETAIL - Home Furnishing Stores
|
$218.89
|
+8.94
4.26% |
$219.71
|
1,880,509
218.16% of 50 DAV
50 DAV is 862,000
|
$222.60
-1.67%
|
11/3/2021
|
$205.00
|
PP = $195.09
|
|
MB = $204.84
|
Most Recent Note - 11/18/2021 2:48:10 PM
G - Due to report Oct '21 quarterly results. Volume and volatility often increase near earnings news. Perched near its all-time high, extended from the previously noted base. Prior highs define near-term support to watch above its 50 DMA line ($188.67).
>>> FEATURED STOCK ARTICLE : Volume-Driven Gains May Signal a New Meaningful Leg Up - 11/4/2021 |
View all notes |
Set NEW NOTE alert |
Company Profile |
SEC
News |
Chart |
Request a new note
C
A
S
I |
CLFD
-
NASDAQ
Clearfield Inc
TELECOMMUNICATIONS - Cables / Satalite Equipment
|
$67.38
|
-0.31
-0.46% |
$68.50
|
94,340
83.49% of 50 DAV
50 DAV is 113,000
|
$72.00
-6.42%
|
7/23/2021
|
$40.23
|
PP = $43.74
|
|
MB = $45.93
|
Most Recent Note - 11/15/2021 12:15:10 PM
G - Reversed into the red after hitting yet another new all-time high with today's early gain. It is very extended from the previously noted base. Its 50 DMA line ($51.76) defines near-term support to watch on pullbacks. Reported Sep '21 quarterly earnings +141% on +66% sales revenues above the year ago period.
>>> FEATURED STOCK ARTICLE : Extended From Prior Base After Latest Rally - 10/18/2021 |
View all notes |
Set NEW NOTE alert |
Company Profile |
SEC
News |
Chart |
Request a new note
C
A
S
I |
TGH
-
NYSE
Textainer Group Holdings
TRANSPORTATION - Logistics
|
$36.55
|
-0.61
-1.64% |
$37.21
|
414,803
85.88% of 50 DAV
50 DAV is 483,000
|
$41.24
-11.37%
|
10/7/2021
|
$36.97
|
PP = $36.80
|
|
MB = $38.64
|
Most Recent Note - 11/18/2021 2:40:31 PM
Y - Today's loss with below average volume has it testing its 50 DMA line ($36.44) and also sputtering near prior highs defining important near-term support. Moe damaging losses would raise concerns and trigger a technical sell signal. Fundamentals remain strong.
>>> FEATURED STOCK ARTICLE : Pulling Back Below "Max Buy" Level With Lighter Volume - 11/10/2021 |
View all notes |
Set NEW NOTE alert |
Company Profile |
SEC
News |
Chart |
Request a new note
C
A
S
I |
ENPH
-
NASDAQ
Enphase Energy Inc
Energy-Solar
|
$254.48
|
-0.38
-0.15% |
$259.75
|
1,536,254
65.37% of 50 DAV
50 DAV is 2,350,000
|
$260.56
-2.33%
|
10/28/2021
|
$218.00
|
PP = $229.14
|
|
MB = $240.60
|
Most Recent Note - 11/16/2021 5:16:33 PM
G - Perched at its all-time high with today's gain on near average volume. Extended from the previously noted base. Prior high ($229) defines initial support to watch on pullbacks.
>>> FEATURED STOCK ARTICLE : Enphase is Challenging its All-Time High With Volume-Driven Gains - 10/28/2021 |
View all notes |
Set NEW NOTE alert |
Company Profile |
SEC
News |
Chart |
Request a new note
C
A
S
I |
Symbol/Exchange
Company Name
Industry Group |
PRICE |
CHANGE
(%Change) |
Day High |
Volume
(% DAV)
(% 50 day avg vol) |
52 Wk Hi
% From Hi |
Featured
Date |
Price
Featured |
Pivot Featured |
|
Max Buy |
SMPL
-
NASDAQ
Simply Good Foods Co
Food-Confectionery
|
$39.38
|
-0.24
-0.61% |
$40.19
|
297,816
80.27% of 50 DAV
50 DAV is 371,000
|
$41.35
-4.76%
|
10/25/2021
|
$38.30
|
PP = $38.60
|
|
MB = $40.53
|
Most Recent Note - 11/15/2021 4:26:03 PM
Y - Still quietly consolidating above prior highs and below its "max buy" level. Prior highs in the $38 area define initial support to watch above its 50 DMA line ($36.61).
>>> FEATURED STOCK ARTICLE : Consolidating Above Prior High Following Recent Technical Breakout - 11/15/2021 |
View all notes |
Set NEW NOTE alert |
Company Profile |
SEC
News |
Chart |
Request a new note
C
A
S
I |
WDAY
-
NASDAQ
Workday Inc Cl A
Computer Sftwr-Enterprse
|
$299.09
|
-1.81
-0.60% |
$301.78
|
2,550,130
184.79% of 50 DAV
50 DAV is 1,380,000
|
$307.81
-2.83%
|
9/7/2021
|
$275.69
|
PP = $282.87
|
|
MB = $297.01
|
Most Recent Note - 11/18/2021 12:42:54 PM
G - Due to report Oct '21 quarterly results. Volume and volatility often increase near earnings news. Color code was changed to green after volume-driven gains above its "max buy" level, getting extended from the previously noted base. Prior highs in the $278-282 area define initial support above its 50 DMA line ($275) where any violations would raise concerns. Fundamentals remain strong.
>>> FEATURED STOCK ARTICLE : Getting Extended From Previously Noted Base - 11/16/2021 |
View all notes |
Set NEW NOTE alert |
Company Profile |
SEC
News |
Chart |
Request a new note
C
A
S
I |
CTLT
-
NYSE
"Catalent, Inc"
DRUGS - Biotechnology
|
$128.03
|
-2.02
-1.55% |
$131.23
|
994,825
110.75% of 50 DAV
50 DAV is 898,300
|
$142.64
-10.24%
|
8/25/2021
|
$128.72
|
PP = $127.78
|
|
MB = $134.17
|
Most Recent Note - 11/17/2021 12:25:00 PM
G - The 50 DMA line ($132.63) may act as resistance while it is on track today for a 5th consecutive gain. Its Relative Strength Rating is 73, still below the 80+ minimum guideline for buy candidates. Halted its slide above its 200 DMA line ($117.40). More damaging losses would raise greater concerns. Fundamentals remain strong after it reported Sep '21 quarterly earnings +65% on +21% sales revenues versus the year ago period, continuing its strong earnings track record.
>>> FEATURED STOCK ARTICLE : Recent Violation of 50-Day Moving Average Triggered Sell Signal - 11/11/2021 |
View all notes |
Set NEW NOTE alert |
Company Profile |
SEC
News |
Chart |
Request a new note
C
A
S
I |
TTD
-
NASDAQ
The Trade Desk Inc Cl A
Comml Svcs-Advertising
|
$105.47
|
-2.03
-1.89% |
$110.30
|
5,711,541
117.11% of 50 DAV
50 DAV is 4,877,000
|
$114.09
-7.56%
|
11/9/2021
|
$95.16
|
PP = $90.00
|
|
MB = $94.50
|
Most Recent Note - 11/18/2021 2:46:13 PM
G - Pulling back with lighter volume after a spurt of volume-driven gains left it very extended from the previously noted 9-month cup-with-handle shaped base. Prior highs define initial support to watch.
>>> FEATURED STOCK ARTICLE : Powerful Volume-Driven Gains for New Highs - 11/9/2021 |
View all notes |
Set NEW NOTE alert |
Company Profile |
SEC
News |
Chart |
Request a new note
C
A
S
I |
MEDP
-
NASDAQ
Medpace Holdings Inc
Medical-Research Eqp/Svc
|
$226.27
|
-1.14
-0.50% |
$228.11
|
132,103
74.22% of 50 DAV
50 DAV is 178,000
|
$229.49
-1.40%
|
9/10/2021
|
$196.32
|
PP = $196.22
|
|
MB = $206.03
|
Most Recent Note - 11/17/2021 8:02:37 PM
G - Volume totals have still been cooling while stubbornly holding its ground near its 52-week high. Recent bullish action came even after it reported Sep '21 earnings +18% on +28% sales revenues versus the year ago period, below the +25% minimum earnings guideline (C criteria), raising fundamental concerns. Prior highs in the $199 area define important near-term support coinciding with its 50 DMA line. See the latest FSU analysis for more details and a new annotated graph.
>>> FEATURED STOCK ARTICLE : Medpace Hovering at High With Volume Totals Cooling - 11/17/2021 |
View all notes |
Set NEW NOTE alert |
Company Profile |
SEC
News |
Chart |
Request a new note
C
A
S
I |
Symbol/Exchange
Company Name
Industry Group |
PRICE |
CHANGE
(%Change) |
Day High |
Volume
(% DAV)
(% 50 day avg vol) |
52 Wk Hi
% From Hi |
Featured
Date |
Price
Featured |
Pivot Featured |
|
Max Buy |
JEF
-
NYSE
Jefferies Financial Grp
Finance-Invest Bnk/Bkrs
|
$40.18
|
-0.36
-0.89% |
$40.78
|
1,076,780
59.03% of 50 DAV
50 DAV is 1,824,000
|
$44.47
-9.65%
|
6/28/2021
|
$31.81
|
PP = $34.42
|
|
MB = $36.14
|
Most Recent Note - 11/16/2021 5:19:35 PM
G - Gapped down today for a 3rd consecutive loss. Encountering distributional pressure in recent weeks while hovering near its all-time high. Its 50 DMA line ($40.09) defines important near-term support to watch on pullbacks. Reported Aug '21 quarterly earnings +40% on +20% sales revenues versus the year ago period.
>>> FEATURED STOCK ARTICLE : Extended From Prior Highs and Stubbornly Holding Ground - 11/1/2021 |
View all notes |
Set NEW NOTE alert |
Company Profile |
SEC
News |
Chart |
Request a new note
C
A
S
I |
AVTR
-
NYSE
Avantor Inc
Medical-Research Eqp/Svc
|
$39.28
|
+0.09
0.23% |
$39.58
|
2,287,348
51.40% of 50 DAV
50 DAV is 4,450,500
|
$44.37
-11.47%
|
6/10/2021
|
$32.94
|
PP = $34.09
|
|
MB = $35.79
|
Most Recent Note - 11/18/2021 2:50:53 PM
G - Still sputtering and meeting resistance at its 50 DMA line ($40). A rebound above the 50 DMA line is needed for its outlook to improve, and it faces overhead supply up to the $44 level. Reported Sep '21 quarterly earnings +46% above the year ago period. Completed a Secondary Offering on 9/13/21.
>>> FEATURED STOCK ARTICLE : Faces Resistance While Sputtering Below 50 DMA Line - 11/12/2021 |
View all notes |
Set NEW NOTE alert |
Company Profile |
SEC
News |
Chart |
Request a new note
C
A
S
I |
MIME
-
NASDAQ
Mimecast Limited
Computer Sftwr-Security
|
$83.66
|
-0.87
-1.03% |
$85.48
|
498,242
86.50% of 50 DAV
50 DAV is 576,000
|
$84.95
-1.52%
|
10/18/2021
|
$68.17
|
PP = $71.55
|
|
MB = $75.13
|
Most Recent Note - 11/18/2021 2:56:29 PM
G - Reversed into the red after hitting another new all-time high today following 5 consecutive gains. Very extended from the previously noted base. Prior highs in the $71 area define initial support above its 50 DMA line ($70.59).
>>> FEATURED STOCK ARTICLE : MIME Consolidating Less Than 4% Off High Building New Base - 10/21/2021 |
View all notes |
Set NEW NOTE alert |
Company Profile |
SEC
News |
Chart |
Request a new note
C
A
S
I |
ZD
-
NASDAQ
Ziff Davis Inc
Internet-Content
|
$121.84
|
-0.85
-0.69% |
$123.16
|
345,038
80.43% of 50 DAV
50 DAV is 429,000
|
$135.00
-9.75%
|
10/25/2021
|
$126.07
|
PP = $128.19
|
|
MB = $134.60
|
Most Recent Note - 11/18/2021 2:42:53 PM
G - Color code is changed to green while slumping below its 50 DMA line ($122.91) with today's 5th consecutive loss raising concerns. Only a prompt rebound above the 50 DMA line would help its outlook improve. Quarterly and annual earnings (C and A criteria) history has been strong.
>>> FEATURED STOCK ARTICLE : Internet Content Firm Perched Near Prior High - 10/25/2021 |
View all notes |
Set NEW NOTE alert |
Company Profile |
SEC
News |
Chart |
Request a new note
C
A
S
I |
|
|
|
THESE ARE NOT BUY RECOMMENDATIONS!
Comments contained in the body of this report are technical
opinions only. The material herein has been obtained
from sources believed to be reliable and accurate, however,
its accuracy and completeness cannot be guaranteed.
This site is not an investment advisor, hence it does
not endorse or recommend any securities or other investments.
Any recommendation contained in this report may not
be suitable for all investors and it is not to be deemed
an offer or solicitation on our part with respect to
the purchase or sale of any securities. All trademarks,
service marks and trade names appearing in this report
are the property of their respective owners, and are
likewise used for identification purposes only.
This report is a service available
only to active Paid Premium Members.
You may opt-out of receiving report notifications
at any time. Questions or comments may be submitted
by writing to Premium Membership Services 665 S.E. 10 Street, Suite 201 Deerfield Beach, FL 33441-5634 or by calling 1-800-965-8307
or 954-785-1121.
|
|
|