You are not logged in.
This means you
CAN ONLY VIEW reports that were published prior to Tuesday, April 1, 2025.
You
MUST UPGRADE YOUR MEMBERSHIP if you want to see any current reports.
AFTER MARKET UPDATE - WEDNESDAY, OCTOBER 6TH, 2021
Previous After Market Report Next After Market Report >>>
|
|
|
|
DOW |
+102.32 |
34,416.99 |
+0.30% |
|
Volume |
882,837,994 |
+1% |
|
Volume |
4,398,735,800 |
+6% |
|
NASDAQ |
+68.08 |
14,501.91 |
+0.47% |
|
Advancers |
1,465 |
47% |
|
Advancers |
1,682 |
39% |
|
S&P 500 |
+17.83 |
4,363.55 |
+0.41% |
|
Decliners |
1,671 |
53% |
|
Decliners |
2,662 |
61% |
|
Russell 2000 |
-13.36 |
2,215.00 |
-0.60% |
|
52 Wk Highs |
34 |
|
|
52 Wk Highs |
46 |
|
|
S&P 600 |
-10.70 |
1,345.60 |
-0.79% |
|
52 Wk Lows |
95 |
|
|
52 Wk Lows |
273 |
|
|
The direction of the major averages (M) has shifted to a "market correction" and new buying is to be avoided. Greater caution is now warranted until a new confirmed rally with a follow-through day is noted.
|
 |
Leadership Thinned and Breadth was Negative as Indices Posted Gains
Kenneth J. Gruneisen - Passed the CAN SLIM® Master's Exam
The Dow halted a more than 400 point decline to close 102 points higher. The S&P 500 climbed 0.4%, bouncing off a more than 1% drop and snapping a four day streak of experiencing moves of 1% or more in either direction, which had been its longest such stretch of volatility since last November. The Nasdaq Composite added 0.5% as the oft-cited “FAANG” group of stocks edged higher. The volume totals reported were higher than the prior session on the NYSE and on the Nasdaq exchange. Breadth was negative as decliners led advancers by an 8-7 margin on the NYSE and by 13-8 on the Nasdaq exchange. There were 8 high-ranked companies from the Leaders List that hit new 52-week highs and were listed on the BreakOuts Page versus the total of 45 on the prior session. New 52-week lows outnumbered new 52-week highs on the NYSE and on the Nasdaq exchange. The major indices (M criteria) have come under greater pressure and earned the label of a "market correction". During corrections investors are reminded to avoid new buying decisions and to sell weakening stocks on a case-by-case basis, reducing exposure and raising cash as per the rules of the fact-based investment system.
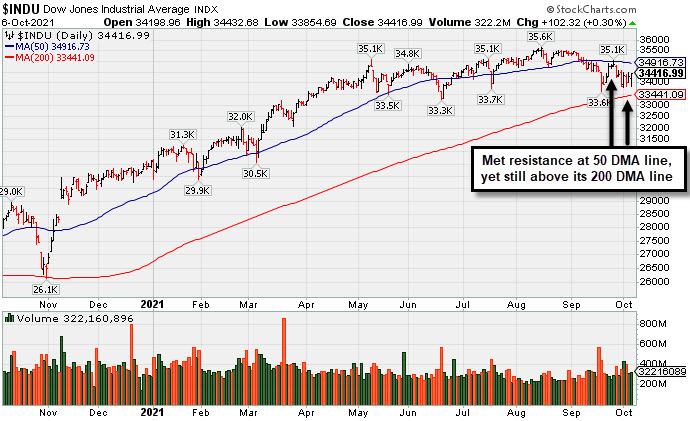
PICTURED: The Dow Jones Industrial Average met resistance at its 50 DMA line yet found support above its 200-day moving average (DMA) line. U.S. stocks reversed an early sell-off on Wednesday as investors assessed easing energy prices and a potential breakthrough on the U.S. debt ceiling impasse. In Washington, Senate Minority Leader Mitch McConnell offered a proposal to raise the debt ceiling into December, providing short-term relief to the immediate risk of default. The commodity complex offered reprieve to inflation concerns, with WTI crude falling 2.3% to $77.08/barrel after the U.S. raised the possibility of releasing its emergency oil reserves and a government report showed a larger-than-anticipated weekly increase in domestic inventories. Meanwhile, natural gas futures contracts in Europe slid from record levels after Russian President Putin said Moscow would work on stabilizing the global energy market.
Treasuries were mixed, with the yield on the 10-year note down one basis point to 1.52%, still near its highest level since June. On the data front, a report from ADP showed private U.S. payrolls increased by 568,000 in September, above consensus estimates of a 430,000 gain. Eight of 11 S&P 500 sectors closed in positive territory, with the defensive Utilities and Consumer Staples groups pacing the gains. Reopening stocks lagged, with American Airlines losing 4.4% on the heels of an analyst downgrade. |
 Kenneth J. Gruneisen started out as a licensed stockbroker in August 1987, a couple of months prior to the historic stock market crash that took the Dow Jones Industrial Average down -22.6% in a single day. He has published daily fact-based fundamental and technical analysis on high-ranked stocks online for two decades. Through FACTBASEDINVESTING.COM, Kenneth provides educational articles, news, market commentary, and other information regarding proven investment systems that work in good times and bad.
Comments contained in the body of this report are technical opinions only and are not necessarily those of Gruneisen Growth Corp. The material herein has been obtained from sources believed to be reliable and accurate, however, its accuracy and completeness cannot be guaranteed. Our firm, employees, and customers may effect transactions, including transactions contrary to any recommendation herein, or have positions in the securities mentioned herein or options with respect thereto. Any recommendation contained in this report may not be suitable for all investors and it is not to be deemed an offer or solicitation on our part with respect to the purchase or sale of any securities. |
|
 |
Retail, Semiconductor, and Gold & Silver Indexes Rose
Kenneth J. Gruneisen - Passed the CAN SLIM® Master's Exam
The Retail Index ($RLX +0.73%) posted a modest gain while the Broker/Dealer Index ($XBD +0.06%) finished flat and the Bank Index ($BKX -0.23%) edged lower. The tech sector was mixed as the Semiconductor Index ($SOX +0.36%) edged higher while the Networking Index ($NWX -0.39%) and Biotech Index ($BTK -0.47%) both edged lower. Commodity-linked groups also were mixed as the Oil Services Index ($OSX -3.53%) and Integrated Oil Index ($XOI -1.24%) lost ground while the Gold & Silver Index ($XAU +1.75%) rose.
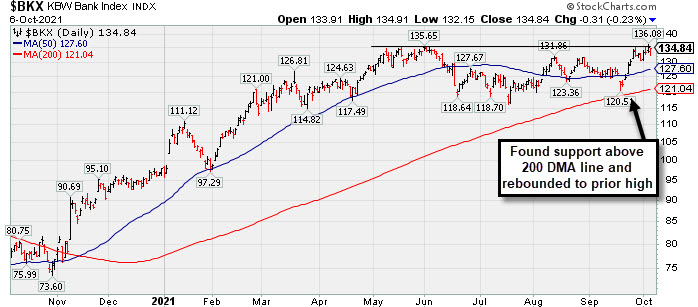
PICTURED: The Bank Index ($BKX -0.23%) found support above its 200-day moving average (DMA) line and rebounded to the prior high.
| Oil Services |
$OSX |
58.36 |
-2.14 |
-3.53% |
+31.64% |
| Integrated Oil |
$XOI |
1,148.11 |
-14.44 |
-1.24% |
+44.88% |
| Semiconductor |
$SOX |
3,238.79 |
+11.54 |
+0.36% |
+15.86% |
| Networking |
$NWX |
819.25 |
-3.25 |
-0.39% |
+14.24% |
| Broker/Dealer |
$XBD |
480.44 |
+0.28 |
+0.06% |
+27.24% |
| Retail |
$RLX |
3,877.43 |
+28.14 |
+0.73% |
+8.82% |
| Gold & Silver |
$XAU |
121.29 |
+2.09 |
+1.75% |
-15.88% |
| Bank |
$BKX |
134.84 |
-0.31 |
-0.23% |
+37.72% |
| Biotech |
$BTK |
5,543.53 |
-25.90 |
-0.47% |
-3.41% |
|
|
|
 |
Prior Lows Define Near-Term Support After 50 DMA Violation
Kenneth J. Gruneisen - Passed the CAN SLIM® Master's Exam
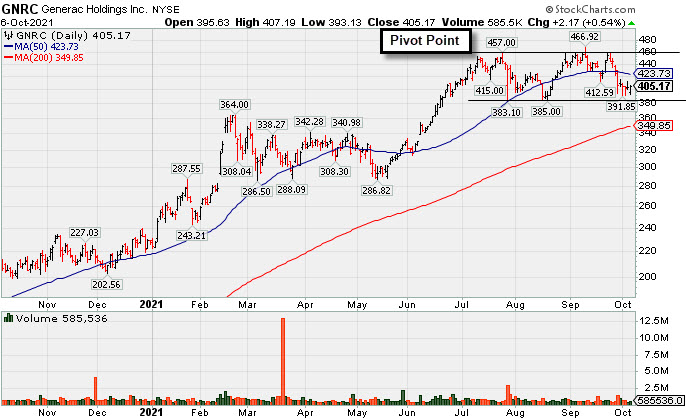
Generac Holdings Inc (GNRC +$2.17 or +0.54% to $405.17) has halted its slide after slumping below its 50-day moving average (DMA) line ($423.73). A prompt rebound above the 50 DMA line is needed for its outlook to improve. Prior lows in the $383-385 area define the next important support level to watch where any violations would raise more serious concerns.
GNRC has an Earnings Per Share Rating of 98. It reported Jun '21 quarterly earnings +71% on +68% sales revenues versus the year ago period, marking a 4th strong quarterly comparison above the +25% minimum guideline (C criteria). Annual earnings (A criteria) growth has been strong and steady. It was highlighted in yellow in the 6/08/21 mid-day report (read here) with pivot point cited based on its 4/06/21 high. It was last shown in this FSU section on 8/23/21 with an annotated graph under the headline, "Rebound Above 50-Day Moving Average Helps Outlook".
The high-ranked Electrical-Power/Equipment firm has seen the number of top-rated funds owning its shares rise from 816 in Jun '20 to 1,686 in Jun '21,a reassuring sign concerning the I criteria. Its current Up/Down Volume Ratio of 0.8 is an unbiased indication its shares have been under distributional pressure over the past 50 days. It has a Timeliness Rating of B and Sponsorship Rating of B. |
|
|
Color Codes Explained :
Y - Better candidates highlighted by our
staff of experts.
G - Previously featured
in past reports as yellow but may no longer be buyable under the
guidelines.
***Last / Change / Volume data in this table is the closing quote data***
Symbol/Exchange
Company Name
Industry Group |
PRICE |
CHANGE
(%Change) |
Day High |
Volume
(% DAV)
(% 50 day avg vol) |
52 Wk Hi
% From Hi |
Featured
Date |
Price
Featured |
Pivot Featured |
|
Max Buy |
 SIVB
-
NASDAQ
SIVB
-
NASDAQ
S V B Financial Group
BANKING - Regional - Pacific Banks
|
$659.85
|
-5.53
-0.83% |
$663.92
|
440,600
112.69% of 50 DAV
50 DAV is 391,000
|
$677.14
-2.55%
|
8/6/2021
|
$589.70
|
PP = $608.94
|
|
MB = $639.39
|
Most Recent Note - 10/5/2021 5:55:58 PM
G - Hovering near its all-time high, extended from the previously noted base. Prior highs in the $608 area define initial support to watch above its 50 DMA line ($589). Completed a new Public Offering on 8/11/21.
>>> FEATURED STOCK ARTICLE : Pullback After 5 Straight Gains into New High Territory - 9/28/2021 |
View all notes |
Set NEW NOTE alert |
Company Profile |
SEC
News |
Chart |
Request a new note
C
A
S
I |
BLDR
-
NYSE
Builders Firstsource Inc
Bldg-Constr Prds/Misc
|
$53.14
|
+0.41
0.78% |
$53.34
|
1,254,794
60.56% of 50 DAV
50 DAV is 2,072,000
|
$55.54
-4.32%
|
8/12/2021
|
$52.38
|
PP = $54.09
|
|
MB = $56.79
|
Most Recent Note - 10/1/2021 5:27:31 PM
Y - Sputtering after wedging to a new all-time high. Its 50 DMA line ($50.79) defines important near term support. Subsequent gains above the pivot point backed by at least +40% above average volume may clinch a proper technical buy signal. Fundamentals remain strong. See the latest FSU analysis for more details and a new annotated graph.
>>> FEATURED STOCK ARTICLE : Sputtering After Wedging to New Highs - 10/1/2021 |
View all notes |
Set NEW NOTE alert |
Company Profile |
SEC
News |
Chart |
Request a new note
C
A
S
I |
CROX
-
NASDAQ
Crocs Inc
CONSUMER NON-DURABLES - Textile - Apparel Footwear
|
$138.31
|
+1.39
1.02% |
$139.86
|
1,124,053
83.70% of 50 DAV
50 DAV is 1,343,000
|
$163.18
-15.24%
|
6/14/2021
|
$112.64
|
PP = $110.01
|
|
MB = $115.51
|
Most Recent Note - 10/4/2021 5:26:01 PM
G - Pulled back from its all-time high with 7 consecutive losses violating its 50 DMA line ($143). The prior low ($132.60) defines the next important support where a violation may raise more serious concerns and trigger a worrisome technical sell signal. See the latest FSU analysis for more details and a new annotated graph.
>>> FEATURED STOCK ARTICLE : Streak of Losses Violated 50-day Moving Average Line - 10/4/2021 |
View all notes |
Set NEW NOTE alert |
Company Profile |
SEC
News |
Chart |
Request a new note
C
A
S
I |
KFRC
-
NASDAQ
Kforce Inc
Comml Svcs-Staffing
|
$63.90
|
-0.04
-0.06% |
$64.43
|
99,407
87.97% of 50 DAV
50 DAV is 113,000
|
$64.38
-0.75%
|
9/10/2021
|
$59.53
|
PP = $64.48
|
|
MB = $67.70
|
Most Recent Note - 10/5/2021 6:01:21 PM
Y - Posted a 3rd consecutive gain today with below average volume for a best-ever close and its color code is changed to yellow. Subsequent gains above its pivot point backed by at least +40% above average volume are needed to trigger a proper technical buy signal. Fundamentals are strong.
>>> FEATURED STOCK ARTICLE : Staffing Firm Still Faces Some Overhead Supply - 9/13/2021 |
View all notes |
Set NEW NOTE alert |
Company Profile |
SEC
News |
Chart |
Request a new note
C
A
S
I |
GNRC
-
NYSE
Generac Hldgs Inc
Electrical-Power/Equipmt
|
$405.17
|
+2.17
0.54% |
$407.19
|
585,411
81.76% of 50 DAV
50 DAV is 716,000
|
$466.92
-13.22%
|
8/30/2021
|
$449.36
|
PP = $457.10
|
|
MB = $479.96
|
 Most Recent Note - 10/6/2021 5:09:52 PM
G - Remains below its 50 DMA line ($423.73) following damaging volume-driven losses. A prompt rebound above the 50 DMA line is needed for its outlook to improve. See the latest FSU analysis for more details and a new annotated graph.
>>> FEATURED STOCK ARTICLE : Prior Lows Define Near-Term Support After 50 DMA Violation - 10/6/2021 |
View all notes |
Set NEW NOTE alert |
Company Profile |
SEC
News |
Chart |
Request a new note
C
A
S
I |
Symbol/Exchange
Company Name
Industry Group |
PRICE |
CHANGE
(%Change) |
Day High |
Volume
(% DAV)
(% 50 day avg vol) |
52 Wk Hi
% From Hi |
Featured
Date |
Price
Featured |
Pivot Featured |
|
Max Buy |
CAMT
-
NASDAQ
Camtek Ltd
ELECTRONICS - Scientific and Technical Instrum
|
$38.68
|
-0.54
-1.38% |
$39.55
|
113,720
66.50% of 50 DAV
50 DAV is 171,000
|
$46.01
-15.93%
|
8/4/2021
|
$39.67
|
PP = $40.57
|
|
MB = $42.60
|
Most Recent Note - 10/5/2021 5:44:55 PM
G - Halted its slide today after violating prior highs in the $40 area and its 50 DMA line ($39.76) on the prior session with a big volume-driven loss raising concerns and triggering a technical sell signal. A rebound above the 50 DMA line is needed for its outlook to improve. Color code was changed to green. The prior low ($34.68 on 8/17/21) defines the next important near-term support to watch. Fundamentals remain strong. See the latest FSU analysis for more details and a new annotated graph.
>>> FEATURED STOCK ARTICLE : Fell Below Prior High and Violated 50-Day Moving Average - 10/5/2021 |
View all notes |
Set NEW NOTE alert |
Company Profile |
SEC
News |
Chart |
Request a new note
C
A
S
I |
PKI
-
NYSE
Perkinelmer Inc
ELECTRONICS - Scientific and Technical Instrum
|
$170.25
|
+0.19
0.11% |
$170.76
|
498,485
68.99% of 50 DAV
50 DAV is 722,500
|
$192.00
-11.33%
|
8/18/2021
|
$181.07
|
PP = $188.50
|
|
MB = $197.93
|
Most Recent Note - 10/6/2021 5:11:34 PM
G - A rebound above the 50 DMA line ($182.65) is needed for its outlook to improve after damaging losses. Its Relative Strength Rating has slumped to 79. Fundamentals remain strong.
>>> FEATURED STOCK ARTICLE : Stalled But Holding Ground After Recent "3 Weeks Tight" - 9/17/2021 |
View all notes |
Set NEW NOTE alert |
Company Profile |
SEC
News |
Chart |
Request a new note
C
A
S
I |
UMC
-
NYSE
United Microelectrnc Adr
ELECTRONICS - Semiconductor - Integrated Cir
|
$10.53
|
-0.36
-3.31% |
$10.66
|
13,113,548
175.95% of 50 DAV
50 DAV is 7,453,000
|
$12.62
-16.56%
|
8/5/2021
|
$11.62
|
PP = $11.38
|
|
MB = $11.95
|
Most Recent Note - 10/6/2021 5:14:45 PM
G - Gapped down today for another big loss with higher volume. Only a prompt rebound above the 50 DMA line ($11.21) would help its outlook improve.
>>> FEATURED STOCK ARTICLE : Consolidating Above 50-day Moving Average Near "Max Buy" Level - 9/27/2021 |
View all notes |
Set NEW NOTE alert |
Company Profile |
SEC
News |
Chart |
Request a new note
C
A
S
I |
BRKS
-
NASDAQ
Brooks Automation
ELECTRONICS - Semiconductor Equipment and Mate
|
$100.66
|
-1.03
-1.01% |
$102.14
|
344,512
53.83% of 50 DAV
50 DAV is 640,000
|
$110.40
-8.82%
|
9/20/2021
|
$101.21
|
PP = $108.82
|
|
MB = $114.26
|
Most Recent Note - 10/5/2021 5:50:17 PM
Y - Stalled after quietly touching a new 52-week high last week. Pivot point cited was based on its 4/27/21 high plus 10 cents. Subsequent gains above the pivot point backed by at least 40% above average volume may trigger a convicing technical buy signal.
>>> FEATURED STOCK ARTICLE : Rallying Near High After Brief Consolidation Below 200 DMA Line - 9/20/2021 |
View all notes |
Set NEW NOTE alert |
Company Profile |
SEC
News |
Chart |
Request a new note
C
A
S
I |
ENTG
-
NASDAQ
Entegris Inc
ELECTRONICS - Semiconductor Equipment and Mate
|
$120.36
|
-0.81
-0.67% |
$120.58
|
570,105
79.73% of 50 DAV
50 DAV is 715,000
|
$135.99
-11.49%
|
8/4/2021
|
$125.33
|
PP = $126.51
|
|
MB = $132.84
|
Most Recent Note - 10/4/2021 5:41:12 PM
G - Violated its 50 DMA line ($121.75) wit today's volume driven loss triggering a technical sell signal. Only a prompt rebound above the 50 DMA line would help its outlook improve. Its prior low and 200 DMA line define the next important support in the $109 area.
>>> FEATURED STOCK ARTICLE : Hit New High and Rose Above its Max Buy Level - 9/23/2021 |
View all notes |
Set NEW NOTE alert |
Company Profile |
SEC
News |
Chart |
Request a new note
C
A
S
I |
Symbol/Exchange
Company Name
Industry Group |
PRICE |
CHANGE
(%Change) |
Day High |
Volume
(% DAV)
(% 50 day avg vol) |
52 Wk Hi
% From Hi |
Featured
Date |
Price
Featured |
Pivot Featured |
|
Max Buy |
CLFD
-
NASDAQ
Clearfield Inc
TELECOMMUNICATIONS - Cables / Satalite Equipment
|
$50.04
|
+2.33
4.88% |
$50.50
|
236,741
295.93% of 50 DAV
50 DAV is 80,000
|
$48.71
2.73%
|
7/23/2021
|
$40.23
|
PP = $43.74
|
|
MB = $45.93
|
Most Recent Note - 10/6/2021 12:21:25 PM
G - Hitting another new 52-week high with today's 5th consecutive gain lifting it further above its "max buy" level. Found prompt support near its 50 DMA line ($44.12) after testing the prior low ($42.34) where more damaging losses may trigger technical sell signals. Fundamentals remain strong.
>>> FEATURED STOCK ARTICLE : Quietly Consolidating Near All-Time High - 9/14/2021 |
View all notes |
Set NEW NOTE alert |
Company Profile |
SEC
News |
Chart |
Request a new note
C
A
S
I |
SMPL
-
NASDAQ
Simply Good Foods Co
Food-Confectionery
|
$35.89
|
+0.72
2.05% |
$35.96
|
277,514
84.04% of 50 DAV
50 DAV is 330,200
|
$38.50
-6.78%
|
12/28/2020
|
$30.40
|
PP = $31.44
|
|
MB = $33.01
|
Most Recent Note - 10/6/2021 5:13:28 PM
G - Posted a quiet gain today, rebounding above its 50 DMA line ($35.50) which recently has acted as resistance. Its Relative strength Rating has slumped to 79. Recent low ($33.55 on 9/20/21) and 200 DMA line define important support where more damaging losses would raise greater concerns. Fundamentals remain strong.
>>> FEATURED STOCK ARTICLE : Still Lingering Below 50-Day Moving Average Line - 8/30/2021 |
View all notes |
Set NEW NOTE alert |
Company Profile |
SEC
News |
Chart |
Request a new note
C
A
S
I |
WDAY
-
NYSE
Workday Inc Cl A
Computer Sftwr-Enterprse
|
$256.33
|
+4.28
1.70% |
$256.55
|
1,571,489
93.13% of 50 DAV
50 DAV is 1,687,400
|
$282.77
-9.35%
|
9/7/2021
|
$275.69
|
PP = $282.87
|
|
MB = $297.01
|
Most Recent Note - 10/5/2021 5:58:40 PM
Y - Consolidating near its 50 DMA line ($252). More damaging losses below recent lows ($246) would raise greater concerns. Faces resistance due to overhead supply up to the $278 level after trading higher for the past month. Fundamentals remain strong.
>>> FEATURED STOCK ARTICLE : Gap Up and Recent Gains Challenge All-Time High - 9/7/2021 |
View all notes |
Set NEW NOTE alert |
Company Profile |
SEC
News |
Chart |
Request a new note
C
A
S
I |
CTLT
-
NYSE
Catalent Inc
DRUGS - Biotechnology
|
$129.36
|
-0.83
-0.64% |
$130.41
|
843,642
93.32% of 50 DAV
50 DAV is 904,000
|
$142.64
-9.31%
|
8/25/2021
|
$128.72
|
PP = $127.78
|
|
MB = $134.17
|
Most Recent Note - 10/5/2021 5:53:02 PM
Y - Color code is changed to yellow while consolidating after volume-driven losses. Its 50 DMA line ($129) and prior highs in the $124-127 area define important near-term support to watch. Fundamentals remain strong.
>>> FEATURED STOCK ARTICLE : Strong Gain Triggered Technical Buy Signal - 8/25/2021 |
View all notes |
Set NEW NOTE alert |
Company Profile |
SEC
News |
Chart |
Request a new note
C
A
S
I |
MEDP
-
NASDAQ
Medpace Holdings Inc
Medical-Research Eqp/Svc
|
$192.50
|
-0.80
-0.41% |
$194.47
|
107,755
61.22% of 50 DAV
50 DAV is 176,000
|
$199.04
-3.29%
|
9/10/2021
|
$196.32
|
PP = $196.22
|
|
MB = $206.03
|
Most Recent Note - 10/1/2021 5:32:57 PM
Y - Rose near its 52-week high with today's 3rd consecutive gain. Found prompt support near its 50 DMA line ($182.97). Highlighted in yellow with pivot point cited based on its 4/26/21 high plus 10 cents in the 9/10/21 mid-day report. Subsequent gains and strong close above the pivot point backed by at least +40% above average volume may trigger a technical buy signal.
>>> FEATURED STOCK ARTICLE : Negative Reversal Indicative of Distributional Pressure - 9/10/2021 |
View all notes |
Set NEW NOTE alert |
Company Profile |
SEC
News |
Chart |
Request a new note
C
A
S
I |
Symbol/Exchange
Company Name
Industry Group |
PRICE |
CHANGE
(%Change) |
Day High |
Volume
(% DAV)
(% 50 day avg vol) |
52 Wk Hi
% From Hi |
Featured
Date |
Price
Featured |
Pivot Featured |
|
Max Buy |
JEF
-
NYSE
Jefferies Financial Grp
Finance-Invest Bnk/Bkrs
|
$38.85
|
+0.55
1.44% |
$38.93
|
1,677,359
103.03% of 50 DAV
50 DAV is 1,628,000
|
$38.97
-0.31%
|
6/28/2021
|
$31.81
|
PP = $34.42
|
|
MB = $36.14
|
Most Recent Note - 10/1/2021 12:30:56 PM
G - Reported Aug '21 quarterly earnings +713% on +70% sales revenues versus the year ago period. Holding its ground stubbornly following a "negative reversal" on 9/28/21 after wedging to a new all-time high. Found support near prior highs in the $34-35 range and above its 50 DMA line ($35.69) during its recent consolidation.
>>> FEATURED STOCK ARTICLE : Perched at 52-week High With Earnings News Due - 9/29/2021 |
View all notes |
Set NEW NOTE alert |
Company Profile |
SEC
News |
Chart |
Request a new note
C
A
S
I |
AVTR
-
NYSE
Avantor Inc
Medical-Research Eqp/Svc
|
$40.73
|
+0.21
0.52% |
$40.94
|
1,658,328
43.12% of 50 DAV
50 DAV is 3,846,000
|
$44.37
-8.20%
|
6/10/2021
|
$32.94
|
PP = $34.09
|
|
MB = $35.79
|
Most Recent Note - 10/1/2021 12:04:55 PM
G - Finding support while testing support at its 50 DMA line ($39.97). A damaging violation may trigger a technical sell signal. Completed a Secondary Offering on 9/13/21 while perched at its all-time high, very extended from any sound base.
>>> FEATURED STOCK ARTICLE : Steady Progress Made Since Featured - 8/27/2021 |
View all notes |
Set NEW NOTE alert |
Company Profile |
SEC
News |
Chart |
Request a new note
C
A
S
I |
MIME
-
NASDAQ
Mimecast Limited
Computer Sftwr-Security
|
$63.82
|
+0.36
0.57% |
$64.09
|
366,883
36.29% of 50 DAV
50 DAV is 1,011,000
|
$71.45
-10.68%
|
8/2/2021
|
$56.12
|
PP = $59.58
|
|
MB = $62.56
|
Most Recent Note - 10/5/2021 5:54:29 PM
G - Consolidating near its 50 DMA line ($63.50) and above prior highs in the $59 area defining near-term support to watch. Fundamentals remain strong.
>>> FEATURED STOCK ARTICLE : Consolidating After Getting Extended from Previous Base Noted - 9/21/2021 |
View all notes |
Set NEW NOTE alert |
Company Profile |
SEC
News |
Chart |
Request a new note
C
A
S
I |
|
|
|
THESE ARE NOT BUY RECOMMENDATIONS!
Comments contained in the body of this report are technical
opinions only. The material herein has been obtained
from sources believed to be reliable and accurate, however,
its accuracy and completeness cannot be guaranteed.
This site is not an investment advisor, hence it does
not endorse or recommend any securities or other investments.
Any recommendation contained in this report may not
be suitable for all investors and it is not to be deemed
an offer or solicitation on our part with respect to
the purchase or sale of any securities. All trademarks,
service marks and trade names appearing in this report
are the property of their respective owners, and are
likewise used for identification purposes only.
This report is a service available
only to active Paid Premium Members.
You may opt-out of receiving report notifications
at any time. Questions or comments may be submitted
by writing to Premium Membership Services 665 S.E. 10 Street, Suite 201 Deerfield Beach, FL 33441-5634 or by calling 1-800-965-8307
or 954-785-1121.
|
|
|