You are not logged in.
This means you
CAN ONLY VIEW reports that were published prior to Thursday, March 20, 2025.
You
MUST UPGRADE YOUR MEMBERSHIP if you want to see any current reports.
AFTER MARKET UPDATE - THURSDAY, JUNE 24TH, 2021
Previous After Market Report Next After Market Report >>>
|
|
|
|
DOW |
+322.58 |
34,196.82 |
+0.95% |
|
Volume |
810,418,636 |
-2% |
|
Volume |
4,267,215,000 |
-3% |
|
NASDAQ |
+97.01 |
14,368.74 |
+0.68% |
|
Advancers |
2,270 |
69% |
|
Advancers |
3,037 |
71% |
|
S&P 500 |
+24.65 |
4,266.49 |
+0.58% |
|
Decliners |
1,005 |
31% |
|
Decliners |
1,250 |
29% |
|
Russell 2000 |
+30.15 |
2,333.62 |
+1.31% |
|
52 Wk Highs |
199 |
|
|
52 Wk Highs |
175 |
|
|
S&P 600 |
+18.63 |
1,387.46 |
+1.36% |
|
52 Wk Lows |
7 |
|
|
52 Wk Lows |
26 |
|
|
 |
Major Indices Rose With Less Volume Conviction
Kenneth J. Gruneisen - Passed the CAN SLIM® Master's Exam
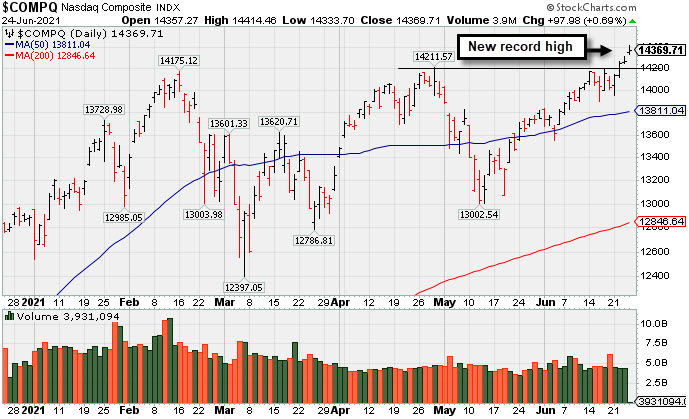
The S&P 500 and Nasdaq Composite each closed at fresh record levels, jumping 0.6% and 0.7%, respectively. The Dow rallied 322 points, and remains on course for a 2.7% weekly rebound following its worst week since October. The volume totals reported were lighter than the prior session on the NYSE and on the Nasdaq exchange. Breadth was positive as advancers led decliners by more than a 2-1 margin on the NYSE and by almost a 3-1 margin on the Nasdaq exchange. There were 37 high-ranked companies from the Leaders List that hit new 52-week highs and were listed on the BreakOuts Page, versus 38 on the prior session. New 52-week highs totals expanded and outnumbered new 52-week lows totals on the NYSE and on the Nasdaq exchange. The major indices (M criteria) are in an uptrend. Investors are reminded to always make buying and selling decisions on case-by-case basis under the strict criteria and rules of the fact-based investment system.
PICTURED: The Nasdaq Composite Index is hitting new record highs.
U.S. stocks closed near session highs on Thursday, as prospects for additional fiscal spending boosted investor sentiment. In Washington, President Biden announced that a group of bipartisan Senators reached an agreement on an infrastructure plan. The bill included $579 billion in new spending aimed at revitalizing roads and bridges, investing in the nation’s power grid and expanding broadband internet services.
On the data front, initial jobless claims eased to 411,000 in the latest week, but remained above a pandemic-era low of 388,000. Separately, a preliminary reading showed durable goods orders rose 2.3% last month, the fastest rate since January. Additionally, a final update on U.S. GDP confirmed that the economy expanded at a 6.4% annualized clip during the first quarter. Treasuries were mixed, with the yield on the 10-year note unchanged at 1.49%.
Nine of 11 S&P 500 sectors ended in positive territory. Financials paced the gains, with banks outperforming ahead of the Fed’s annual stress test results due at 4:30 pm ET. In corporate news, Eli Lilly (LLY +7.31%) after its Alzheimer’s treatment received a special FDA designation that should accelerate the therapy’s consideration for approval. Meanwhile, Darden Restaurants (DRI +3.30%) rose after beating Wall Street’s top and bottom line projections as same-store sales returned to near 2019 levels. Elsewhere, Tesla (TSLA +3.30%) rose, capping its best two-day rally since April. |
 Kenneth J. Gruneisen started out as a licensed stockbroker in August 1987, a couple of months prior to the historic stock market crash that took the Dow Jones Industrial Average down -22.6% in a single day. He has published daily fact-based fundamental and technical analysis on high-ranked stocks online for two decades. Through FACTBASEDINVESTING.COM, Kenneth provides educational articles, news, market commentary, and other information regarding proven investment systems that work in good times and bad.
Comments contained in the body of this report are technical opinions only and are not necessarily those of Gruneisen Growth Corp. The material herein has been obtained from sources believed to be reliable and accurate, however, its accuracy and completeness cannot be guaranteed. Our firm, employees, and customers may effect transactions, including transactions contrary to any recommendation herein, or have positions in the securities mentioned herein or options with respect thereto. Any recommendation contained in this report may not be suitable for all investors and it is not to be deemed an offer or solicitation on our part with respect to the purchase or sale of any securities. |
|
 |
Financial, Tech, and Energy-Linked Groups Rose
Kenneth J. Gruneisen - Passed the CAN SLIM® Master's Exam
The Bank Index ($BKX +1.54%) and Broker/Dealer Index ($XBD +0.93%) both posted solid gains while the Retail Index ($RLX -0.65%) edged lower. The Semiconductor Index ($SOX +1.77%) posted a standout gain while the Networking Index ($NWX +0.58%) and Biotech Index ($BTK +0.57%) edged higher. The Oil Services Index ($OSX +2.00%) and Integrated Oil Index ($XOI +1.38%) both posted solid gains while the Gold & Silver Index ($XAU +0.22%) edged higher. PICTURED: The Retail Index ($RLX -0.65%) has been making progress toward its record high after a brief pullback undercut its 50-day moving average (DMA) line.
| Oil Services |
$OSX |
66.98 |
+1.32 |
+2.00% |
+51.09% |
| Integrated Oil |
$XOI |
1,166.34 |
+15.90 |
+1.38% |
+47.18% |
| Semiconductor |
$SOX |
3,253.80 |
+56.58 |
+1.77% |
+16.39% |
| Networking |
$NWX |
854.86 |
+4.97 |
+0.58% |
+19.21% |
| Broker/Dealer |
$XBD |
472.53 |
+4.34 |
+0.93% |
+25.14% |
| Retail |
$RLX |
3,956.20 |
-25.95 |
-0.65% |
+11.03% |
| Gold & Silver |
$XAU |
143.23 |
+0.31 |
+0.22% |
-0.66% |
| Bank |
$BKX |
125.23 |
+1.90 |
+1.54% |
+27.90% |
| Biotech |
$BTK |
5,938.35 |
+33.81 |
+0.57% |
+3.47% |
|
|
|
 |
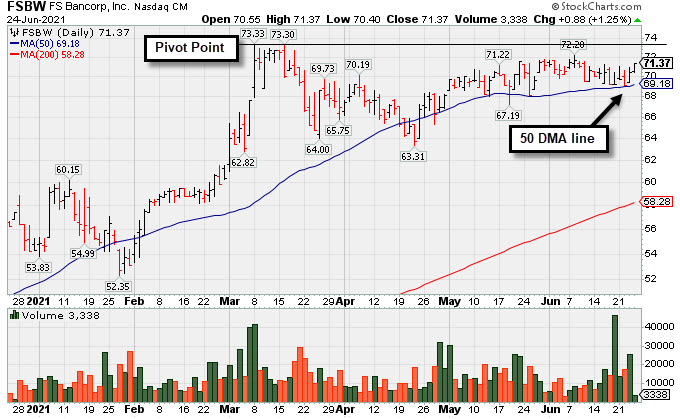
Still Consolidating With Close Striking Distance of All-Time High
Kenneth J. Gruneisen - Passed the CAN SLIM® Master's Exam
F S Bancorp (FSBW +$0.88 or +1.25% to $71.37) posted a quiet gain today. This thinly-traded Bank is still perched within close striking distance of the pivot point cited based on its 3/08/21 high plus 10 cents. It has been consolidating above its 50-day moving average (DMA) line ($69.25) where it found prompt support during its ongoing ascent. Subsequent gains above the pivot point backed by at least +40% above average volume are needed to trigger a technical buy signal.
Fundamentals remain strong. FSBW has an Earnings Per Share Rating of 97. It reported Mar '21 quarterly earnings +137% on +16% sales revenues versus the year ago period, its 4th consecutive strong quarterly comparison above the +25% minimum earnings guideline (C criteria), matching the fact-based investment system's winning models. Its annual earnings (A criteria) history has been great. It completed a new Public Offering on 9/08/17.
The number of top-rated funds owning its shares rose from 168 in Jun '20 to 187 in Mar '21, a reassuring sign concerning the I criteria. Its small supply of only 4.2 million shares outstanding can contribute to greater price volatility in the event of institutional buying or selling. It has a Timeliness Rating of A and Sponsorship Rating of B.
|
|
|
Color Codes Explained :
Y - Better candidates highlighted by our
staff of experts.
G - Previously featured
in past reports as yellow but may no longer be buyable under the
guidelines.
***Last / Change / Volume data in this table is the closing quote data***
Symbol/Exchange
Company Name
Industry Group |
PRICE |
CHANGE
(%Change) |
Day High |
Volume
(% DAV)
(% 50 day avg vol) |
52 Wk Hi
% From Hi |
Featured
Date |
Price
Featured |
Pivot Featured |
|
Max Buy |
 ABCB
-
NASDAQ
ABCB
-
NASDAQ
Ameris Bancorp
BANKING - Regional - Mid-Atlantic Banks
|
$51.68
|
-0.21
-0.40% |
$52.33
|
595,151
137.13% of 50 DAV
50 DAV is 434,000
|
$59.85
-13.65%
|
5/21/2021
|
$58.86
|
PP = $57.91
|
|
MB = $60.81
|
Most Recent Note - 6/21/2021 5:15:38 PM
G - Rebounded impressively with today's big gain after last week's damaging losses triggered a worrisome technical sell signal. Only a prompt rebound above the 50 DMA line (54.14) would help its outlook improve.
>>> FEATURED STOCK ARTICLE : Breakout to New All-Time High for Another Regional Bank - 5/21/2021 |
View all notes |
Set NEW NOTE alert |
Company Profile |
SEC
News |
Chart |
Request a new note
C
A
S
I |
SIVB
-
NASDAQ
S V B Financial Group
BANKING - Regional - Pacific Banks
|
$560.16
|
+3.93
0.71% |
$563.96
|
231,314
54.81% of 50 DAV
50 DAV is 422,000
|
$608.84
-8.00%
|
4/23/2021
|
$579.70
|
PP = $577.16
|
|
MB = $606.02
|
Most Recent Note - 6/21/2021 5:18:32 PM
G - Posted a gain today with lighter volume after damaging volume-drive losses last week raised concerns. A prompt rebound above its 50 DMA line ($562) is needed for its outlook to improve. Confirming gains above the pivot point backed by at least +40% above average volume are still needed to help clinch a convincing technical buy signal. Reported earnings +293% on +64% sales revenues for the Mar '21 quarter versus the year ago period, its 3rd strong comparison. Completed a new Public Offering on 3/24/21.
>>> FEATURED STOCK ARTICLE : Sputtering Since Featured Without Confirming Gains - 5/20/2021 |
View all notes |
Set NEW NOTE alert |
Company Profile |
SEC
News |
Chart |
Request a new note
C
A
S
I |
LOGI
-
NASDAQ
Logitech Intl Sa
COMPUTER HARDWARE - Computer Peripherals
|
$125.20
|
-0.90
-0.71% |
$126.16
|
398,949
47.49% of 50 DAV
50 DAV is 840,000
|
$140.17
-10.68%
|
5/26/2021
|
$119.13
|
PP = $120.34
|
|
MB = $126.36
|
Most Recent Note - 6/17/2021 6:26:39 PM
G - Pulled back from its all-time high, slumping near its previously noted "max buy" level. Prior highs in the $120-117 area define support to watch on pullbacks along with its 50 DMA line ($116.52).
>>> FEATURED STOCK ARTICLE : Streak of Gains to New Highs Lacked Great Volume Conviction - 5/27/2021 |
View all notes |
Set NEW NOTE alert |
Company Profile |
SEC
News |
Chart |
Request a new note
C
A
S
I |
CROX
-
NASDAQ
Crocs Inc
CONSUMER NON-DURABLES - Textile - Apparel Footwear
|
$111.25
|
+0.86
0.78% |
$112.85
|
999,287
55.98% of 50 DAV
50 DAV is 1,785,000
|
$115.37
-3.57%
|
6/14/2021
|
$112.64
|
PP = $110.01
|
|
MB = $115.51
|
Most Recent Note - 6/21/2021 5:20:30 PM
Y - Posted a gain today with lighter volume, halting a streak of 4 consecutive losses. Stalled after hitting a new all-time high on 6/14/21 and slumped back into the previously noted base raising concerns. Its 50 DMA line ($98.32) defines initial support above the prior low ($94.92 on 5/20/21).
>>> FEATURED STOCK ARTICLE : Encountered Distributional Pressure Late This Week - 5/28/2021 |
View all notes |
Set NEW NOTE alert |
Company Profile |
SEC
News |
Chart |
Request a new note
C
A
S
I |
RCKY
-
NASDAQ
Rocky Brands Inc
CONSUMER NON-DURABLES - Textile - Apparel Footwear
|
$55.09
|
-1.25
-2.22% |
$57.27
|
103,119
117.18% of 50 DAV
50 DAV is 88,000
|
$69.00
-20.16%
|
5/5/2021
|
$61.65
|
PP = $61.55
|
|
MB = $64.63
|
Most Recent Note - 6/21/2021 5:21:50 PM
G - Posted a gain today with light volume, still sputtering below its 50 DMA line ($56.37). A rebound above that short-term average is needed for its outlook to improve. The prior low ($50.52 on 5/19/21) defines the next important support where any violation may trigger a more worrisome technical sell signal. Fundamentals remain strong.
>>> FEATURED STOCK ARTICLE : Still Sputtering After Slump Below 50-Day Moving Average - 6/7/2021 |
View all notes |
Set NEW NOTE alert |
Company Profile |
SEC
News |
Chart |
Request a new note
C
A
S
I |
Symbol/Exchange
Company Name
Industry Group |
PRICE |
CHANGE
(%Change) |
Day High |
Volume
(% DAV)
(% 50 day avg vol) |
52 Wk Hi
% From Hi |
Featured
Date |
Price
Featured |
Pivot Featured |
|
Max Buy |
CRL
-
NYSE
Charles River Labs Intl
DRUGS - Biotechnology
|
$366.95
|
+2.95
0.81% |
$368.14
|
368,396
52.48% of 50 DAV
50 DAV is 702,000
|
$364.65
0.63%
|
6/9/2021
|
$345.91
|
PP = $349.23
|
|
MB = $366.69
|
Most Recent Note - 6/21/2021 5:11:52 PM
Y - Posted yet another gain today with below average volume, wedging to new highs. Gains above the pivot point backed by at least +40% above average volume are needed to trigger a proper new (or add-on) technical buy signal. Its 50 DMA line ($333) defines near-term support to watch on pullbacks. Two of the past 3 quarterly comparisons through Mar '21 have been above the +25% minimum earnings guideline (C criteria).
>>> FEATURED STOCK ARTICLE : Building New Base After Strong Quarterly Earnings Report - 6/9/2021 |
View all notes |
Set NEW NOTE alert |
Company Profile |
SEC
News |
Chart |
Request a new note
C
A
S
I |
GNRC
-
NYSE
Generac Hldgs Inc
Electrical-Power/Equipmt
|
$406.12
|
+9.35
2.36% |
$407.70
|
869,092
124.69% of 50 DAV
50 DAV is 697,000
|
$399.58
1.64%
|
6/8/2021
|
$348.46
|
PP = $342.38
|
|
MB = $359.50
|
Most Recent Note - 6/18/2021 4:48:00 PM
G - Getting more extended from the previously noted base, it hit another new all-time high with +111% above average volume behind today's 7th consecutive gain. Prior highs define initial support to watch on pullbacks. Fundamentals remain strong.
>>> FEATURED STOCK ARTICLE : Gap Up Gain With +118% Above Average Volume - 6/8/2021 |
View all notes |
Set NEW NOTE alert |
Company Profile |
SEC
News |
Chart |
Request a new note
C
A
S
I |
CAMT
-
NASDAQ
Camtek Ltd
ELECTRONICS - Scientific and Technical Instrum
|
$35.96
|
-0.01
-0.03% |
$36.50
|
146,757
46.01% of 50 DAV
50 DAV is 319,000
|
$40.47
-11.14%
|
4/28/2021
|
$35.03
|
PP = $35.34
|
|
MB = $37.11
|
Most Recent Note - 6/21/2021 5:08:16 PM
G - Suffered a 6th consecutive loss today undercutting prior highs in the $35-36 area raising some concerns. Its 50 DMA line ($33.57) defines the next important support to watch.
>>> FEATURED STOCK ARTICLE : Perched at 52-Week High After 4th Consecutive Gain - 6/1/2021 |
View all notes |
Set NEW NOTE alert |
Company Profile |
SEC
News |
Chart |
Request a new note
C
A
S
I |
ASML
-
NASDAQ
A S M L Holding N.V. NY
ELECTRONICS - Semiconductor Equipment and Mate
|
$681.65
|
-4.16
-0.61% |
$689.23
|
523,547
62.18% of 50 DAV
50 DAV is 842,000
|
$710.97
-4.12%
|
5/25/2021
|
$669.59
|
PP = $675.75
|
|
MB = $709.54
|
Most Recent Note - 6/18/2021 3:25:36 PM
Y - Gapped down today retreating from its all time high and testing the prior high ($675) with a big loss on heavier volume. Highlighted in yellow with pivot point cited based on its 4/26/21 high plus 10 cents. Subsequent gain and a strong close above its pivot point backed by at least +40% above average volume is needed to trigger a proper technical buy signal. Its 50 DMA line ($657) defines important near-term support to watch.
>>> FEATURED STOCK ARTICLE : Perched Near All-Time High After Short Base Above 50-Day Average - 5/26/2021 |
View all notes |
Set NEW NOTE alert |
Company Profile |
SEC
News |
Chart |
Request a new note
C
A
S
I |
BRKS
-
NASDAQ
Brooks Automation
ELECTRONICS - Semiconductor Equipment and Mate
|
$92.78
|
-0.93
-0.99% |
$94.26
|
910,599
113.97% of 50 DAV
50 DAV is 799,000
|
$108.72
-14.66%
|
4/5/2021
|
$99.31
|
PP = $91.88
|
|
MB = $96.47
|
Most Recent Note - 6/18/2021 3:20:54 PM
G - Gapped down today slumping well below its 50 DMA line ($97.31) with a big loss raising concerns. Only a prompt rebound above the 50 DMA line would help its outlook improve. More damaging losses below the recent low ($86.12 on 5/12/21) would trigger a more worrisome technical sell signal.
>>> FEATURED STOCK ARTICLE : Consolidating Above 50-Day Moving Average Line and Prior High - 6/3/2021 |
View all notes |
Set NEW NOTE alert |
Company Profile |
SEC
News |
Chart |
Request a new note
C
A
S
I |
Symbol/Exchange
Company Name
Industry Group |
PRICE |
CHANGE
(%Change) |
Day High |
Volume
(% DAV)
(% 50 day avg vol) |
52 Wk Hi
% From Hi |
Featured
Date |
Price
Featured |
Pivot Featured |
|
Max Buy |
OPY
-
NYSE
Oppenheimer Holdings Inc
FINANCIAL SERVICES - Investment Brokerage - Regiona
|
$50.60
|
+0.65
1.30% |
$50.92
|
71,380
63.73% of 50 DAV
50 DAV is 112,000
|
$55.75
-9.24%
|
6/7/2021
|
$48.74
|
PP = $52.55
|
|
MB = $55.18
|
Most Recent Note - 6/18/2021 4:51:38 PM
Y - Pulled back abruptly with above average volume behind 2 consecutive losses, slumping below prior highs and back into the prior base raising concerns. Its 50 DMA line ($48.48) defines important near term support. Fundamentals remain strong.
>>> FEATURED STOCK ARTICLE : Abrupt Slump Back Into Latest Base With 2 Volume-Driven Losses - 6/18/2021 |
View all notes |
Set NEW NOTE alert |
Company Profile |
SEC
News |
Chart |
Request a new note
C
A
S
I |
MED
-
NYSE
Medifast Inc
SPECIALTY RETAIL - Specialty Retail, Other
|
$279.99
|
+9.02
3.33% |
$282.25
|
106,756
88.96% of 50 DAV
50 DAV is 120,000
|
$336.99
-16.91%
|
5/11/2021
|
$285.72
|
PP = $279.56
|
|
MB = $293.54
|
Most Recent Note - 6/18/2021 3:40:05 PM
G - Color code is changed to green after slumping further below the prior high in the $279 area and violating its 50 DMA line ($275) raising greater concerns and triggering a technical sell signal. A rebound above the 50 DMA line is needed for its outlook to improve.
>>> FEATURED STOCK ARTICLE : Halted 10-Session Losing Streak Near Prior High and 50 DMA - 6/15/2021 |
View all notes |
Set NEW NOTE alert |
Company Profile |
SEC
News |
Chart |
Request a new note
C
A
S
I |
CLFD
-
NASDAQ
Clearfield Inc
TELECOMMUNICATIONS - Cables / Satalite Equipment
|
$35.86
|
+0.28
0.79% |
$36.19
|
84,925
58.98% of 50 DAV
50 DAV is 144,000
|
$43.64
-17.83%
|
6/4/2021
|
$40.01
|
PP = $40.36
|
|
MB = $42.38
|
Most Recent Note - 6/22/2021 6:36:27 PM
G - Posted a gain today. Its 50 DMA line ($35.97) may act as resistance, while a convincing rebound above its would help its outlook improve. Fundamentals remain strong. See the latest FSU analysis for ore details and a new annotated graph.
>>> FEATURED STOCK ARTICLE : Stalled and Found Support Above 50-Day Moving Average - 5/24/2021 |
View all notes |
Set NEW NOTE alert |
Company Profile |
SEC
News |
Chart |
Request a new note
C
A
S
I |
POOL
-
NASDAQ
Pool Corp
WHOLESALE - Basic Materials Wholesale
|
$454.90
|
-4.86
-1.06% |
$462.43
|
192,120
74.18% of 50 DAV
50 DAV is 259,000
|
$464.03
-1.97%
|
6/21/2021
|
$455.09
|
PP = $449.54
|
|
MB = $472.02
|
Most Recent Note - 6/21/2021 5:10:22 PM
Y - Color code was changed to yellow with pivot point cited based on its 5/10/21 high plus 10 cents. Hit a new 52-week high with today's 3rd consecutive volume-driven gain after an orderly consolidation. The gain and close above the pivot point backed by +85% above average volume clinched a technical buy signal. Reported earnings +227% on +57% sales revenues for the Mar '21 quarter versus the year ago period, its 3rd consecutive comparison well above the +25% minimum earnings guideline (C criteria), helping it better match the fact-based investment system's fundamental guidelines. See the latest FSU analysis for more details and a new annotated graph.
>>> FEATURED STOCK ARTICLE : Volume-Driven Breakout After Orderly Consolidation - 6/21/2021 |
View all notes |
Set NEW NOTE alert |
Company Profile |
SEC
News |
Chart |
Request a new note
C
A
S
I |
FSBW
-
NASDAQ
F S Bancorp
Banks-West/Southwest
|
$70.49
|
+1.36
1.97% |
$71.01
|
25,477
195.98% of 50 DAV
50 DAV is 13,000
|
$73.62
-4.25%
|
5/18/2021
|
$70.16
|
PP = $73.72
|
|
MB = $77.41
|
Most Recent Note - 6/18/2021 12:43:28 PM
Y - This thinly-traded Bank is still perched within close striking distance of the pivot point cited based on its 3/08/21 high plus 10 cents. It has been consolidating above its 50 DMA line ($69.01) where it found prompt support during its ongoing ascent. Subsequent gains above the pivot point backed by at least +40% above average volume are needed to trigger a technical buy signal. Fundamentals remain strong.
>>> FEATURED STOCK ARTICLE : Thinly-Traded Bank Consolidating Above 50-Day Moving Average - 5/18/2021 |
View all notes |
Set NEW NOTE alert |
Company Profile |
SEC
News |
Chart |
Request a new note
C
A
S
I |
Symbol/Exchange
Company Name
Industry Group |
PRICE |
CHANGE
(%Change) |
Day High |
Volume
(% DAV)
(% 50 day avg vol) |
52 Wk Hi
% From Hi |
Featured
Date |
Price
Featured |
Pivot Featured |
|
Max Buy |
SMPL
-
NASDAQ
Simply Good Foods Co
Food-Confectionery
|
$36.11
|
-0.28
-0.77% |
$36.89
|
716,504
141.88% of 50 DAV
50 DAV is 505,000
|
$37.83
-4.55%
|
12/28/2020
|
$30.40
|
PP = $31.44
|
|
MB = $33.01
|
 Most Recent Note - 6/23/2021 12:26:52 PM
G - Hovering near its all-time high today following a streak of 8 consecutive gains. Near-term support to watch is its 50 DMA line ($34.38) and the prior low ($31.09 on 5/18/21). Reported Feb '21 quarterly earnings +9% on +2% sales revenues versus the year ago period, below the +25% minimum earnings guideline (C criteria), raising fundamental concerns.
>>> FEATURED STOCK ARTICLE : Simply Wedging Into New High Territory - 6/14/2021 |
View all notes |
Set NEW NOTE alert |
Company Profile |
SEC
News |
Chart |
Request a new note
C
A
S
I |
SHOP
-
NYSE
Shopify Inc Cl A
Computer Sftwr-Enterprse
|
$1,500.53
|
-7.91
-0.52% |
$1,534.96
|
1,371,611
95.45% of 50 DAV
50 DAV is 1,437,000
|
$1,552.23
-3.33%
|
6/16/2021
|
$1,343.80
|
PP = $1,499.85
|
|
MB = $1,574.84
|
Most Recent Note - 6/23/2021 12:24:20 PM
Y - The prior gain and close above the pivot point was backed by +51% above average volume helping clinch a technical buy signal. Perched at its all-time high today following a streak of 9 consecutive gains marked by volume. Prior highs define initial support to watch on pullbacks.
>>> FEATURED STOCK ARTICLE : Rebounding After Choppy 4-Month Consolidation - 6/16/2021 |
View all notes |
Set NEW NOTE alert |
Company Profile |
SEC
News |
Chart |
Request a new note
C
A
S
I |
YETI
-
NYSE
Yeti Holdings Inc
Leisure-Products
|
$89.43
|
-0.51
-0.57% |
$90.70
|
765,510
54.88% of 50 DAV
50 DAV is 1,395,000
|
$95.76
-6.61%
|
5/13/2021
|
$84.20
|
PP = $90.65
|
|
MB = $95.18
|
Most Recent Note - 6/21/2021 5:23:28 PM
G - Posted a gain today with lighter volume breaking a streak of 5 consecutive losses. Only a prompt rebound above the 50 DMA line ($87.59) would help its outlook improve. Prior highs in the $80 area define near-term support to watch on pullbacks. Reported Mar 21 quarterly earnings +245% on +42% sales revenues versus the year ago period, continuing its strong earnings track record.
>>> FEATURED STOCK ARTICLE : Hovering Near High After Finding Support at 50-Day Moving Average - 6/4/2021 |
View all notes |
Set NEW NOTE alert |
Company Profile |
SEC
News |
Chart |
Request a new note
C
A
S
I |
MRBK
-
NASDAQ
Meridian Corp
Banks-Northeast
|
$26.83
|
+0.19
0.71% |
$27.14
|
35,851
128.04% of 50 DAV
50 DAV is 28,000
|
$29.18
-8.05%
|
5/18/2021
|
$25.58
|
PP = $28.06
|
|
MB = $29.46
|
Most Recent Note - 6/22/2021 11:46:29 AM
Y - Churned higher than average volume while recently consolidating in a tight range near its 50 DMA line ($26.33). Stalled since reaching a new 52-week high when featured on 5/18/21. Reported Mar '21 earnings +323% on +93% sales revenues versus the year ago period, continuing its strong earnings track record. Recent low ($24.01 on 4/21/21) defines important near-term support where any violation may trigger a worrisome technical sell signal. Its Relative Strength Rating is 75, below the 80 minimum guideline.
>>> FEATURED STOCK ARTICLE : Stalled Yet Found Support at 50-Day Moving Average Line - 6/11/2021 |
View all notes |
Set NEW NOTE alert |
Company Profile |
SEC
News |
Chart |
Request a new note
C
A
S
I |
CLAR
-
NASDAQ
Clarus Corporation
Leisure-Products
|
$24.37
|
-0.50
-2.01% |
$25.06
|
190,386
99.16% of 50 DAV
50 DAV is 192,000
|
$26.07
-6.52%
|
5/12/2021
|
$21.40
|
PP = $19.73
|
|
MB = $20.72
|
Most Recent Note - 6/21/2021 5:16:54 PM
G - Posted a 2nd consecutive gain today, rebounding after encountering distributional pressure. Still extended from the prior base, its 50 DMA line ($21.29) and prior high ($19.63 on 3/09/21) define support to watch.
>>> FEATURED STOCK ARTICLE : Encountering Distributional Pressure After Recent Rally - 6/17/2021 |
View all notes |
Set NEW NOTE alert |
Company Profile |
SEC
News |
Chart |
Request a new note
C
A
S
I |
Symbol/Exchange
Company Name
Industry Group |
PRICE |
CHANGE
(%Change) |
Day High |
Volume
(% DAV)
(% 50 day avg vol) |
52 Wk Hi
% From Hi |
Featured
Date |
Price
Featured |
Pivot Featured |
|
Max Buy |
AVTR
-
NYSE
Avantor Inc
Medical-Research Eqp/Svc
|
$35.16
|
-0.09
-0.26% |
$35.62
|
3,212,122
80.95% of 50 DAV
50 DAV is 3,968,000
|
$35.32
-0.45%
|
6/10/2021
|
$32.94
|
PP = $34.09
|
|
MB = $35.79
|
Most Recent Note - 6/17/2021 6:24:37 PM
Y - Posted a 2nd consecutive gain today backed by +45% above average volume triggering a technical buy signal. Prior highs in the $33 area define initial support to watch on pullbacks.
>>> FEATURED STOCK ARTICLE : Medical Research Firm Challenging Prior High - 6/10/2021 |
View all notes |
Set NEW NOTE alert |
Company Profile |
SEC
News |
Chart |
Request a new note
C
A
S
I |
|
|
|
THESE ARE NOT BUY RECOMMENDATIONS!
Comments contained in the body of this report are technical
opinions only. The material herein has been obtained
from sources believed to be reliable and accurate, however,
its accuracy and completeness cannot be guaranteed.
This site is not an investment advisor, hence it does
not endorse or recommend any securities or other investments.
Any recommendation contained in this report may not
be suitable for all investors and it is not to be deemed
an offer or solicitation on our part with respect to
the purchase or sale of any securities. All trademarks,
service marks and trade names appearing in this report
are the property of their respective owners, and are
likewise used for identification purposes only.
This report is a service available
only to active Paid Premium Members.
You may opt-out of receiving report notifications
at any time. Questions or comments may be submitted
by writing to Premium Membership Services 665 S.E. 10 Street, Suite 201 Deerfield Beach, FL 33441-5634 or by calling 1-800-965-8307
or 954-785-1121.
|
|
|