***Last / Change / Volume data in this table is the closing quote data***
Symbol/Exchange
Company Name
Industry Group |
PRICE |
CHANGE
(%Change) |
Day High |
Volume
(% DAV)
(% 50 day avg vol) |
52 Wk Hi
% From Hi |
Featured
Date |
Price
Featured |
Pivot Featured |
|
Max Buy |
THO
-
NYSE
Thor Industries Inc
AUTOMOTIVE - Recreational Vehicles
|
$105.44
|
+1.53
1.47% |
$105.76
|
446,184
54.48% of 50 DAV
50 DAV is 819,000
|
$115.74
-8.90%
|
6/7/2017
|
$102.95
|
PP = $98.92
|
|
MB = $103.87
|
 Most Recent Note - 7/14/2017 3:03:21 PM
G - Color code is changed to green after quietly rebounding above its "max buy" level. Faces resistance due to overhead supply up through the $115 level.
>>> FEATURED STOCK ARTICLE : Some Overhead Supply Remains After Latest Technical Breakout - 6/8/2017 |
View all notes |
Set NEW NOTE alert |
Company Profile |
SEC
News |
Chart |
Request a new note
C
A
S
I |
SBCF
-
NASDAQ
Seacoast Banking Corp Fl
BANKING - Regional - Mid-Atlantic Banks
|
$23.82
|
-0.12
-0.50% |
$24.00
|
126,837
42.28% of 50 DAV
50 DAV is 300,000
|
$25.88
-7.96%
|
6/9/2017
|
$24.13
|
PP = $25.98
|
|
MB = $27.28
|
Most Recent Note - 7/14/2017 3:00:58 PM
Y - Still quietly consolidating near its 50 DMA line ($23.74) and perched within striking distance of the new pivot point cited based on its 4/25/17 high. Previously noted - "Subsequent volume-driven gains for new highs may trigger a new technical buy signal. "
>>> FEATURED STOCK ARTICLE : Florida Bank Perched -6.6% Off All-Time High - 7/6/2017 |
View all notes |
Set NEW NOTE alert |
Company Profile |
SEC
News |
Chart |
Request a new note
C
A
S
I |
BERY
-
NYSE
Berry Global Group Inc
CONSUMER NON-DURABLES - Packaging and Containers
|
$57.62
|
-0.28
-0.48% |
$57.93
|
1,214,308
118.93% of 50 DAV
50 DAV is 1,021,000
|
$58.95
-2.26%
|
7/14/2017
|
$57.67
|
PP = $59.05
|
|
MB = $62.00
|
Most Recent Note - 7/14/2017 2:59:47 PM
Y - New pivot point is cited based on its 6/05/17 high plus 10 cents. Volume-driven gains for new highs may trigger a new (or add-on) technical buy signal. Volume totals have generally been cooling while consolidating above its 50 DMA line ($57.33). More damaging losses below the recent low ($56.14 on 7/06/17) would raise greater concerns and trigger a worrisome technical sell signal.
>>> FEATURED STOCK ARTICLE : Found Prompt Support at 50-Day Moving Average Line - 7/7/2017 |
View all notes |
Set NEW NOTE alert |
Company Profile |
SEC
News |
Chart |
Request a new note
C
A
S
I |
EW
-
NYSE
Edwards Lifesciences Cp
HEALTH SERVICES - Medical Appliances and Equipment
|
$116.92
|
+0.89
0.77% |
$117.35
|
864,239
77.27% of 50 DAV
50 DAV is 1,118,400
|
$121.75
-3.97%
|
7/11/2017
|
$117.23
|
PP = $121.85
|
|
MB = $127.94
|
Most Recent Note - 7/13/2017 12:03:49 PM
Y - Color code was changed to yellow with new pivot point based on its 10/10/16 all-time high plus 10 cents. Subsequent volume-driven gains for new highs may trigger a new (or add-on) technical buy signal which could mark the beginning of a considerable new leg up. Volume totals have been mostly below average in recent weeks while holding its ground in a tight range perched within close striking distance of its all-time high. Its 50 DMA line ($115.38) defines near-term support to watch above recent lows in the $112 area.
>>> FEATURED STOCK ARTICLE : Medical Products Firm Perched Near All-Time High - 6/26/2017 |
View all notes |
Set NEW NOTE alert |
Company Profile |
SEC
News |
Chart |
Request a new note
C
A
S
I |
NTES
-
NASDAQ
Netease Inc Adr
INTERNET - Internet Information Providers
|
$310.35
|
+3.00
0.98% |
$313.00
|
854,136
62.39% of 50 DAV
50 DAV is 1,369,000
|
$337.55
-8.06%
|
6/8/2017
|
$310.76
|
PP = $307.62
|
|
MB = $323.00
|
Most Recent Note - 7/12/2017 6:07:31 PM
Y - Found prompt support at its 50 DMA line ($295) recently and it quietly rebounded above its pivot point. Disciplined investors limit losses by selling any stock that falls more than -7% from their purchase price. Recent gains lacked great volume conviction.
>>> FEATURED STOCK ARTICLE : Encountered Distributional Pressure After Hitting New Highs - 6/9/2017 |
View all notes |
Set NEW NOTE alert |
Company Profile |
SEC
News |
Chart |
Request a new note
C
A
S
I |
Symbol/Exchange
Company Name
Industry Group |
PRICE |
CHANGE
(%Change) |
Day High |
Volume
(% DAV)
(% 50 day avg vol) |
52 Wk Hi
% From Hi |
Featured
Date |
Price
Featured |
Pivot Featured |
|
Max Buy |
STMP
-
NASDAQ
Stamps.com Inc
INTERNET - Internet Software and Services
|
$149.10
|
+2.80
1.91% |
$149.60
|
279,297
44.90% of 50 DAV
50 DAV is 622,000
|
$156.40
-4.67%
|
5/24/2017
|
$133.10
|
PP = $136.10
|
|
MB = $142.91
|
Most Recent Note - 7/12/2017 6:08:29 PM
G - Consolidating above its "max buy" level and volume totals have been cooling. Its prior high ($136 on 2/22/17) defines near term support along with its 50 DMA line ($135).
>>> FEATURED STOCK ARTICLE : Pulling Back After Getting Extended From Prior Base - 7/5/2017 |
View all notes |
Set NEW NOTE alert |
Company Profile |
SEC
News |
Chart |
Request a new note
C
A
S
I |
MELI
-
NASDAQ
Mercadolibre Inc
INTERNET - Internet Software and; Services
|
$273.58
|
+2.04
0.75% |
$274.17
|
475,955
68.09% of 50 DAV
50 DAV is 699,000
|
$297.95
-8.18%
|
6/15/2017
|
$261.73
|
PP = $297.95
|
|
MB = $312.85
|
Most Recent Note - 7/12/2017 5:56:26 PM
G - Posted a 5th consecutive gain, and today's considerable gain had higher volume as its rebounded above its 50 DMA line ($271) helping its outlook to improve.
>>> FEATURED STOCK ARTICLE : Test of 10-Week Moving Average May Be a Secondary Buy Point - 6/15/2017 |
View all notes |
Set NEW NOTE alert |
Company Profile |
SEC
News |
Chart |
Request a new note
C
A
S
I |
HTHT
-
NASDAQ
China Lodging Group Ads
LEISURE - Lodging
|
$85.08
|
+4.64
5.77% |
$85.23
|
226,727
93.69% of 50 DAV
50 DAV is 242,000
|
$88.08
-3.41%
|
9/29/2016
|
$46.12
|
PP = $47.82
|
|
MB = $50.21
|
Most Recent Note - 7/14/2017 2:52:54 PM
G - Rebounding toward its prior highs after finding prompt support at its 50 DMA line ($78.69). Below that important short-term average the prior low ($75.01 on 6/15/17) defines the next support level to watch.
>>> FEATURED STOCK ARTICLE : China-Based Hotel Firm is Extended From Any Sound Base - 6/28/2017 |
View all notes |
Set NEW NOTE alert |
Company Profile |
SEC
News |
Chart |
Request a new note
C
A
S
I |
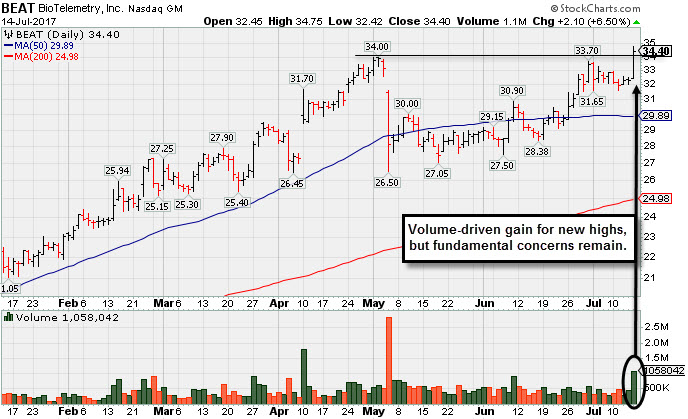
BEAT
-
NASDAQ
BioTelemetry Inc
Medical-Services
|
$34.40
|
+2.10
6.50% |
$34.75
|
1,058,042
207.46% of 50 DAV
50 DAV is 510,000
|
$34.00
1.18%
|
2/14/2017
|
$25.10
|
PP = $24.55
|
|
MB = $25.78
|
Most Recent Note - 7/14/2017 5:42:08 PM
G - Hit a new high today with twice average volume. Its 50 DMA line ($29.89) and prior lows in the $26.50 - $27.00 area define near-term support levels to watch. Raised fundamental concerns with sub par Mar '17 earnings that were repeatedly noted. See the latest FSU analysis for more details and a new annotated graph.
>>> FEATURED STOCK ARTICLE : New Highs on Twice Average Volume; Fundamental Concerns Remain - 7/14/2017 |
View all notes |
Set NEW NOTE alert |
Company Profile |
SEC
News |
Chart |
Request a new note
C
A
S
I |
ESNT
-
NYSE
Essent Group Ltd
Finance-MrtgandRel Svc
|
$38.79
|
-0.01
-0.03% |
$39.00
|
426,690
87.26% of 50 DAV
50 DAV is 489,000
|
$39.61
-2.07%
|
7/3/2017
|
$38.05
|
PP = $39.60
|
|
MB = $41.58
|
Most Recent Note - 7/14/2017 3:30:02 PM
Y - Holding its ground stubbornly after it touched a new high on 7/10/17 but reversed into the red. Subsequent gains above the pivot point backed by at least +40% above average volume may trigger a new (or add-on) technical buy signal. Losses below the 50 DMA line ($36.77) and prior low ($34.08 on 5/05/17) would raise concerns and trigger technical sell signals.
>>> FEATURED STOCK ARTICLE : Sputtering Below its 50-Day Moving Average - 6/20/2017 |
View all notes |
Set NEW NOTE alert |
Company Profile |
SEC
News |
Chart |
Request a new note
C
A
S
I |
Symbol/Exchange
Company Name
Industry Group |
PRICE |
CHANGE
(%Change) |
Day High |
Volume
(% DAV)
(% 50 day avg vol) |
52 Wk Hi
% From Hi |
Featured
Date |
Price
Featured |
Pivot Featured |
|
Max Buy |
MTSI
-
NASDAQ
Macom Tech Solution Hldg
Elec-Semiconductor Mfg
|
$60.51
|
-0.08
-0.13% |
$61.43
|
365,883
43.10% of 50 DAV
50 DAV is 849,000
|
$62.75
-3.57%
|
5/16/2017
|
$52.52
|
PP = $53.89
|
|
MB = $56.58
|
Most Recent Note - 7/12/2017 6:06:11 PM
G - Challenging prior highs with today's gain and recent gains lacking great volume conviction. Found support at its 50 DMA line ($55.67) and above the prior low ($53.61 on 6/09/17). Subsequent losses leading to violations would raise concerns and trigger technical sell signals.
>>> FEATURED STOCK ARTICLE : Meeting Resistance Near Prior High - 6/27/2017 |
View all notes |
Set NEW NOTE alert |
Company Profile |
SEC
News |
Chart |
Request a new note
C
A
S
I |
VEEV
-
NYSE
Veeva Systems Inc Cl A
Computer Sftwr-Medical
|
$64.25
|
+0.65
1.02% |
$64.72
|
1,146,767
63.92% of 50 DAV
50 DAV is 1,794,000
|
$68.07
-5.61%
|
3/16/2017
|
$49.00
|
PP = $48.05
|
|
MB = $50.45
|
Most Recent Note - 7/14/2017 3:05:05 PM
G - Found support at its 50 DMA line ($61.10) during its recent consolidation. Below that important short-term average the recent low ($56.94 on 6/12/17) defines the next important support to watch.
>>> FEATURED STOCK ARTICLE : Rebounding Since Testing Support at 50-Day Moving Average Line - 6/23/2017 |
View all notes |
Set NEW NOTE alert |
Company Profile |
SEC
News |
Chart |
Request a new note
C
A
S
I |
ANET
-
NYSE
Arista Networks Inc
TELECOMMUNICATIONS - Communication Equipment
|
$155.11
|
+0.34
0.22% |
$155.69
|
300,987
35.24% of 50 DAV
50 DAV is 854,000
|
$162.97
-4.82%
|
4/17/2017
|
$132.75
|
PP = $135.27
|
|
MB = $142.03
|
Most Recent Note - 7/11/2017 3:48:11 PM
G - Rebounded above its 50 DMA line ($149) recently after briefly undercutting that important short-term average. It is extended from any sound base. Prior low ($143.00 on 6/12/17) defines the next important support level to watch.
>>> FEATURED STOCK ARTICLE : Computer Networking Firm Very Extended From Any Sound Base - 6/6/2017 |
View all notes |
Set NEW NOTE alert |
Company Profile |
SEC
News |
Chart |
Request a new note
C
A
S
I |
GRUB
-
NYSE
Grubhub Inc
COMPUTER SOFTWARE and SERVICES - Technical and System Software
|
$45.78
|
-0.13
-0.28% |
$46.41
|
786,545
39.91% of 50 DAV
50 DAV is 1,971,000
|
$47.84
-4.31%
|
6/21/2017
|
$47.33
|
PP = $46.94
|
|
MB = $49.29
|
Most Recent Note - 7/12/2017 12:33:52 PM
Y - Color code is changed to yellow after gapping up above its 50 DMA line ($44/17) today helping its outlook improve following positive analyst coverage. Endured distributional pressure recently after it briefly rose above the new pivot point cited based on its 5/08/17 high plus 10 cents. Members were previously reminded - "A confirming gain backed by at least +40% above average volume and strong close above the pivot point may clinch a technical buy signal."
>>> FEATURED STOCK ARTICLE : Found Prompt Support at 50-Day Moving Average - 6/30/2017 |
View all notes |
Set NEW NOTE alert |
Company Profile |
SEC
News |
Chart |
Request a new note
C
A
S
I |
IBP
-
NYSE
Installed Building Prod
DIVERSIFIED SERVICES - Business/Management Services
|
$52.30
|
+0.30
0.58% |
$52.55
|
52,594
34.15% of 50 DAV
50 DAV is 154,000
|
$55.45
-5.68%
|
6/13/2017
|
$54.25
|
PP = $55.55
|
|
MB = $58.33
|
Most Recent Note - 7/14/2017 2:55:21 PM
Y - Found support at its 50 DMA line ($51.19) in recent weeks while quietly consolidating within close striking distance of its 52-week high. Subsequent volume-driven gains above the pivot point may trigger a new technical buy signal.
>>> FEATURED STOCK ARTICLE : Consolidating Near 50-Day Moving Average Line - 6/5/2017 |
View all notes |
Set NEW NOTE alert |
Company Profile |
SEC
News |
Chart |
Request a new note
C
A
S
I |
Symbol/Exchange
Company Name
Industry Group |
PRICE |
CHANGE
(%Change) |
Day High |
Volume
(% DAV)
(% 50 day avg vol) |
52 Wk Hi
% From Hi |
Featured
Date |
Price
Featured |
Pivot Featured |
|
Max Buy |
NCOM
-
NASDAQ
National Commerce Corp
BANKING - Regional - Southeast Banks
|
$39.95
|
-0.80
-1.96% |
$40.40
|
31,894
99.67% of 50 DAV
50 DAV is 32,000
|
$41.25
-3.15%
|
4/25/2017
|
$38.95
|
PP = $40.09
|
|
MB = $42.09
|
Most Recent Note - 7/14/2017 3:26:03 PM
Y - Stubbornly holding its ground since hitting a new 52-week high with a gain on 7/04/17 backed by average volume. Its 50 DMA line ($38.82) and recent lows define near-term support in the $37-38 area.
>>> FEATURED STOCK ARTICLE : Recent Breakout Lacked Great Volume Conviction - 7/10/2017 |
View all notes |
Set NEW NOTE alert |
Company Profile |
SEC
News |
Chart |
Request a new note
C
A
S
I |
INGN
-
NASDAQ
Inogen Inc
HEALTH SERVICES - Medical Instruments and Supplies
|
$95.08
|
+0.86
0.91% |
$95.61
|
147,791
75.02% of 50 DAV
50 DAV is 197,000
|
$97.71
-2.69%
|
4/17/2017
|
$76.77
|
PP = $80.04
|
|
MB = $84.04
|
Most Recent Note - 7/12/2017 5:53:55 PM
Y - Color code is changed to yellow with new pivot point cited based on its 6/22/17 high as it has formed an advanced "3-weeks tight" base. Subsequent volume-driven gains for new highs may trigger a new (or add-on) technical buy signal. Near-term support is its 50 DMA line ($89.53). See the latest FSU analysis for more details and a new annotated graph.
>>> FEATURED STOCK ARTICLE : In Tight Range Near All-Time High With Volume Totals Cooling - 7/12/2017 |
View all notes |
Set NEW NOTE alert |
Company Profile |
SEC
News |
Chart |
Request a new note
C
A
S
I |
HQY
-
NASDAQ
Healthequity Inc
COMPUTER SOFTWARE and SERVICES - Healthcare Information Service
|
$50.96
|
-0.43
-0.84% |
$51.85
|
271,816
54.04% of 50 DAV
50 DAV is 503,000
|
$54.95
-7.26%
|
6/7/2017
|
$50.01
|
PP = $49.35
|
|
MB = $51.82
|
Most Recent Note - 7/12/2017 6:04:33 PM
Y - Posted a big gain today with above average volume, rebounding toward its "max buy" level. Found support near prior highs in the $49 area and above its 50 DMA line ($48.36). Subsequent losses leading to violations would trigger technical sell signals
>>> FEATURED STOCK ARTICLE : High Volume Breakout Quickly Getting Extended - 6/7/2017 |
View all notes |
Set NEW NOTE alert |
Company Profile |
SEC
News |
Chart |
Request a new note
C
A
S
I |
PLAY
-
NASDAQ
Dave & Buster's Ent Inc
Retail-Restaurants
|
$66.25
|
+0.08
0.12% |
$66.80
|
338,661
48.94% of 50 DAV
50 DAV is 692,000
|
$73.48
-9.84%
|
2/23/2017
|
$55.41
|
PP = $58.35
|
|
MB = $61.27
|
Most Recent Note - 7/14/2017 3:28:25 PM
G - A rebound above its 50 DMA line ($67.06) is still needed for its outlook to improve. Damaging losses below the recent low ($64.26 on 7/07/17) would raise greater concerns and trigger a worrisome technical sell signal.
>>> FEATURED STOCK ARTICLE : Perched Near Record High After Solid April '17 Quarterly Results - 6/12/2017 |
View all notes |
Set NEW NOTE alert |
Company Profile |
SEC
News |
Chart |
Request a new note
C
A
S
I |
OLLI
-
NASDAQ
Ollie's Bargain Outlet
Retail-DiscountandVariety
|
$43.25
|
+0.25
0.58% |
$43.40
|
452,918
59.28% of 50 DAV
50 DAV is 764,000
|
$44.08
-1.87%
|
3/27/2017
|
$32.80
|
PP = $33.55
|
|
MB = $35.23
|
Most Recent Note - 7/11/2017 3:37:58 PM
Y - Finding support recently above its 50 DMA line ($40.97). Below that important short-term average, recent lows in the $37-38 area define the next important support to watch.
>>> FEATURED STOCK ARTICLE : Recently Found Support Near 50-Day Moving Average - 6/29/2017 |
View all notes |
Set NEW NOTE alert |
Company Profile |
SEC
News |
Chart |
Request a new note
C
A
S
I |
Symbol/Exchange
Company Name
Industry Group |
PRICE |
CHANGE
(%Change) |
Day High |
Volume
(% DAV)
(% 50 day avg vol) |
52 Wk Hi
% From Hi |
Featured
Date |
Price
Featured |
Pivot Featured |
|
Max Buy |
LITE
-
NASDAQ
Lumentum Holdings Inc
TELECOMMUNICATIONS - Cables / Satalite Equipment
|
$63.80
|
-0.25
-0.39% |
$64.55
|
1,081,375
59.25% of 50 DAV
50 DAV is 1,825,000
|
$67.30
-5.20%
|
7/13/2017
|
$64.15
|
PP = $67.40
|
|
MB = $70.77
|
Most Recent Note - 7/13/2017 5:42:55 PM
Y - Highlighted in yellow with new pivot point cited based on its 6/09/17 high plus 10 cents in earlier mid-day report. Subsequent volume-driven gains for new highs may trigger a new (or add-on) technical buy signal. Rebounding near prior highs after finding support above its 50 DMA line and prior highs in the $55 area. Reported earnings +53% on +11% sales revenues for the Mar '17 quarter and fundamentals (C and A criteria) remain strong. See the latest FSU analysis for more details and a new annotated graph.
>>> FEATURED STOCK ARTICLE : High Ranked Telecom - Fiber Optics Firm - 7/13/2017 |
View all notes |
Set NEW NOTE alert |
Company Profile |
SEC
News |
Chart |
Request a new note
C
A
S
I |
MOMO
-
NASDAQ
Momo Inc Ads Cl A
INTERNET - Content
|
$41.37
|
+0.61
1.50% |
$41.57
|
3,522,362
50.13% of 50 DAV
50 DAV is 7,027,000
|
$45.95
-9.97%
|
3/7/2017
|
$29.71
|
PP = $27.83
|
|
MB = $29.22
|
Most Recent Note - 7/11/2017 3:51:48 PM
G - Rebounded above its 50 DMA line ($38.97) during a streak of 5 consecutive gains helping its outlook to improve. Prior low ($35.02 on 6/15/17) defines the next important chart support level where a violation would raise more serious concerns.
>>> FEATURED STOCK ARTICLE : Sputtering Below 50-Day Moving Average Line - 6/14/2017 |
View all notes |
Set NEW NOTE alert |
Company Profile |
SEC
News |
Chart |
Request a new note
C
A
S
I |
HLI
-
NYSE
Houlihan Lokey Inc Cl A
Finance-Invest Bnk/Bkrs
|
$36.59
|
-0.40
-1.08% |
$37.02
|
166,217
93.91% of 50 DAV
50 DAV is 177,000
|
$37.25
-1.77%
|
5/10/2017
|
$35.85
|
PP = $35.05
|
|
MB = $36.80
|
Most Recent Note - 7/12/2017 6:11:22 PM
Y - Posted an 11th consecutive gain today and hit a new high while challenging its "max buy" level. Its 50 DMA line ($34.49) acted as support, but a damaging violation would raise concerns and trigger a worrisome technical sell signal.
>>> FEATURED STOCK ARTICLE : Gapped Up and Nearly Challenged Prior High - 6/19/2017 |
View all notes |
Set NEW NOTE alert |
Company Profile |
SEC
News |
Chart |
Request a new note
C
A
S
I |