***Last / Change / Volume data in this table is the closing quote data***
Symbol/Exchange
Company Name
Industry Group |
PRICE |
CHANGE
(%Change) |
Day High |
Volume
(% DAV)
(% 50 day avg vol) |
52 Wk Hi
% From Hi |
Featured
Date |
Price
Featured |
Pivot Featured |
|
Max Buy |
THO
-
NYSE
Thor Industries Inc
AUTOMOTIVE - Recreational Vehicles
|
$102.97
|
-0.18
-0.17% |
$103.25
|
474,201
57.06% of 50 DAV
50 DAV is 831,000
|
$115.74
-11.03%
|
6/7/2017
|
$102.95
|
PP = $98.92
|
|
MB = $103.87
|
Most Recent Note - 7/6/2017 3:35:18 PM
Y - Pulling back just below its "max buy" level with a loss today on light volume, and its color code is changed to yellow.
>>> FEATURED STOCK ARTICLE : Some Overhead Supply Remains After Latest Technical Breakout - 6/8/2017 |
View all notes |
Set NEW NOTE alert |
Company Profile |
SEC
News |
Chart |
Request a new note
C
A
S
I |
SBCF
-
NASDAQ
Seacoast Banking Corp Fl
BANKING - Regional - Mid-Atlantic Banks
|
$23.87
|
-0.48
-1.97% |
$24.27
|
209,544
67.59% of 50 DAV
50 DAV is 310,000
|
$25.88
-7.77%
|
6/9/2017
|
$24.13
|
PP = $25.98
|
|
MB = $27.28
|
Most Recent Note - 7/6/2017 6:33:31 PM
Y - Still quietly consolidating above its 50 DMA line ($23.78) and perched within striking distance of the new pivot point cited based on its 4/25/17 high. Previously noted - "Subsequent volume-driven gains for new highs may trigger a new technical buy signal. " See the latest FSU analysis for more details and a new annotated graph.
>>> FEATURED STOCK ARTICLE : Florida Bank Perched -6.6% Off All-Time High - 7/6/2017 |
View all notes |
Set NEW NOTE alert |
Company Profile |
SEC
News |
Chart |
Request a new note
C
A
S
I |
BERY
-
NYSE
Berry Global Group Inc
CONSUMER NON-DURABLES - Packaging and Containers
|
$58.20
|
+0.62
1.08% |
$58.30
|
1,126,106
105.15% of 50 DAV
50 DAV is 1,071,000
|
$58.95
-1.27%
|
5/26/2017
|
$58.31
|
PP = $57.04
|
|
MB = $59.89
|
Most Recent Note - 7/7/2017 5:16:52 PM
Y - Found prompt support this week at its 50 DMA line ($56.63). More damaging losses would raise greater concerns and trigger a technical sell signal. See the latest FSU analysis for more details and a new annotated graph.
>>> FEATURED STOCK ARTICLE : Found Prompt Support at 50-Day Moving Average Line - 7/7/2017 |
View all notes |
Set NEW NOTE alert |
Company Profile |
SEC
News |
Chart |
Request a new note
C
A
S
I |
EW
-
NYSE
Edwards Lifesciences Cp
HEALTH SERVICES - Medical Appliances and Equipment
|
$117.53
|
-0.64
-0.54% |
$118.61
|
944,922
79.47% of 50 DAV
50 DAV is 1,189,000
|
$121.75
-3.47%
|
5/16/2017
|
$114.12
|
PP = $113.04
|
|
MB = $118.69
|
Most Recent Note - 7/6/2017 3:36:59 PM
G - Quietly pulling back after challenging its all-time high. Its 50 DMA line ($114.57) defines near-term support above recent lows in the $112-113 area.
>>> FEATURED STOCK ARTICLE : Medical Products Firm Perched Near All-Time High - 6/26/2017 |
View all notes |
Set NEW NOTE alert |
Company Profile |
SEC
News |
Chart |
Request a new note
C
A
S
I |
NTES
-
NASDAQ
Netease Inc Adr
INTERNET - Internet Information Providers
|
$301.00
|
+5.21
1.76% |
$301.49
|
947,822
70.21% of 50 DAV
50 DAV is 1,350,000
|
$337.55
-10.83%
|
6/8/2017
|
$310.76
|
PP = $307.62
|
|
MB = $323.00
|
Most Recent Note - 7/5/2017 12:04:28 PM
Y - Testing support at its 50 DMA line ($291.84) today with another loss, and the noted retreat below its pivot point recently raised concerns. Disciplined investors limit losses by selling any stock that falls more than -7% from their purchase price. Recent gains lacked great volume conviction.
>>> FEATURED STOCK ARTICLE : Encountered Distributional Pressure After Hitting New Highs - 6/9/2017 |
View all notes |
Set NEW NOTE alert |
Company Profile |
SEC
News |
Chart |
Request a new note
C
A
S
I |
Symbol/Exchange
Company Name
Industry Group |
PRICE |
CHANGE
(%Change) |
Day High |
Volume
(% DAV)
(% 50 day avg vol) |
52 Wk Hi
% From Hi |
Featured
Date |
Price
Featured |
Pivot Featured |
|
Max Buy |
STMP
-
NASDAQ
Stamps.com Inc
INTERNET - Internet Software and Services
|
$143.15
|
-2.30
-1.58% |
$146.85
|
297,379
44.85% of 50 DAV
50 DAV is 663,000
|
$156.40
-8.47%
|
5/24/2017
|
$133.10
|
PP = $136.10
|
|
MB = $142.91
|
Most Recent Note - 7/5/2017 5:11:27 PM
G - Abruptly retreated from its 52-week high with a big loss on the prior session after wedging higher with gains lacking great volume conviction. Prior high ($136 on 2/22/17) defines near term support above its 50 DMA line ($131). See the latest FSU analysis for more details and a new annotated graph.
>>> FEATURED STOCK ARTICLE : Pulling Back After Getting Extended From Prior Base - 7/5/2017 |
View all notes |
Set NEW NOTE alert |
Company Profile |
SEC
News |
Chart |
Request a new note
C
A
S
I |
MELI
-
NASDAQ
Mercadolibre Inc
INTERNET - Internet Software and; Services
|
$259.82
|
+4.22
1.65% |
$261.47
|
592,813
88.74% of 50 DAV
50 DAV is 668,000
|
$297.95
-12.80%
|
6/15/2017
|
$261.73
|
PP = $297.95
|
|
MB = $312.85
|
Most Recent Note - 7/6/2017 3:32:04 PM
G - Consolidating near the prior low ($248.20 on 5/18/17). A rebound above its 50 DMA line ($268.44) is needed for its outlook to improve.
>>> FEATURED STOCK ARTICLE : Test of 10-Week Moving Average May Be a Secondary Buy Point - 6/15/2017 |
View all notes |
Set NEW NOTE alert |
Company Profile |
SEC
News |
Chart |
Request a new note
C
A
S
I |
HTHT
-
NASDAQ
China Lodging Group Ads
LEISURE - Lodging
|
$79.07
|
+1.57
2.03% |
$79.25
|
285,014
119.25% of 50 DAV
50 DAV is 239,000
|
$88.08
-10.23%
|
9/29/2016
|
$46.12
|
PP = $47.82
|
|
MB = $50.21
|
Most Recent Note - 7/6/2017 3:22:31 PM
G - Undercutting its 50 DMA line ($77.47) with a big loss today on higher volume raising concerns. Prior low ($75.01 on 6/15/17) defines the next important support level to watch.
>>> FEATURED STOCK ARTICLE : China-Based Hotel Firm is Extended From Any Sound Base - 6/28/2017 |
View all notes |
Set NEW NOTE alert |
Company Profile |
SEC
News |
Chart |
Request a new note
C
A
S
I |
BEAT
-
NASDAQ
BioTelemetry Inc
Medical-Services
|
$32.15
|
-0.70
-2.13% |
$32.98
|
340,630
65.63% of 50 DAV
50 DAV is 519,000
|
$34.00
-5.44%
|
2/14/2017
|
$25.10
|
PP = $24.55
|
|
MB = $25.78
|
Most Recent Note - 7/6/2017 3:42:28 PM
G - Consolidating after recently challenging its prior high. Its 50 DMA line ($29.95) and prior lows in the $26.50 - $27.00 area define near-term support levels to watch. Raised fundamental concerns with sub par Mar '17 earnings that were repeatedly noted.
>>> FEATURED STOCK ARTICLE : Lingering Below 50-Day Moving Average Line - 6/1/2017 |
View all notes |
Set NEW NOTE alert |
Company Profile |
SEC
News |
Chart |
Request a new note
C
A
S
I |
ESNT
-
NYSE
Essent Group Ltd
Finance-MrtgandRel Svc
|
$38.51
|
-0.68
-1.74% |
$39.61
|
1,021,239
206.31% of 50 DAV
50 DAV is 495,000
|
$39.50
-2.51%
|
7/3/2017
|
$38.05
|
PP = $39.60
|
|
MB = $41.58
|
 Most Recent Note - 7/10/2017 12:15:59 PM
Y - Touched a new high early today but reversed into the red. Subsequent gains above the pivot point backed by at least +40% above average volume may trigger a new (or add-on) technical buy signal. Losses below the 50 DMA line ($36.63) and prior low ($34.08 on 5/05/17) would raise concerns and trigger technical sell signals.
>>> FEATURED STOCK ARTICLE : Sputtering Below its 50-Day Moving Average - 6/20/2017 |
View all notes |
Set NEW NOTE alert |
Company Profile |
SEC
News |
Chart |
Request a new note
C
A
S
I |
Symbol/Exchange
Company Name
Industry Group |
PRICE |
CHANGE
(%Change) |
Day High |
Volume
(% DAV)
(% 50 day avg vol) |
52 Wk Hi
% From Hi |
Featured
Date |
Price
Featured |
Pivot Featured |
|
Max Buy |
MTSI
-
NASDAQ
Macom Tech Solution Hldg
Elec-Semiconductor Mfg
|
$57.39
|
-0.55
-0.95% |
$58.40
|
757,039
86.92% of 50 DAV
50 DAV is 871,000
|
$62.75
-8.54%
|
5/16/2017
|
$52.52
|
PP = $53.89
|
|
MB = $56.58
|
Most Recent Note - 7/7/2017 5:19:54 PM
G - Found support this week near its 50 DMA line ($55.08) and above the prior low ($53.61 on 6/09/17). Subsequent losses leading to violations would raise concerns and trigger technical sell signals.
>>> FEATURED STOCK ARTICLE : Meeting Resistance Near Prior High - 6/27/2017 |
View all notes |
Set NEW NOTE alert |
Company Profile |
SEC
News |
Chart |
Request a new note
C
A
S
I |
VEEV
-
NYSE
Veeva Systems Inc Cl A
Computer Sftwr-Medical
|
$62.15
|
-0.20
-0.32% |
$63.48
|
1,099,158
62.88% of 50 DAV
50 DAV is 1,748,000
|
$68.07
-8.70%
|
3/16/2017
|
$49.00
|
PP = $48.05
|
|
MB = $50.45
|
Most Recent Note - 7/7/2017 5:22:40 PM
G - Found support this week at its 50 DMA line ($60.16) which previously acted as support. Recent low ($56.94 on 6/12/17) defines the next important support to watch.
>>> FEATURED STOCK ARTICLE : Rebounding Since Testing Support at 50-Day Moving Average Line - 6/23/2017 |
View all notes |
Set NEW NOTE alert |
Company Profile |
SEC
News |
Chart |
Request a new note
C
A
S
I |
ANET
-
NYSE
Arista Networks Inc
TELECOMMUNICATIONS - Communication Equipment
|
$149.35
|
+0.58
0.39% |
$150.78
|
672,804
76.98% of 50 DAV
50 DAV is 874,000
|
$162.97
-8.36%
|
4/17/2017
|
$132.75
|
PP = $135.27
|
|
MB = $142.03
|
Most Recent Note - 7/7/2017 5:28:30 PM
G - Rebounded near its 50 DMA line ($148.64) today after undercutting that important short-term average this week. Prior low ($143.00 on 6/12/17) defines the next important support level to watch.
>>> FEATURED STOCK ARTICLE : Computer Networking Firm Very Extended From Any Sound Base - 6/6/2017 |
View all notes |
Set NEW NOTE alert |
Company Profile |
SEC
News |
Chart |
Request a new note
C
A
S
I |
GRUB
-
NYSE
Grubhub Inc
COMPUTER SOFTWARE and SERVICES - Technical and System Software
|
$43.65
|
-0.03
-0.07% |
$44.25
|
947,870
39.98% of 50 DAV
50 DAV is 2,371,000
|
$47.84
-8.76%
|
6/21/2017
|
$47.33
|
PP = $46.94
|
|
MB = $49.29
|
Most Recent Note - 7/6/2017 3:29:48 PM
G - Color code was changed to green while undercutting its 50 DMA line ($43.91) triggering a technical sell signal. Only a prompt rebound above the 50 DMA line would help its outlook improve. A new pivot point was cited based on its 5/08/17 high plus 10 cents. A confirming gain backed by at least +40% above average volume and strong close above the pivot point may clinch a technical buy signal.
>>> FEATURED STOCK ARTICLE : Found Prompt Support at 50-Day Moving Average - 6/30/2017 |
View all notes |
Set NEW NOTE alert |
Company Profile |
SEC
News |
Chart |
Request a new note
C
A
S
I |
IBP
-
NYSE
Installed Building Prod
DIVERSIFIED SERVICES - Business/Management Services
|
$52.40
|
-0.65
-1.23% |
$53.05
|
65,658
40.78% of 50 DAV
50 DAV is 161,000
|
$55.45
-5.50%
|
6/13/2017
|
$54.25
|
PP = $55.55
|
|
MB = $58.33
|
Most Recent Note - 7/7/2017 5:26:19 PM
Y - Found support at its 50 DMA line ($51.28) this week. It is perched within close striking distance of the new pivot point cited based on its 4/27/17 high plus 10 cents. Subsequent volume-driven gains above the pivot point may trigger a new technical buy signal. Below the 50 DMA line its recent low ($46.65 on 5/09/17) defines the next near-term support.
>>> FEATURED STOCK ARTICLE : Consolidating Near 50-Day Moving Average Line - 6/5/2017 |
View all notes |
Set NEW NOTE alert |
Company Profile |
SEC
News |
Chart |
Request a new note
C
A
S
I |
Symbol/Exchange
Company Name
Industry Group |
PRICE |
CHANGE
(%Change) |
Day High |
Volume
(% DAV)
(% 50 day avg vol) |
52 Wk Hi
% From Hi |
Featured
Date |
Price
Featured |
Pivot Featured |
|
Max Buy |
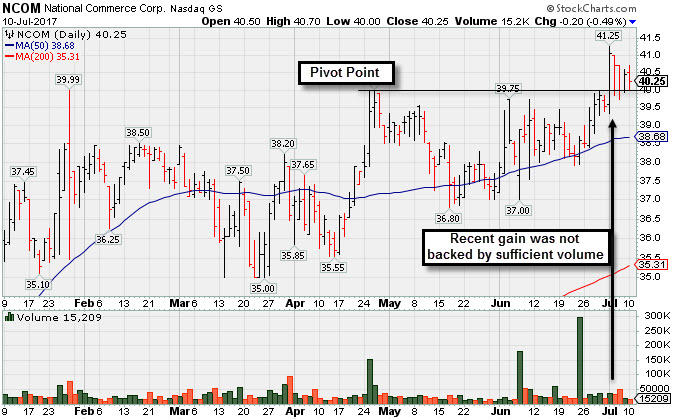
NCOM
-
NASDAQ
National Commerce Corp
BANKING - Regional - Southeast Banks
|
$40.25
|
-0.20
-0.49% |
$40.70
|
15,209
46.09% of 50 DAV
50 DAV is 33,000
|
$41.25
-2.42%
|
4/25/2017
|
$38.95
|
PP = $40.09
|
|
MB = $42.09
|
Most Recent Note - 7/10/2017 5:46:00 PM
Y - Holding its ground since hitting a new 52-week high with a gain on 7/04/17 backed by average volume. Its 50 DMA line and recent lows define near-term support in the $37-38 area. See the latest FSU analysis for more details and a new annotated graph.
>>> FEATURED STOCK ARTICLE : Recent Breakout Lacked Great Volume Conviction - 7/10/2017 |
View all notes |
Set NEW NOTE alert |
Company Profile |
SEC
News |
Chart |
Request a new note
C
A
S
I |
INGN
-
NASDAQ
Inogen Inc
HEALTH SERVICES - Medical Instruments and Supplies
|
$94.18
|
-0.68
-0.72% |
$95.34
|
118,462
59.53% of 50 DAV
50 DAV is 199,000
|
$97.71
-3.61%
|
4/17/2017
|
$76.77
|
PP = $80.04
|
|
MB = $84.04
|
Most Recent Note - 7/6/2017 3:43:29 PM
G - Pulled back from its all-time high with another loss today marked by light volume. It is very extended from its prior base. Near-term support is its 50 DMA line ($88.64).
>>> FEATURED STOCK ARTICLE : Perched at All Time High Following Volume-Driven Gains - 5/31/2017 |
View all notes |
Set NEW NOTE alert |
Company Profile |
SEC
News |
Chart |
Request a new note
C
A
S
I |
HQY
-
NASDAQ
Healthequity Inc
COMPUTER SOFTWARE and SERVICES - Healthcare Information Service
|
$48.46
|
-1.74
-3.46% |
$50.59
|
477,478
97.05% of 50 DAV
50 DAV is 492,000
|
$54.95
-11.82%
|
6/7/2017
|
$50.01
|
PP = $49.35
|
|
MB = $51.82
|
Most Recent Note - 7/7/2017 5:18:31 PM
Y - Found prompt support this week near prior highs in the $49 area and above its 50 DMA line ($48.09) which defines the next important near-term support to watch.
>>> FEATURED STOCK ARTICLE : High Volume Breakout Quickly Getting Extended - 6/7/2017 |
View all notes |
Set NEW NOTE alert |
Company Profile |
SEC
News |
Chart |
Request a new note
C
A
S
I |
PLAY
-
NASDAQ
Dave & Buster's Ent Inc
Retail-Restaurants
|
$64.81
|
-0.09
-0.14% |
$65.52
|
506,528
73.09% of 50 DAV
50 DAV is 693,000
|
$73.48
-11.80%
|
2/23/2017
|
$55.41
|
PP = $58.35
|
|
MB = $61.27
|
Most Recent Note - 7/10/2017 5:47:49 PM
G - Lingering below its 50 DMA line ($66.95) still, and more damaging losses would raise greater concerns. A rebound above its 50 DMA line is needed for its outlook to improve.
>>> FEATURED STOCK ARTICLE : Perched Near Record High After Solid April '17 Quarterly Results - 6/12/2017 |
View all notes |
Set NEW NOTE alert |
Company Profile |
SEC
News |
Chart |
Request a new note
C
A
S
I |
OLLI
-
NASDAQ
Ollie's Bargain Outlet
Retail-DiscountandVariety
|
$41.05
|
-1.55
-3.64% |
$42.50
|
961,310
130.08% of 50 DAV
50 DAV is 739,000
|
$44.08
-6.86%
|
3/27/2017
|
$32.80
|
PP = $33.55
|
|
MB = $35.23
|
Most Recent Note - 7/7/2017 5:21:16 PM
Y - Found support this week above its 50 DMA line ($40.83). Below that important short-term average, recent lows in the $37-38 area define important support to watch.
>>> FEATURED STOCK ARTICLE : Recently Found Support Near 50-Day Moving Average - 6/29/2017 |
View all notes |
Set NEW NOTE alert |
Company Profile |
SEC
News |
Chart |
Request a new note
C
A
S
I |
Symbol/Exchange
Company Name
Industry Group |
PRICE |
CHANGE
(%Change) |
Day High |
Volume
(% DAV)
(% 50 day avg vol) |
52 Wk Hi
% From Hi |
Featured
Date |
Price
Featured |
Pivot Featured |
|
Max Buy |
MOMO
-
NASDAQ
Momo Inc Ads Cl A
INTERNET - Content
|
$40.74
|
+1.47
3.74% |
$41.11
|
6,591,407
95.43% of 50 DAV
50 DAV is 6,907,000
|
$45.95
-11.34%
|
3/7/2017
|
$29.71
|
PP = $27.83
|
|
MB = $29.22
|
Most Recent Note - 7/5/2017 5:18:14 PM
G - Rebounded toward its 50 DMA line ($38.82), and gains above that important short-term average are needed for its outlook to improve. Prior low ($35.02 on 6/15/17) defines the next important chart support level where a violation would raise more serious concerns.
>>> FEATURED STOCK ARTICLE : Sputtering Below 50-Day Moving Average Line - 6/14/2017 |
View all notes |
Set NEW NOTE alert |
Company Profile |
SEC
News |
Chart |
Request a new note
C
A
S
I |
HLI
-
NYSE
Houlihan Lokey Inc Cl A
Finance-Invest Bnk/Bkrs
|
$36.58
|
+0.64
1.78% |
$36.66
|
233,020
135.48% of 50 DAV
50 DAV is 172,000
|
$36.65
-0.19%
|
5/10/2017
|
$35.85
|
PP = $35.05
|
|
MB = $36.80
|
Most Recent Note - 7/6/2017 3:38:33 PM
Y - Posting a 6th consecutive gain today, consolidating above its 50 DMA line ($34.26) which has acted as support. Recent low ($32.72 on 5/31/17) also defines near-term support where violations would raise concerns and trigger a more worrisome technical sell signal.
>>> FEATURED STOCK ARTICLE : Gapped Up and Nearly Challenged Prior High - 6/19/2017 |
View all notes |
Set NEW NOTE alert |
Company Profile |
SEC
News |
Chart |
Request a new note
C
A
S
I |