***Last / Change / Volume data in this table is the closing quote data***
Symbol/Exchange
Company Name
Industry Group |
PRICE |
CHANGE
(%Change) |
Day High |
Volume
(% DAV)
(% 50 day avg vol) |
52 Wk Hi
% From Hi |
Featured
Date |
Price
Featured |
Pivot Featured |
|
Max Buy |
SIVB
-
NASDAQ
S V B Financial Group
BANKING - Regional - Pacific Banks
|
$260.59
|
-3.21
-1.22% |
$268.97
|
635,359
97.00% of 50 DAV
50 DAV is 655,000
|
$271.79
-4.12%
|
3/12/2018
|
$267.79
|
PP = $263.19
|
|
MB = $276.35
|
Most Recent Note - 3/16/2018 4:40:00 PM
Y - Tallied a volume-driven gain today helping clinch a technical buy signal. Reported earnings +53% on +32% sales revenues for the Dec '17 quarter, marking its 4th consecutive comparison above the +25% minimum guideline (C criteria), helping it better match the fact-based investment system's guidelines.
>>> FEATURED STOCK ARTICLE : Endured Distributional Pressure After Wedging Higher - 3/12/2018 |
View all notes |
Set NEW NOTE alert |
Company Profile |
SEC
News |
Chart |
Request a new note
C
A
S
I |
TPL
-
NYSE
Texas Pacific Land Trust
FINANCIAL SERVICES - Diversified Investments
|
$515.00
|
-12.45
-2.36% |
$534.50
|
7,623
44.84% of 50 DAV
50 DAV is 17,000
|
$569.99
-9.65%
|
2/20/2018
|
$517.00
|
PP = $569.99
|
|
MB = $598.49
|
 Most Recent Note - 3/19/2018 6:05:57 PM
G - Color code is changed to green after slumping and closing below its 50 DMA line ($519.72). A prompt rebound above the 50 DMA line is needed for its outlook to improve. The prior low ($480 on 2/09/18) is the next important support level. Reported earnings +29% on +118% sales revenues for the Dec '17 quarter.
>>> FEATURED STOCK ARTICLE : Finding Support Above 50-Day Moving Average Line - 2/22/2018 |
View all notes |
Set NEW NOTE alert |
Company Profile |
SEC
News |
Chart |
Request a new note
C
A
S
I |
YY
-
NASDAQ
YY Inc
INTERNET - Internet Service Providers
|
$118.75
|
+1.06
0.90% |
$121.17
|
1,504,968
91.93% of 50 DAV
50 DAV is 1,637,000
|
$142.97
-16.94%
|
12/29/2017
|
$113.06
|
PP = $123.58
|
|
MB = $129.76
|
Most Recent Note - 3/14/2018 10:26:47 AM
G - Sputtering further below its 50 DMA line ($128.24). Prior low ($109.06 on 2/09/18) defines the next important support where a violation may trigger a more worrisome sell signal. Faces resistance due to overhead supply up to the $142 level. Reported earnings +55% on +56% sales revenues for the Dec '17 quarter, continuing its strong earnings track record.
>>> FEATURED STOCK ARTICLE : Earnings News Due Next Week for Chinese Social Platform - 2/27/2018 |
View all notes |
Set NEW NOTE alert |
Company Profile |
SEC
News |
Chart |
Request a new note
C
A
S
I |
LOGM
-
NASDAQ
Logmein Inc
INTERNET - Internet Software andamp; Services
|
$124.35
|
-2.10
-1.66% |
$126.65
|
385,032
67.23% of 50 DAV
50 DAV is 572,700
|
$134.80
-7.75%
|
2/15/2018
|
$132.35
|
PP = $129.61
|
|
MB = $136.09
|
Most Recent Note - 3/14/2018 5:15:32 PM
Y - Recent rebound above the 50 DMA line ($121.88) helped its outlook improve after it found support at its 200 DMA line. However, its Relative Strength rating is 76, still below the 80+ minimum guideline for buy candidates. See the latest FSU analysis for more details and a new annotated graph.
>>> FEATURED STOCK ARTICLE : Rebounding After Finding Support at 200-Day Average - 3/14/2018 |
View all notes |
Set NEW NOTE alert |
Company Profile |
SEC
News |
Chart |
Request a new note
C
A
S
I |
HTHT
-
NASDAQ
China Lodging Group Ads
LEISURE - Lodging
|
$131.47
|
-3.54
-2.62% |
$135.58
|
452,077
79.17% of 50 DAV
50 DAV is 571,000
|
$166.19
-20.89%
|
12/22/2017
|
$138.07
|
PP = $142.90
|
|
MB = $150.05
|
Most Recent Note - 3/15/2018 6:17:20 PM
G - Posted a gain today, finding support near its February low ($128.60). Gapped down on the prior session triggering a technical sell signal. A rebound above the 50 DMA line is needed for its outlook to improve. Reported earnings +86% on +42% sales revenues for the Dec '17 quarter.
>>> FEATURED STOCK ARTICLE : Repaired Recent Technical Damage But Has Not Formed a New Base - 2/23/2018 |
View all notes |
Set NEW NOTE alert |
Company Profile |
SEC
News |
Chart |
Request a new note
C
A
S
I |
Symbol/Exchange
Company Name
Industry Group |
PRICE |
CHANGE
(%Change) |
Day High |
Volume
(% DAV)
(% 50 day avg vol) |
52 Wk Hi
% From Hi |
Featured
Date |
Price
Featured |
Pivot Featured |
|
Max Buy |
LMAT
-
NASDAQ
Lemaitre Vascular Inc
Medical-Products
|
$36.57
|
-0.15
-0.41% |
$37.14
|
165,879
131.65% of 50 DAV
50 DAV is 126,000
|
$39.88
-8.30%
|
3/19/2018
|
$36.77
|
PP = $39.98
|
|
MB = $41.98
|
Most Recent Note - 3/19/2018 6:09:12 PM
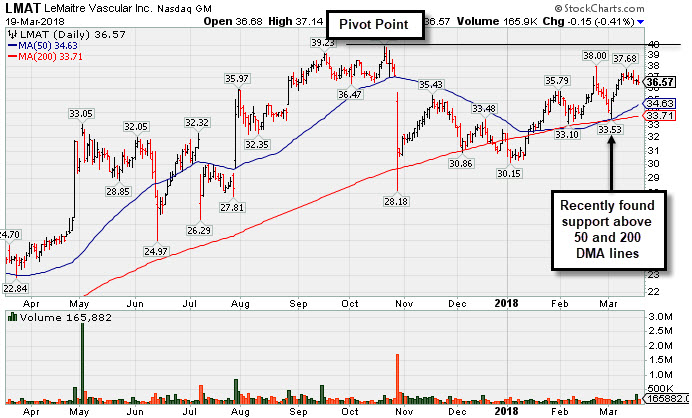
Y - Highlighted in yellow with new pivot point cited based on its 10/20/17 high plus 10 cents in the earlier mid-day report. Subsequent volume-driven gains for new highs are needed to trigger a technical buy signal. Fundamentals remain strong, as it reported +62% earnings on +12% sales revenues for the Dec '17 quarter. Recently consolidating above its 50 and 200 DMA lines. It was dropped from the Featured Stocks list on 12/04/17. See the latest FSU analysis for more details and a new annotated graph.
>>> FEATURED STOCK ARTICLE : Rebounding Near High After Choppy Consolidation - 3/19/2018 |
View all notes |
Set NEW NOTE alert |
Company Profile |
SEC
News |
Chart |
Request a new note
C
A
S
I |
PETS
-
NASDAQ
Petmed Express Inc
RETAIL - Drug Stores
|
$43.15
|
-0.12
-0.28% |
$43.35
|
435,637
62.23% of 50 DAV
50 DAV is 700,000
|
$57.80
-25.35%
|
1/19/2018
|
$53.59
|
PP = $51.00
|
|
MB = $53.55
|
Most Recent Note - 3/16/2018 4:37:30 PM
G - Slumped well below its 50 DMA line ($46.72) with a damaging volume-driven loss today. A rebound above the 50 DMA line is needed for its outlook to improve. Faces near-term resistance due to overhead supply up to the $57 level. Recently reported earnings +83% on +14% sales revenues, continuing its strong earnings track record. See the latest FSU analysis for more details and an annotated graph.
>>> FEATURED STOCK ARTICLE : Recently Endured Distributional Pressure - 3/15/2018 |
View all notes |
Set NEW NOTE alert |
Company Profile |
SEC
News |
Chart |
Request a new note
C
A
S
I |
DPZ
-
NYSE
Dominos Pizza Inc
WHOLESALE - Food Wholesale
|
$227.67
|
-2.12
-0.92% |
$230.28
|
633,547
56.97% of 50 DAV
50 DAV is 1,112,000
|
$236.00
-3.53%
|
2/20/2018
|
$224.86
|
PP = $222.01
|
|
MB = $233.11
|
Most Recent Note - 3/19/2018 5:58:49 PM
Y - Volume totals have been cooling while hovering near its high. Stalled soon after highlighted in the 2/20/18 mid-day report with pivot point cited based on its 1/25/18 high plus 10 cents.
>>> FEATURED STOCK ARTICLE : Popular Pizza Firm Met Resistance Near Prior High - 2/20/2018 |
View all notes |
Set NEW NOTE alert |
Company Profile |
SEC
News |
Chart |
Request a new note
C
A
S
I |
FIVE
-
NASDAQ
Five Below Inc
Retail-DiscountandVariety
|
$69.05
|
+0.09
0.13% |
$69.05
|
1,270,117
124.28% of 50 DAV
50 DAV is 1,022,000
|
$73.55
-6.12%
|
3/9/2018
|
$68.58
|
PP = $73.65
|
|
MB = $77.33
|
Most Recent Note - 3/15/2018 1:46:34 PM
Y - New pivot point was cited based on its 1/05/18 high plus 10 cents. Subsequent volume-driven gains above the pivot point may trigger a new (or add-on) technical buy signal. Consolidating above its 50 DMA line ($66.84). The recent low ($60.00 on 2/06/18) defines important near-term support to watch on pullbacks.
>>> FEATURED STOCK ARTICLE : Retailer Rebounding Within Striking Distance of Prior High - 3/9/2018 |
View all notes |
Set NEW NOTE alert |
Company Profile |
SEC
News |
Chart |
Request a new note
C
A
S
I |
SPLK
-
NASDAQ
Splunk Inc
Computer Sftwr-Database
|
$106.83
|
+0.01
0.01% |
$108.12
|
1,418,907
77.32% of 50 DAV
50 DAV is 1,835,000
|
$109.88
-2.78%
|
2/15/2018
|
$96.06
|
PP = $93.68
|
|
MB = $98.36
|
Most Recent Note - 3/16/2018 4:41:12 PM
G - Volume totals have been cooling while perched near its all-time high, extended from any sound base. Disciplined investors avoid chasing extended stocks. Its 50 DMA line and prior highs define support to watch on pullbacks. Bullish action came after it reported earnings +76% on +37% sales revenues for the quarter ended January 31, 2018 versus the year ago period.
>>> FEATURED STOCK ARTICLE : Pulled Back to 10-Week Moving Average After Technical Breakout - 2/16/2018 |
View all notes |
Set NEW NOTE alert |
Company Profile |
SEC
News |
Chart |
Request a new note
C
A
S
I |
Symbol/Exchange
Company Name
Industry Group |
PRICE |
CHANGE
(%Change) |
Day High |
Volume
(% DAV)
(% 50 day avg vol) |
52 Wk Hi
% From Hi |
Featured
Date |
Price
Featured |
Pivot Featured |
|
Max Buy |
PAYC
-
NYSE
Paycom Software Inc
COMPUTER SOFTWARE and SERVICES - Application Software
|
$108.04
|
-1.94
-1.76% |
$109.91
|
593,981
77.85% of 50 DAV
50 DAV is 763,000
|
$112.21
-3.71%
|
2/15/2018
|
$95.01
|
PP = $93.61
|
|
MB = $98.29
|
Most Recent Note - 3/14/2018 10:09:23 AM
G - Stubbornly holding its ground at its all-time high, very extended from any sound base. Prior highs in the $93 area define initial support above its 50 DMA line ($93.04). Fundamentals remain strong.
>>> FEATURED STOCK ARTICLE : Extended From Prior Base After Streak of Gains - 3/7/2018 |
View all notes |
Set NEW NOTE alert |
Company Profile |
SEC
News |
Chart |
Request a new note
C
A
S
I |
GRUB
-
NYSE
Grubhub Inc
COMPUTER SOFTWARE and SERVICES - Technical and System Software
|
$108.82
|
-1.71
-1.55% |
$109.80
|
1,933,038
102.12% of 50 DAV
50 DAV is 1,893,000
|
$112.41
-3.19%
|
6/21/2017
|
$47.33
|
PP = $46.94
|
|
MB = $49.29
|
Most Recent Note - 3/19/2018 6:00:24 PM
G - Pulling back from its all-time high, very extended from any sound base. Well above its 50 DMA line and prior highs defining near-term support. Recently reported earnings +61% on +49% sales revenues for the Dec '17 quarter.
>>> FEATURED STOCK ARTICLE : Bullish Action Followed Last Earnings Report - 3/1/2018 |
View all notes |
Set NEW NOTE alert |
Company Profile |
SEC
News |
Chart |
Request a new note
C
A
S
I |
HQY
-
NASDAQ
Healthequity Inc
COMPUTER SOFTWARE and SERVICES - Healthcare Information Service
|
$57.90
|
-1.49
-2.51% |
$59.40
|
858,405
141.65% of 50 DAV
50 DAV is 606,000
|
$60.00
-3.50%
|
2/20/2018
|
$56.37
|
PP = $55.41
|
|
MB = $58.18
|
Most Recent Note - 3/19/2018 6:02:44 PM
Y - Color code is changed to yellow after pulling back bellow its "max buy" level. Fundamentals remain strong.
>>> FEATURED STOCK ARTICLE : Fundamentals Remained Favorable and Strength Returned - 2/21/2018 |
View all notes |
Set NEW NOTE alert |
Company Profile |
SEC
News |
Chart |
Request a new note
C
A
S
I |
LOB
-
NASDAQ
Live Oak Bancshares Inc
Banks-Southeast
|
$28.75
|
+0.30
1.05% |
$29.00
|
168,689
125.89% of 50 DAV
50 DAV is 134,000
|
$28.85
-0.35%
|
3/16/2018
|
$28.63
|
PP = $28.30
|
|
MB = $29.72
|
Most Recent Note - 3/16/2018 5:57:22 PM
Y - Hit a new all-time high as it posted a gain above the pivot point cited based on its 1/25/18 high plus 10 cents after highlighted in yellow in the earlier mid-day report (read here). The gain and close above the pivot point was backed by +393% above average volume as it triggered a technical buy signal. Reported very strong sales revenues and earnings increases for the Sep and Dec '17 quarters. Completed a new Public Offering on 8/09/17. Prior quarterly and annual earnings (C and A criteria) history is a good match with the fact-based investment system's guidelines. See the latest FSU analysis for more details and a new annotated graph.
>>> FEATURED STOCK ARTICLE : Tallied Volume-Driven Gain for New High - 3/16/2018 |
View all notes |
Set NEW NOTE alert |
Company Profile |
SEC
News |
Chart |
Request a new note
C
A
S
I |
PYPL
-
NASDAQ
Paypal Holdings Inc
Finance-CrdtCard/PmtPr
|
$80.30
|
-1.86
-2.26% |
$81.44
|
8,866,407
87.36% of 50 DAV
50 DAV is 10,149,000
|
$86.32
-6.97%
|
2/1/2018
|
$80.35
|
PP = $79.49
|
|
MB = $83.46
|
Most Recent Note - 3/15/2018 1:00:47 PM
G - Gapped up on the prior session, rising considerably with above average volume after quietly consolidating above its 50 DMA line ($79.58). Subsequent losses below the 50 DMA line and recent low ($71.63 on 2/09/18) would raise concerns and trigger a more worrisome technical sell signals. Fundamentals remain strong.
>>> FEATURED STOCK ARTICLE : Quietly Consolidating Back Above 50-Day Moving Average - 2/26/2018 |
View all notes |
Set NEW NOTE alert |
Company Profile |
SEC
News |
Chart |
Request a new note
C
A
S
I |
Symbol/Exchange
Company Name
Industry Group |
PRICE |
CHANGE
(%Change) |
Day High |
Volume
(% DAV)
(% 50 day avg vol) |
52 Wk Hi
% From Hi |
Featured
Date |
Price
Featured |
Pivot Featured |
|
Max Buy |
OLLI
-
NASDAQ
Ollie's Bargain Outlet
Retail-DiscountandVariety
|
$59.90
|
-1.25
-2.04% |
$61.30
|
442,451
81.78% of 50 DAV
50 DAV is 541,000
|
$62.05
-3.46%
|
11/21/2017
|
$46.78
|
PP = $47.00
|
|
MB = $49.35
|
Most Recent Note - 3/19/2018 6:07:53 PM
G - Perched near its all-time high, extended from any sound base. Support is defined by its 50 DMA line ($56.81) and prior low ($50.15 on 1/04/18).
>>> FEATURED STOCK ARTICLE : Bargain Outlet's Shares Perched Near All-Time Price High - 3/13/2018 |
View all notes |
Set NEW NOTE alert |
Company Profile |
SEC
News |
Chart |
Request a new note
C
A
S
I |
WB
-
NASDAQ
Weibo Corp Cl A Ads
INTERNET - Content
|
$133.56
|
+0.53
0.40% |
$133.68
|
1,197,029
61.83% of 50 DAV
50 DAV is 1,936,000
|
$142.12
-6.02%
|
1/16/2018
|
$126.33
|
PP = $122.21
|
|
MB = $128.32
|
Most Recent Note - 3/19/2018 6:07:04 PM
G - Consolidating above its 50 DMA line ($128.85) which recently acted as support. Recently reported earnings +88% on +77% sales revenues for the Dec '17 quarter, continuing its strong earnings track record.
>>> FEATURED STOCK ARTICLE : Recent Consolidation is Not a New Base of Sufficient Length - 3/8/2018 |
View all notes |
Set NEW NOTE alert |
Company Profile |
SEC
News |
Chart |
Request a new note
C
A
S
I |
HLI
-
NYSE
Houlihan Lokey Inc Cl A
Finance-Invest Bnk/Bkrs
|
$47.46
|
+0.05
0.11% |
$47.79
|
231,112
76.53% of 50 DAV
50 DAV is 302,000
|
$52.81
-10.13%
|
1/3/2018
|
$45.88
|
PP = $47.09
|
|
MB = $49.44
|
Most Recent Note - 3/19/2018 6:01:14 PM
G - Priced a new Public Offering and gapped down on 3/12/18 for a volume-driven loss undercutting its 50 DMA line ($47.76) and raising concerns. The recent low ($43.73 on 2/06/18) defines near term support where a violation would raise greater concerns. Earnings +21% for the Dec '17 quarter were below the +25% minimum earnings guideline (C criteria).
>>> FEATURED STOCK ARTICLE : Recently Met Resistance at 50-Day Moving Average - 2/28/2018 |
View all notes |
Set NEW NOTE alert |
Company Profile |
SEC
News |
Chart |
Request a new note
C
A
S
I |
SQ
-
NYSE
Square Inc Cl A
Finance-CrdtCard/PmtPr
|
$54.58
|
-0.31
-0.56% |
$55.89
|
16,576,058
103.98% of 50 DAV
50 DAV is 15,941,000
|
$55.54
-1.73%
|
3/5/2018
|
$49.70
|
PP = $49.66
|
|
MB = $52.14
|
Most Recent Note - 3/19/2018 1:09:54 PM
G - Touched a new high today and it is extended from the prior base. Prior highs in the $49-47 area define initial support to watch on pullbacks. Fundamentals remain strong.
>>> FEATURED STOCK ARTICLE : New High & Considerable Gain Backed By Twice Average Volume - 3/5/2018 |
View all notes |
Set NEW NOTE alert |
Company Profile |
SEC
News |
Chart |
Request a new note
C
A
S
I |
SEND
-
NYSE
Sendgrid Inc
INTERNET - Content
|
$29.94
|
-0.63
-2.06% |
$30.65
|
270,624
117.15% of 50 DAV
50 DAV is 231,000
|
$32.03
-6.51%
|
3/6/2018
|
$28.00
|
PP = $28.37
|
|
MB = $29.79
|
Most Recent Note - 3/16/2018 4:53:27 PM
G - Churned above average volume the past 3 sessions without making progress, action indicative of distributional pressure. It is extended from the previously noted base. Prior highs in the $27-28 area define initial support to watch on pullbacks.
>>> FEATURED STOCK ARTICLE : Recently Profitable Internet - Content Firm Rallied to New High - 3/6/2018 |
View all notes |
Set NEW NOTE alert |
Company Profile |
SEC
News |
Chart |
Request a new note
C
A
S
I |
Symbol/Exchange
Company Name
Industry Group |
PRICE |
CHANGE
(%Change) |
Day High |
Volume
(% DAV)
(% 50 day avg vol) |
52 Wk Hi
% From Hi |
Featured
Date |
Price
Featured |
Pivot Featured |
|
Max Buy |