You are not logged in.
This means you
CAN ONLY VIEW reports that were published prior to Thursday, March 20, 2025.
You
MUST UPGRADE YOUR MEMBERSHIP if you want to see any current reports.
AFTER MARKET UPDATE - WEDNESDAY, NOVEMBER 15TH, 2017
Previous After Market Report Next After Market Report >>>
|
|
|
|
DOW |
-138.19 |
23,271.28 |
-0.59% |
|
Volume |
849,805,680 |
+1% |
|
Volume |
1,914,781,790 |
-3% |
|
NASDAQ |
-31.66 |
6,706.21 |
-0.47% |
|
Advancers |
1,064 |
36% |
|
Advancers |
1,140 |
43% |
|
S&P 500 |
-14.25 |
2,564.62 |
-0.55% |
|
Decliners |
1,860 |
64% |
|
Decliners |
1,498 |
57% |
|
Russell 2000 |
-7.16 |
1,464.09 |
-0.49% |
|
52 Wk Highs |
84 |
|
|
52 Wk Highs |
52 |
|
|
S&P 600 |
-4.80 |
889.94 |
-0.54% |
|
52 Wk Lows |
150 |
|
|
52 Wk Lows |
101 |
|
|
 |
Leadership Thins as Major Indices Pull Back
Kenneth J. Gruneisen - Passed the CAN SLIM® Master's Exam
Stocks finished lower Wednesday. The Dow lost 138 points to 23271. The S&P 500 dropped 14 points to 2564. The Nasdaq Composite was off 31 points to 6706. Volume totals reported were mixed, slightly higher than the prior session total on the NYSE and lower on the Nasdaq exchange. Decliners led advancers by about a 9-5 margin on the NYSE and by a 5-4 margin on the Nasdaq exchange. There were 22 high-ranked companies from the Leaders List that made new 52-week highs and were listed on the BreakOuts Page, down from the total of 41 on the prior session. New 52-week lows totals expanded and outnumbered shrinking new 52-week highs totals on the NYSE and on the Nasdaq exchange. The Featured Stocks Page provides the latest analysis on noteworthy high-ranked leaders. Charts used courtesy of www.stockcharts.com
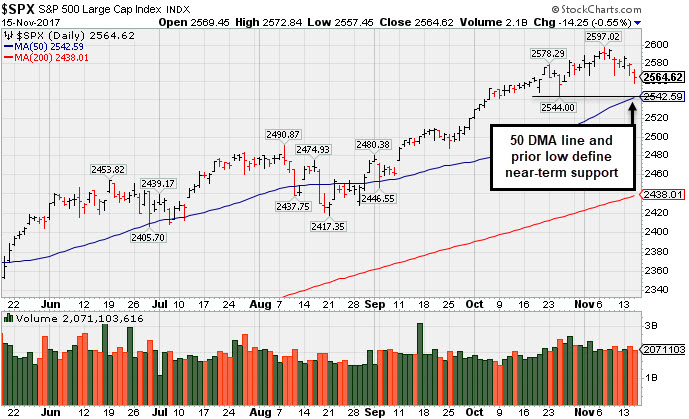 PICTURED: The S&P 500 Index fell for a 4th time in 5 sessions. The recent low and 50-day moving average (DMA) line define near-term support.
Leadership has recently been waning, however, the major averages (M criteria) are still in a confirmed uptrend. Investors should only consider stocks meeting all key criteria of the fact-based investment system as they trigger technical buy signals.
The major averages continued their recent slump as investors remain focused on U.S. tax reform and economic data. A report from the Wall Street Journal on Wednesday revealed the Senate GOP tax plan includes provisions that investors would have to sell their oldest shares first whenever a sale is placed. On the data front, a gauge of U.S. Core- inflation excluding food and fuel accelerated 0.1% year over year in October, marking the first uptick in the annualized reading since January. In a separate release, retail sales advanced 0.2% in October, above estimates.
Nine of 11 S&P 500 sectors finished lower. Financials outperformed as Bank of America (BAC +2.10%) rose on positive analyst commentary surrounding Warren Buffet’s increased stake in the bank. Energy shares were a notable underperformer Exxon Mobil (XOM -1.25%) and Conoco Phillips (COP -1.44%) in sympathy with oil prices. In earnings news, Target (TGT -9.87%) shares tumbled after the retailer revealed holiday sales guidance well below analyst expectations.
Treasuries were higher once again as the yield on the benchmark 10-year note dropped five basis points to 2.32%. In commodities, NYMEX WTI crude lost 0.8% to $55.25/barrel. COMEX gold was off 0.3% to $1279.20/ounce. |
 Kenneth J. Gruneisen started out as a licensed stockbroker in August 1987, a couple of months prior to the historic stock market crash that took the Dow Jones Industrial Average down -22.6% in a single day. He has published daily fact-based fundamental and technical analysis on high-ranked stocks online for two decades. Through FACTBASEDINVESTING.COM, Kenneth provides educational articles, news, market commentary, and other information regarding proven investment systems that work in good times and bad.
Comments contained in the body of this report are technical opinions only and are not necessarily those of Gruneisen Growth Corp. The material herein has been obtained from sources believed to be reliable and accurate, however, its accuracy and completeness cannot be guaranteed. Our firm, employees, and customers may effect transactions, including transactions contrary to any recommendation herein, or have positions in the securities mentioned herein or options with respect thereto. Any recommendation contained in this report may not be suitable for all investors and it is not to be deemed an offer or solicitation on our part with respect to the purchase or sale of any securities. |
|
 |
Bank and Biotech Indexes Rose; Energy and Retail Indexes Fell
Kenneth J. Gruneisen - Passed the CAN SLIM® Master's Exam
The Bank Index ($BKX +0.39%) eked out a small gain and the Broker/Dealer Index ($XBD -0.03%) finished flat while the Retail Index ($RLX -0.98%) fell on Wednesday. The tech sector was led by the Biotechnology Index ($BTK +0.74%) while the Networking Index ($NWX -0.41%) and the Semiconductor Index ($SOX -0.90%) both finished the session in the red. The Oil Services Index ($OSX -1.81%) and the Integrated Oil Index ($XOI -1.01%) both lost ground and the Gold & Silver Index ($XAU +0.05%) finished flat. Charts courtesy www.stockcharts.com
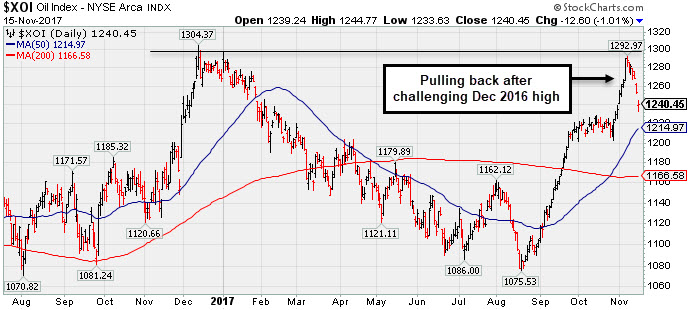 PICTURED: The Integrated Oil Index ($XOI -1.01%) has been pulling back after recently challenging its December 2016 high.
| Oil Services |
$OSX |
130.42 |
-2.40 |
-1.81% |
-29.04% |
| Integrated Oil |
$XOI |
1,240.45 |
-12.60 |
-1.01% |
-2.17% |
| Semiconductor |
$SOX |
1,293.20 |
-11.80 |
-0.90% |
+42.66% |
| Networking |
$NWX |
467.33 |
-1.91 |
-0.41% |
+4.76% |
| Broker/Dealer |
$XBD |
243.73 |
-0.08 |
-0.03% |
+18.73% |
| Retail |
$RLX |
1,594.88 |
-15.81 |
-0.98% |
+18.76% |
| Gold & Silver |
$XAU |
80.04 |
+0.04 |
+0.05% |
+1.50% |
| Bank |
$BKX |
99.11 |
+0.39 |
+0.40% |
+7.97% |
| Biotech |
$BTK |
4,075.22 |
+29.97 |
+0.74% |
+32.53% |
|
|
|
 |
Halted Slide After Damaging 50-Day Moving Average Breach
Kenneth J. Gruneisen - Passed the CAN SLIM® Master's Exam
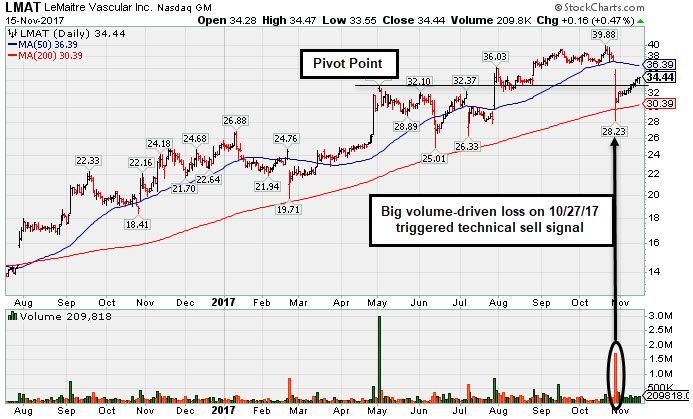
Lemaitre Vascular Inc's (LMAT +$0.16 or +0.47% to $34.44) Relative Strength rating has improved to 85, above the 80+ minimum guideline for buy candidates. A rebound above the 50-day moving average (DMA) line ($36.39) is still needed for its outlook to improve. Subsequent losses below the 200 DMA line and recent low would raise greater concerns. Disciplined investors avoid chasing extended stocks more than +5% above prior highs, and they always limit losses by selling any stock that falls more than -7% from their purchase price.
LMAT currently has a B Timeliness Rating and a C Sponsorship rating. It was last shown in this FSU section on 10/18/17 with an annotated graph under the headline, "Consolidating Above 50-Day Moving Average Before Earnings". Weak action triggering a technical sell signal came immediately after it reported Sep '17 quarterly earnings +47% on +7% sales revenues. The past 3 quarterly comparisons were above the +25% minimum guideline (C criteria), however, a reassuring sign.
The high-ranked Medical - Products firm was first highlighted in yellow with a pivot point based on its 9/20/16 high plus 10 cents in the 10/27/16 mid-day report (read here). More recently, it was highlighted in yellow in the 7/28/17 mid-day report (read here) with new pivot point cited based on its 5/02/17 high plus 10 cents.
Its current Up/Down Volume ratio of 1.1 is an unbiased indication that its shares were only under slight accumulation over the past 50 days. The number of top-rated funds owning its share rose from 184 in Dec '15 to 280 in Sep '17, a reassuring sign concerning the I criteria. Its small supply of 14.6 million shares (S criteria) in the public float can contribute to greater price volatility in the event of institutional buying or selling. |
|
|
Color Codes Explained :
Y - Better candidates highlighted by our
staff of experts.
G - Previously featured
in past reports as yellow but may no longer be buyable under the
guidelines.
***Last / Change / Volume data in this table is the closing quote data***
Symbol/Exchange
Company Name
Industry Group |
PRICE |
CHANGE
(%Change) |
Day High |
Volume
(% DAV)
(% 50 day avg vol) |
52 Wk Hi
% From Hi |
Featured
Date |
Price
Featured |
Pivot Featured |
|
Max Buy |
THO
-
NYSE
Thor Industries Inc
AUTOMOTIVE - Recreational Vehicles
|
$131.99
|
+0.22
0.17% |
$132.82
|
557,907
81.92% of 50 DAV
50 DAV is 681,000
|
$138.07
-4.40%
|
8/14/2017
|
$106.67
|
PP = $110.01
|
|
MB = $115.51
|
Most Recent Note - 11/10/2017 4:58:55 PM
G - Still very extended from the previously noted base. Its 50 DMA line ($124.29) defines near-term support above prior highs in the $115 area. Fundamentals remain strong. See the latest FSU analysis for more details and a new annotated graph.
>>> FEATURED STOCK ARTICLE : Encountered Distributional Pressure After Getting Extended From Base - 11/10/2017 |
View all notes |
Set NEW NOTE alert |
Company Profile |
SEC
News |
Chart |
Request a new note
C
A
S
I |
PFBC
-
NASDAQ
Preferred Bank Los Angls
BANKING - Regional - Pacific Banks
|
$59.05
|
+0.17
0.29% |
$59.27
|
47,422
60.10% of 50 DAV
50 DAV is 78,900
|
$66.58
-11.31%
|
10/10/2017
|
$59.38
|
PP = $59.08
|
|
MB = $62.03
|
 Most Recent Note - 11/15/2017 6:23:33 PM
Y - Consolidating above its 50 DMA line ($58.06) which has recently acted as support. Slumped below prior highs in the $60 area raising concerns while completely negating the recent breakout.
>>> FEATURED STOCK ARTICLE : Slump Back Into Prior Base Raised Concerns - 11/8/2017 |
View all notes |
Set NEW NOTE alert |
Company Profile |
SEC
News |
Chart |
Request a new note
C
A
S
I |
AVGO
-
NASDAQ
Broadcom Limited
ELECTRONICS - Semiconductor - Broad Line
|
$265.60
|
+2.34
0.89% |
$267.00
|
2,894,170
97.51% of 50 DAV
50 DAV is 2,968,000
|
$281.80
-5.75%
|
10/30/2017
|
$261.19
|
PP = $259.46
|
|
MB = $272.43
|
Most Recent Note - 11/13/2017 5:17:18 PM
Y - Quietly consolidating above prior highs in the $259 area defining initial support to watch. Pulled back from its all-time high following 11/06/17 news it made a bid for Qualcomm Inc (QCOM). See the latest FSU analysis for more details and a new annotated graph.
>>> FEATURED STOCK ARTICLE : Consolidating Near Record High Following Volume-Driven Gains - 11/13/2017 |
View all notes |
Set NEW NOTE alert |
Company Profile |
SEC
News |
Chart |
Request a new note
C
A
S
I |
YY
-
NASDAQ
YY Inc Ads
INTERNET - Internet Service Providers
|
$111.39
|
+22.16
24.83% |
$111.52
|
10,435,222
803.33% of 50 DAV
50 DAV is 1,299,000
|
$97.59
14.14%
|
9/25/2017
|
$80.26
|
PP = $83.10
|
|
MB = $87.26
|
Most Recent Note - 11/15/2017 1:10:38 PM
G - Hit a new all-time high with today's gap up and big volume-driven gain, getting more extended from any sound base. Reported Sep '17 quarterly earnings +42% on +49% sales revenues. Volume and volatility often increase near earnings news. Found support when consolidating above its 50 DMA line ($87.33). Patient investors may watch for a new base or secondary buy point to possibly develop and be noted in the weeks ahead. See the latest FSU analysis for more details and an annotated graph.
>>> FEATURED STOCK ARTICLE : Chinese Social Media Firm Reported Earnings - 11/14/2017 |
View all notes |
Set NEW NOTE alert |
Company Profile |
SEC
News |
Chart |
Request a new note
C
A
S
I |
STMP
-
NASDAQ
Stamps.com Inc
INTERNET - Internet Software and Services
|
$174.30
|
-0.75
-0.43% |
$175.63
|
368,789
83.25% of 50 DAV
50 DAV is 443,000
|
$233.13
-25.23%
|
9/11/2017
|
$193.65
|
PP = $220.35
|
|
MB = $231.37
|
Most Recent Note - 11/13/2017 3:47:05 PM
G - Holding its ground well above its 200 DMA line ($157) since its gap down on 11/03/17 for a damaging volume-driven loss. Fundamentals remain strong. A rebound above the 50 DMA line ($206.58) is needed for its outlook to improve.
>>> FEATURED STOCK ARTICLE : Perched Near Record High Ahead of Earnings News - 11/1/2017 |
View all notes |
Set NEW NOTE alert |
Company Profile |
SEC
News |
Chart |
Request a new note
C
A
S
I |
Symbol/Exchange
Company Name
Industry Group |
PRICE |
CHANGE
(%Change) |
Day High |
Volume
(% DAV)
(% 50 day avg vol) |
52 Wk Hi
% From Hi |
Featured
Date |
Price
Featured |
Pivot Featured |
|
Max Buy |
HTHT
-
NASDAQ
China Lodging Group Ads
LEISURE - Lodging
|
$123.69
|
-0.97
-0.78% |
$123.97
|
605,957
139.62% of 50 DAV
50 DAV is 434,000
|
$142.80
-13.38%
|
9/29/2016
|
$46.12
|
PP = $47.82
|
|
MB = $50.21
|
Most Recent Note - 11/15/2017 12:32:39 PM
G - Has not formed a sound base and it is sputtering below its 50 DMA line ($124.98) today, still consolidating since proposing a new Public Offering on 10/26/17. Earnings +19% on +18% sales revenues for the Jun '17 quarter were below the +25% minimum earnings guideline (C criteria), raising fundamental concerns.
>>> FEATURED STOCK ARTICLE : Testing 50-Day Moving Average Line After Proposed Offering - 11/2/2017 |
View all notes |
Set NEW NOTE alert |
Company Profile |
SEC
News |
Chart |
Request a new note
C
A
S
I |
LMAT
-
NASDAQ
Lemaitre Vascular Inc
Medical-Products
|
$34.44
|
+0.16
0.47% |
$34.47
|
209,818
100.87% of 50 DAV
50 DAV is 208,000
|
$39.88
-13.64%
|
7/28/2017
|
$33.50
|
PP = $33.32
|
|
MB = $34.99
|
Most Recent Note - 11/15/2017 6:20:32 PM
G - Its Relative Strength rating has improved to 85, above the 80+ minimum guideline for buy candidates. A rebound above the 50 DMA line ($36.39) is needed for its outlook to improve. Losses below the 200 DMA line and recent low would raise greater concerns. See the latest FSU analysis for more details and a new annotated graph.
>>> FEATURED STOCK ARTICLE : Halted Slide After Damaging 50-Day Moving Average Breach - 11/15/2017 |
View all notes |
Set NEW NOTE alert |
Company Profile |
SEC
News |
Chart |
Request a new note
C
A
S
I |
PATK
-
NASDAQ
Patrick Industries Inc
Bldg-Mobile/Mfg and RV
|
$86.95
|
-1.10
-1.25% |
$87.90
|
76,546
93.35% of 50 DAV
50 DAV is 82,000
|
$96.25
-9.66%
|
10/26/2017
|
$90.90
|
PP = $87.90
|
|
MB = $92.30
|
Most Recent Note - 11/13/2017 1:05:00 PM
Y - Recently consolidating near prior highs in the $86-87 area which define initial support to watch above its 50 DMA line ($83.47). Fundamentals remain strong.
>>> FEATURED STOCK ARTICLE : Volume 4 Times Average Behind Breakout Gain on Earnings News - 10/26/2017 |
View all notes |
Set NEW NOTE alert |
Company Profile |
SEC
News |
Chart |
Request a new note
C
A
S
I |
ESNT
-
NYSE
Essent Group Ltd
Finance-MrtgandRel Svc
|
$43.89
|
+1.57
3.71% |
$43.97
|
1,068,024
121.50% of 50 DAV
50 DAV is 879,000
|
$45.10
-2.68%
|
10/9/2017
|
$39.75
|
PP = $41.54
|
|
MB = $43.62
|
Most Recent Note - 11/13/2017 10:32:53 AM
Y - Consolidating above its 50 DMA line ($40.80) and recent low ($39.79 on 11/03/17) defining important near-term support. Relative Strength rating has slumped to 79, below the 80+ minimum guideline for buy candidates. More damaging losses would trigger a technical sell signal. Reported Sep '17 earnings +26% on +24% sales revenues.
>>> FEATURED STOCK ARTICLE : Perched Near High After Streak of Gains - 10/24/2017 |
View all notes |
Set NEW NOTE alert |
Company Profile |
SEC
News |
Chart |
Request a new note
C
A
S
I |
FIVE
-
NASDAQ
Five Below Inc
Retail-DiscountandVariety
|
$57.93
|
-0.42
-0.72% |
$58.05
|
513,429
72.21% of 50 DAV
50 DAV is 711,000
|
$58.69
-1.29%
|
10/6/2017
|
$57.13
|
PP = $54.23
|
|
MB = $56.94
|
Most Recent Note - 11/13/2017 3:51:48 PM
G - Color code is changed to green after quietly rising above its "max buy" level today and hitting another new all-time high. Prior highs and its 50 DMA line define support in the $54 area.
>>> FEATURED STOCK ARTICLE : Prior Highs Define Important Support While Consolidating - 10/31/2017 |
View all notes |
Set NEW NOTE alert |
Company Profile |
SEC
News |
Chart |
Request a new note
C
A
S
I |
Symbol/Exchange
Company Name
Industry Group |
PRICE |
CHANGE
(%Change) |
Day High |
Volume
(% DAV)
(% 50 day avg vol) |
52 Wk Hi
% From Hi |
Featured
Date |
Price
Featured |
Pivot Featured |
|
Max Buy |
OLED
-
NASDAQ
Universal Display Corp
Elec-Misc Products
|
$172.85
|
-4.60
-2.59% |
$176.20
|
1,056,714
115.74% of 50 DAV
50 DAV is 913,000
|
$178.71
-3.28%
|
8/31/2017
|
$128.22
|
PP = $127.78
|
|
MB = $134.17
|
Most Recent Note - 11/15/2017 12:43:39 PM
G - Hovering near its all-time high after a streak of gains, very extended from any sound base pattern. Reported Sep '17 quarterly earnings of 28 cents per share versus a year-ago loss of 3 cents per share on sales revenues +104%. Prior highs in the $145 area and its 50 DMA line ($139.87) define important near-term support to watch on pullbacks.
>>> FEATURED STOCK ARTICLE : Prior Highs and 50-Day Average Define Near-Term Support - 10/25/2017 |
View all notes |
Set NEW NOTE alert |
Company Profile |
SEC
News |
Chart |
Request a new note
C
A
S
I |
ANET
-
NYSE
Arista Networks Inc
TELECOMMUNICATIONS - Communication Equipment
|
$224.90
|
-2.20
-0.97% |
$228.00
|
616,464
81.01% of 50 DAV
50 DAV is 761,000
|
$228.86
-1.73%
|
10/27/2017
|
$195.65
|
PP = $196.37
|
|
MB = $206.19
|
Most Recent Note - 11/10/2017 12:13:25 PM
G - Rallying further into new high territory today, getting very extended from the previously noted base. See the latest FSU analysis for more details and an annotated graph.
>>> FEATURED STOCK ARTICLE : Perched at Record High Following Volume-Driven Gains - 11/9/2017 |
View all notes |
Set NEW NOTE alert |
Company Profile |
SEC
News |
Chart |
Request a new note
C
A
S
I |
GRUB
-
NYSE
Grubhub Inc
COMPUTER SOFTWARE and SERVICES - Technical and System Software
|
$62.99
|
-0.09
-0.14% |
$63.41
|
663,405
37.17% of 50 DAV
50 DAV is 1,785,000
|
$63.81
-1.29%
|
6/21/2017
|
$47.33
|
PP = $46.94
|
|
MB = $49.29
|
Most Recent Note - 11/13/2017 3:55:16 PM
G - Hitting another new all-time high today, adding to recent gains lacking great volume conviction, getting extended from any sound base. Reported Sep '17 quarterly earnings +22% on +32% sales revenues. The 2 latest quarters were below the +25% minimum earnings guideline (C criteria), raising fundamental concerns with regard to the fact-based investment system.
>>> FEATURED STOCK ARTICLE : Technical Strength in Popular Internet Platform - 10/27/2017 |
View all notes |
Set NEW NOTE alert |
Company Profile |
SEC
News |
Chart |
Request a new note
C
A
S
I |
IBP
-
NYSE
Installed Building Prod
DIVERSIFIED SERVICES - Business/Management Services
|
$67.65
|
+0.35
0.52% |
$68.25
|
255,053
141.70% of 50 DAV
50 DAV is 180,000
|
$70.25
-3.70%
|
9/19/2017
|
$59.15
|
PP = $60.10
|
|
MB = $63.11
|
Most Recent Note - 11/14/2017 12:46:32 PM
G - Rebounded above its 50 DMA line ($63.21) helping its outlook improve. Color code is changed to green after rising back above its "max buy" level. Subsequent losses below the recent low ($59.84 on 11/08/17) would raise more serious concerns.
>>> FEATURED STOCK ARTICLE : 50-Day Moving Average Violation Triggered Technical Sell Signal - 11/7/2017 |
View all notes |
Set NEW NOTE alert |
Company Profile |
SEC
News |
Chart |
Request a new note
C
A
S
I |
HQY
-
NASDAQ
"HealthEquity, Inc"
COMPUTER SOFTWARE and SERVICES - Healthcare Information Service
|
$49.86
|
+0.09
0.18% |
$51.08
|
448,828
83.81% of 50 DAV
50 DAV is 535,500
|
$55.31
-9.85%
|
11/6/2017
|
$54.63
|
PP = $52.87
|
|
MB = $55.51
|
Most Recent Note - 11/14/2017 5:39:28 PM
Y - Abruptly retreated back into the prior base, raising concerns after a recent breakout. Disciplined investors always limit losses by selling any stock that falls more than -7% from their purchase price. Tested and found support at its 50 DMA line ($49.23). Three of the past 4 quarterly comparisons through Jul '17 were above the +25% minimum earnings guideline (C criteria).
>>> FEATURED STOCK ARTICLE : Hit New High With Big Volume-Driven Gain - 11/6/2017 |
View all notes |
Set NEW NOTE alert |
Company Profile |
SEC
News |
Chart |
Request a new note
C
A
S
I |
Symbol/Exchange
Company Name
Industry Group |
PRICE |
CHANGE
(%Change) |
Day High |
Volume
(% DAV)
(% 50 day avg vol) |
52 Wk Hi
% From Hi |
Featured
Date |
Price
Featured |
Pivot Featured |
|
Max Buy |
OLLI
-
NASDAQ
Ollie's Bargain Outlet
Retail-DiscountandVariety
|
$43.30
|
-0.65
-1.48% |
$44.00
|
323,186
72.46% of 50 DAV
50 DAV is 446,000
|
$46.90
-7.68%
|
9/8/2017
|
$45.20
|
PP = $46.18
|
|
MB = $48.49
|
Most Recent Note - 11/14/2017 5:35:24 PM
G - Still sputtering below its 50 DMA line, and a rebound above that important short-term average ($45.19) is needed for its outlook to improve. Prior low ($41.30 on 8/31/17) defines the next important support level where further deterioration would raise more serious concerns.
>>> FEATURED STOCK ARTICLE : Sell Signal Triggered by 50-Day Moving Average Violation on Higher Volume - 10/30/2017 |
View all notes |
Set NEW NOTE alert |
Company Profile |
SEC
News |
Chart |
Request a new note
C
A
S
I |
HLI
-
NYSE
Houlihan Lokey Inc Cl A
Finance-Invest Bnk/Bkrs
|
$42.40
|
+0.02
0.05% |
$42.46
|
197,228
68.72% of 50 DAV
50 DAV is 287,000
|
$44.15
-3.96%
|
9/18/2017
|
$37.04
|
PP = $39.78
|
|
MB = $41.77
|
Most Recent Note - 11/14/2017 5:36:44 PM
G - Color code is changed to green after rising above its "max buy" level. On 10/26/17 it priced a Secondary Offering. Such offerings typically hinder price performance for a short time, yet they also help to attract new or greater institutional interest (I criteria). Reported earnings +51% on +30% sales revenues for its second quarter ended September 30th versus the year-ago period.
>>> FEATURED STOCK ARTICLE : Recent Gains Lacked Volume; Earnings Report Due Soon - 10/23/2017 |
View all notes |
Set NEW NOTE alert |
Company Profile |
SEC
News |
Chart |
Request a new note
C
A
S
I |
ICHR
-
NASDAQ
Ichor Holdings Ltd
ELECTRONICS - Semiconductor Equipment
|
$26.82
|
-0.61
-2.22% |
$27.72
|
856,759
104.48% of 50 DAV
50 DAV is 820,000
|
$35.51
-24.47%
|
10/10/2017
|
$29.39
|
PP = $28.36
|
|
MB = $29.78
|
Most Recent Note - 11/13/2017 10:17:54 AM
G - Color code is changed to green after violating its 50 DMA line ($28.03) with today's gap down and 4th consecutive loss raising greater concerns. Only a prompt rebound above the 50 DMA line would help its outlook improve.
>>> FEATURED STOCK ARTICLE : Undercut Prior Highs and Tested 50-Day Moving Average Line - 11/3/2017 |
View all notes |
Set NEW NOTE alert |
Company Profile |
SEC
News |
Chart |
Request a new note
C
A
S
I |
|
|
|
THESE ARE NOT BUY RECOMMENDATIONS!
Comments contained in the body of this report are technical
opinions only. The material herein has been obtained
from sources believed to be reliable and accurate, however,
its accuracy and completeness cannot be guaranteed.
This site is not an investment advisor, hence it does
not endorse or recommend any securities or other investments.
Any recommendation contained in this report may not
be suitable for all investors and it is not to be deemed
an offer or solicitation on our part with respect to
the purchase or sale of any securities. All trademarks,
service marks and trade names appearing in this report
are the property of their respective owners, and are
likewise used for identification purposes only.
This report is a service available
only to active Paid Premium Members.
You may opt-out of receiving report notifications
at any time. Questions or comments may be submitted
by writing to Premium Membership Services 665 S.E. 10 Street, Suite 201 Deerfield Beach, FL 33441-5634 or by calling 1-800-965-8307
or 954-785-1121.
|
|
|