You are not logged in.
This means you
CAN ONLY VIEW reports that were published prior to Thursday, March 20, 2025.
You
MUST UPGRADE YOUR MEMBERSHIP if you want to see any current reports.
AFTER MARKET UPDATE - FRIDAY, FEBRUARY 23RD, 2018
Previous After Market Report Next After Market Report >>>
|
|
|
|
DOW |
+347.51 |
25,309.99 |
+1.39% |
|
Volume |
726,278,320 |
-13% |
|
Volume |
1,882,159,070 |
-1% |
|
NASDAQ |
+127.30 |
7,337.39 |
+1.77% |
|
Advancers |
2,421 |
82% |
|
Advancers |
2,163 |
74% |
|
S&P 500 |
+43.34 |
2,747.30 |
+1.60% |
|
Decliners |
529 |
18% |
|
Decliners |
766 |
26% |
|
Russell 2000 |
+19.20 |
1,549.19 |
+1.25% |
|
52 Wk Highs |
46 |
|
|
52 Wk Highs |
69 |
|
|
S&P 600 |
+11.63 |
946.55 |
+1.24% |
|
52 Wk Lows |
31 |
|
|
52 Wk Lows |
61 |
|
|
 |
Major Indices Ended Strong on Holiday Shortened Week
Kenneth J. Gruneisen - Passed the CAN SLIM® Master's Exam
For the holiday shortened week, the Dow was up 0.4% the S&P 500 gained 0.6% and the Nasdaq Composite advanced 1.4%. Stocks finished firmly higher on Friday. The Dow rallied 348 points to 25309. The S&P 500 increased 43 points to 2747 and the Nasdaq Composite climbed 127 points to close at 7337. The volume totals reported were lighter than the prior session totals on both the NYSE and the Nasdaq exchange, revealing less institutional buying demand. Advancers led decliners by more than a 4-1 margin on the NYSE and nearly 3-1 on the Nasdaq exchange. New 52-week highs outnumbered new 52-week lows on both the Nasdaq exchange and the NYSE. There were 31 high-ranked companies from the Leaders List that made new 52-week highs and were listed on the BreakOuts Page, versus the total of 19 on the prior session. Charts used courtesy of www.stockcharts.com
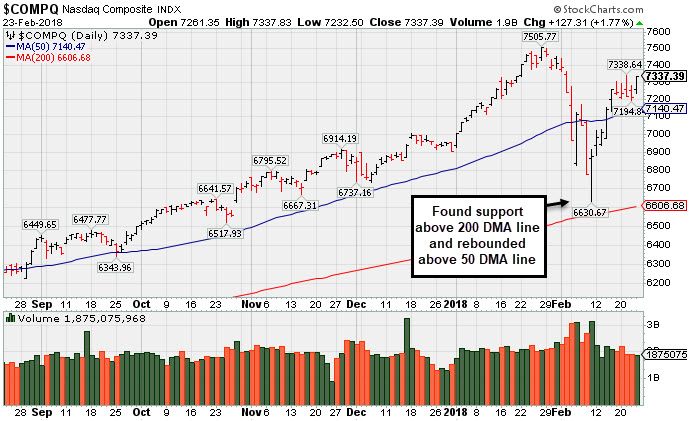 PICTURED: The Nasdaq Composite Index found support above its 200-day moving average (DMA) line and rebounded above its 50 DMA line. The major indices (M criteria) are in a confirmed uptrend. New buying efforts may be justified under the fact-based investment system, however, only when all key criteria of the fact-based investment system are satisfied. The Featured Stocks Pageprovides the latest analysis on noteworthy high-ranked leaders.
The major averages ended the week on a positive note attributed to easing concerns surrounding interest rates. With no data releases today, investors focused on commentary from the Fed. In a semi-annual report to Congress, the central bank suggested there’s no change in expectations for a rate increase at the March FOMC meeting. Next week, Chair Jerome Powell is scheduled to testify before lawmakers providing an update on the economy and monetary policy.
All 11 S&P 500 sectors were up on the session led by Utilities, Energy and Technology. Dominion (D +2.64%) and ConocoPhillips (COP +3.90%) both rose in sympathy with higher oil prices. Shares of Hewlett-Packard Enterprises (HPE +10.54%) and HP Inc. (HPQ +3.4%) rose following their better-than-expected earnings results. General Mills (GIS -3.59%) was the notable decliner in the S&P 500, falling after announcing it would buy pet food maker Blue Buffalo (BUFF +17.23%) for $8 billion.
Treasury yields declined with the benchmark 10-year note down five basis points to 2.87%. In commodities, NYMEX WTI crude added 1.2% to $63.53/barrel. COMEX gold was 0.2% lower at $1328.30/ounce. |
 Kenneth J. Gruneisen started out as a licensed stockbroker in August 1987, a couple of months prior to the historic stock market crash that took the Dow Jones Industrial Average down -22.6% in a single day. He has published daily fact-based fundamental and technical analysis on high-ranked stocks online for two decades. Through FACTBASEDINVESTING.COM, Kenneth provides educational articles, news, market commentary, and other information regarding proven investment systems that work in good times and bad.
Comments contained in the body of this report are technical opinions only and are not necessarily those of Gruneisen Growth Corp. The material herein has been obtained from sources believed to be reliable and accurate, however, its accuracy and completeness cannot be guaranteed. Our firm, employees, and customers may effect transactions, including transactions contrary to any recommendation herein, or have positions in the securities mentioned herein or options with respect thereto. Any recommendation contained in this report may not be suitable for all investors and it is not to be deemed an offer or solicitation on our part with respect to the purchase or sale of any securities. |
|
 |
Energy, Tech, Retail and Financial Groups Rose
Kenneth J. Gruneisen - Passed the CAN SLIM® Master's Exam
Financial groups rose as the Broker/Dealer Index ($XBD +1.45%) and the Bank Index ($BKX +1.69%) both posted gains on Friday. The Retail Index ($RLX +1.37%) finished higher. The tech sector had a positive bias as the Semiconductor Index ($SOX +2.19%), Networking Index ($NWX +1.35%), and the Biotechnology Index ($BTK +2.03%) posted unanimous gains. Energy-linked shares were solid gainers as the Oil Services Index ($OSX +2.79%) and Integrated Oil Index ($XOI +1.94%) both rose. The Gold & Silver Index ($XAU +0.64%) also edged higher. Charts courtesy wwwstockcharts.com
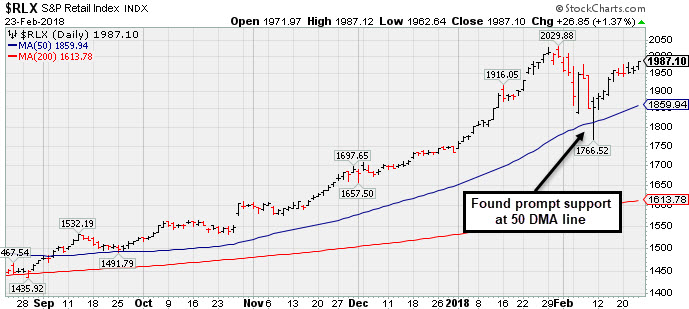 PICTURED: The Retail Index ($RLX +1.37%) recently found prompt support at its 50-day moving average (DMA) line.
| Oil Services |
$OSX |
141.21 |
+3.83 |
+2.79% |
-5.58% |
| Integrated Oil |
$XOI |
1,319.88 |
+25.09 |
+1.94% |
-1.17% |
| Semiconductor |
$SOX |
1,351.09 |
+29.00 |
+2.19% |
+7.82% |
| Networking |
$NWX |
516.37 |
+6.90 |
+1.35% |
+5.27% |
| Broker/Dealer |
$XBD |
282.61 |
+4.03 |
+1.45% |
+6.55% |
| Retail |
$RLX |
1,987.10 |
+26.85 |
+1.37% |
+14.61% |
| Gold & Silver |
$XAU |
80.53 |
+0.51 |
+0.64% |
-5.56% |
| Bank |
$BKX |
114.23 |
+1.89 |
+1.68% |
+7.05% |
| Biotech |
$BTK |
4,695.85 |
+93.65 |
+2.03% |
+11.22% |
|
|
|
 |
Repaired Recent Technical Damage But Has Not Formed a New Base
Kenneth J. Gruneisen - Passed the CAN SLIM® Master's Exam
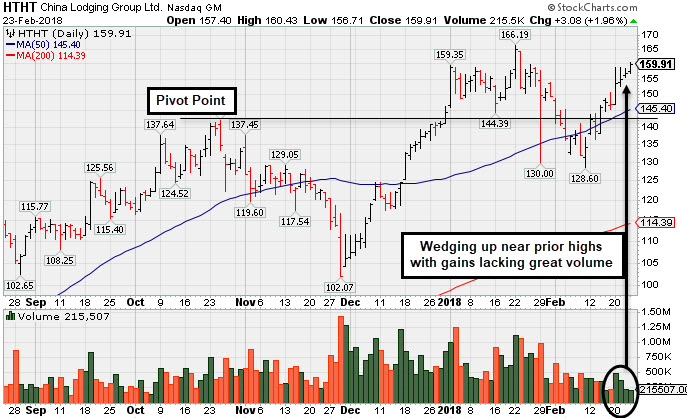
China Lodging Group Ads (HTHT +$3.08 or +1.96% to $159.91) repaired some recent technical damage and is now consolidating above its 50-day moving average (DMA) line ($145.40), but it has not formed a sound base. It went through a choppy consolidation since last shown in this FSU section on 1/24/18 with an annotated graph under the headline, "Found Support Above Prior High After Latest Breakout". Subsequent losses below the prior low ($128.60 on 2/09/18) the would raise greater concerns.
On 12/22/17 its color code was changed to yellow with a new pivot point cited based on its 10/25/17 high plus 10 cents. A considerable volume-driven gain for new highs on 1/02/18 triggered a new (or add-on) technical buy signal. HTHT traded up as much as +327% since first featured in yellow in the 7/13/16 mid-day report (read here). The number of top-rated funds owing its shares rose from 87 in Sep '15 to 248 in Dec '17 a reassuring sign concerning the I criteria.
Fundamentals remain strong, as it reported Sep '17 quarterly earnings +58% on +34% sales revenues versus the year ago period, above the +25% minimum earnings guideline (C criteria). Sequential quarterly comparisons have also shown encouraging sales revenues growth acceleration, up +4%, +18%, and +34% in the Mar, Jun, and Sep '17 quarters, respectively.
Currently the high-ranked Leisure- Lodging firm has an A Timeliness rating, and an A Sponsorship rating. Its small supply of 27.3 million shares (S criteria) in the public float may contribute to greater price volatility in the event of institutional buying or selling.
|
|
|
Color Codes Explained :
Y - Better candidates highlighted by our
staff of experts.
G - Previously featured
in past reports as yellow but may no longer be buyable under the
guidelines.
***Last / Change / Volume data in this table is the closing quote data***
Symbol/Exchange
Company Name
Industry Group |
PRICE |
CHANGE
(%Change) |
Day High |
Volume
(% DAV)
(% 50 day avg vol) |
52 Wk Hi
% From Hi |
Featured
Date |
Price
Featured |
Pivot Featured |
|
Max Buy |
TPL
-
NYSE
Texas Pacific Land Trust
FINANCIAL SERVICES - Diversified Investments
|
$525.60
|
+13.60
2.66% |
$536.00
|
13,210
73.39% of 50 DAV
50 DAV is 18,000
|
$569.99
-7.79%
|
2/20/2018
|
$517.00
|
PP = $569.99
|
|
MB = $598.49
|
Most Recent Note - 2/22/2018 5:26:09 PM
Y - Consolidating in an orderly fashion above its 50 DMA line. A valid secondary buy point exists up to +5% above the latest high after it successfully tested the 10 week moving average (WMA) line following an earlier technical breakout. Reported earnings +29% on +118% sales revenues for the Dec '17 quarter. See the latest FSU analysis for more details and a new annotated graph.
>>> FEATURED STOCK ARTICLE : Finding Support Above 50-Day Moving Average Line - 2/22/2018 |
View all notes |
Set NEW NOTE alert |
Company Profile |
SEC
News |
Chart |
Request a new note
C
A
S
I |
YY
-
NASDAQ
YY Inc
INTERNET - Internet Service Providers
|
$136.25
|
+6.49
5.00% |
$136.96
|
936,010
83.20% of 50 DAV
50 DAV is 1,125,000
|
$142.97
-4.70%
|
12/29/2017
|
$113.06
|
PP = $123.58
|
|
MB = $129.76
|
 Most Recent Note - 2/23/2018 5:19:06 PM
G - Consolidating above its 50 DMA line ($124.84), but it has not formed a sound new base of sufficient length.
>>> FEATURED STOCK ARTICLE : Retreating After +78% Rally in 5 Months - 2/2/2018 |
View all notes |
Set NEW NOTE alert |
Company Profile |
SEC
News |
Chart |
Request a new note
C
A
S
I |
LOGM
-
NASDAQ
Logmein Inc
INTERNET - Internet Software andamp; Services
|
$117.60
|
-0.30
-0.25% |
$119.85
|
550,436
90.40% of 50 DAV
50 DAV is 608,900
|
$134.80
-12.76%
|
2/15/2018
|
$132.35
|
PP = $129.61
|
|
MB = $136.09
|
Most Recent Note - 2/20/2018 2:18:55 PM
G - Color code is changed to green while slumping below its 50 DMA line ($120.34) with above average volume behind another loss today raising greater concerns. Only a prompt rebound above the 50 DMA line would help its outlook improve.
>>> FEATURED STOCK ARTICLE : Technical Breakout Came Ahead of Earnings News - 2/15/2018 |
View all notes |
Set NEW NOTE alert |
Company Profile |
SEC
News |
Chart |
Request a new note
C
A
S
I |
HTHT
-
NASDAQ
China Lodging Group Ads
LEISURE - Lodging
|
$159.91
|
+3.08
1.96% |
$160.43
|
215,507
35.50% of 50 DAV
50 DAV is 607,000
|
$166.19
-3.78%
|
12/22/2017
|
$138.07
|
PP = $142.90
|
|
MB = $150.05
|
Most Recent Note - 2/23/2018 5:20:45 PM
G - Posted a 4th consecutive gain with below average volume, wedging toward prior highs. Still consolidating above its 50 DMA line ($145.40), but it has not formed a sound base of sufficient length. See the latest FSU analysis for more details and a new annotated graph.
>>> FEATURED STOCK ARTICLE : Repaired Recent Technical Damage But Has Not Formed a New Base - 2/23/2018 |
View all notes |
Set NEW NOTE alert |
Company Profile |
SEC
News |
Chart |
Request a new note
C
A
S
I |
PETS
-
NASDAQ
Petmed Express Inc
RETAIL - Drug Stores
|
$47.20
|
+1.97
4.36% |
$47.25
|
455,057
62.94% of 50 DAV
50 DAV is 723,000
|
$57.80
-18.34%
|
1/19/2018
|
$53.59
|
PP = $51.00
|
|
MB = $53.55
|
Most Recent Note - 2/23/2018 5:22:37 PM
G - Quietly rebounded and closed above the 50 DMA line ($46.69) helping its outlook improve. Faces resistance due to overhead supply up to the $57 level. Recently reported earnings +83% on +14% sales revenues, continuing its strong earnings track record.
>>> FEATURED STOCK ARTICLE : Sputtering Below 50-Day Average After Negative Reversal - 2/14/2018 |
View all notes |
Set NEW NOTE alert |
Company Profile |
SEC
News |
Chart |
Request a new note
C
A
S
I |
Symbol/Exchange
Company Name
Industry Group |
PRICE |
CHANGE
(%Change) |
Day High |
Volume
(% DAV)
(% 50 day avg vol) |
52 Wk Hi
% From Hi |
Featured
Date |
Price
Featured |
Pivot Featured |
|
Max Buy |
DPZ
-
NYSE
Dominos Pizza Inc
WHOLESALE - Food Wholesale
|
$228.85
|
+1.85
0.81% |
$229.25
|
1,013,741
89.40% of 50 DAV
50 DAV is 1,134,000
|
$236.00
-3.03%
|
2/20/2018
|
$224.86
|
PP = $222.01
|
|
MB = $233.11
|
Most Recent Note - 2/21/2018 11:57:53 AM
Y - Hitting another new high today. Finished the prior session below the pivot point after highlighted in the mid-day report in yellow with pivot point cited based on its 1/25/18 high plus 10 cents. See the latest FSU analysis for more details and an annotated graph.
>>> FEATURED STOCK ARTICLE : Popular Pizza Firm Met Resistance Near Prior High - 2/20/2018 |
View all notes |
Set NEW NOTE alert |
Company Profile |
SEC
News |
Chart |
Request a new note
C
A
S
I |
ESNT
-
NYSE
Essent Group Ltd
Finance-MrtgandRel Svc
|
$47.08
|
+0.84
1.82% |
$47.08
|
489,652
72.77% of 50 DAV
50 DAV is 672,900
|
$50.08
-5.99%
|
10/9/2017
|
$39.75
|
PP = $41.54
|
|
MB = $43.62
|
Most Recent Note - 2/21/2018 5:29:28 PM
G - Quietly consolidating above its 50 DMA line ($46.22) after a "positive reversal" when testing support near its 200 DMA line. More damaging losses would raise greater concerns. Reported earnings +16% on +27% sales revenues for the Dec '17 quarter, below the +25% minimum earnings guideline (C criteria), raising fundamental concerns.
>>> FEATURED STOCK ARTICLE : Slumped Below 50-Day Average With Earnings News Due Friday - 2/6/2018 |
View all notes |
Set NEW NOTE alert |
Company Profile |
SEC
News |
Chart |
Request a new note
C
A
S
I |
FIVE
-
NASDAQ
Five Below Inc
Retail-DiscountandVariety
|
$67.50
|
+0.13
0.19% |
$67.86
|
641,712
59.58% of 50 DAV
50 DAV is 1,077,000
|
$73.55
-8.23%
|
1/2/2018
|
$69.16
|
PP = $68.99
|
|
MB = $72.44
|
Most Recent Note - 2/21/2018 5:32:34 PM
G - It has not formed a sound new base and is sputtering near its 50 DMA line ($66.41). The recent low ($60.00 on 2/06/18) defines important near-term support to watch on pullbacks.
>>> FEATURED STOCK ARTICLE : Rebound Above 50-day Moving Average is Needed to Help Outlook - 2/12/2018 |
View all notes |
Set NEW NOTE alert |
Company Profile |
SEC
News |
Chart |
Request a new note
C
A
S
I |
SPLK
-
NASDAQ
Splunk Inc
Computer Sftwr-Database
|
$95.12
|
+1.91
2.05% |
$95.16
|
601,929
40.59% of 50 DAV
50 DAV is 1,483,000
|
$97.27
-2.21%
|
2/15/2018
|
$96.06
|
PP = $93.68
|
|
MB = $98.36
|
Most Recent Note - 2/22/2018 4:10:20 PM
Y - Hovering near multi-year highs. Its 50 DMA line defines near term support to watch on pullbacks. A valid secondary buy point exists up to +5% above the prior high since finding support at the 10 WMA after the prior breakout.
>>> FEATURED STOCK ARTICLE : Pulled Back to 10-Week Moving Average After Technical Breakout - 2/16/2018 |
View all notes |
Set NEW NOTE alert |
Company Profile |
SEC
News |
Chart |
Request a new note
C
A
S
I |
PAYC
-
NYSE
Paycom Software Inc
COMPUTER SOFTWARE and SERVICES - Application Software
|
$98.42
|
+2.31
2.40% |
$98.43
|
422,008
60.46% of 50 DAV
50 DAV is 698,000
|
$97.56
0.88%
|
2/15/2018
|
$95.01
|
PP = $93.61
|
|
MB = $98.29
|
Most Recent Note - 2/22/2018 4:02:52 PM
Y - Quietly hovering near its all-time high. A valid "secondary buy point" exists up to +5% above the latest high since it found support at its 10-week moving average line following the prior breakout. Fundamentals remain strong.
>>> FEATURED STOCK ARTICLE : Fell Below 50 Day Average With Losses on Above Average Volume - 2/8/2018 |
View all notes |
Set NEW NOTE alert |
Company Profile |
SEC
News |
Chart |
Request a new note
C
A
S
I |
Symbol/Exchange
Company Name
Industry Group |
PRICE |
CHANGE
(%Change) |
Day High |
Volume
(% DAV)
(% 50 day avg vol) |
52 Wk Hi
% From Hi |
Featured
Date |
Price
Featured |
Pivot Featured |
|
Max Buy |
GRUB
-
NYSE
Grubhub Inc
COMPUTER SOFTWARE and SERVICES - Technical and System Software
|
$96.73
|
-1.54
-1.57% |
$98.99
|
1,672,775
92.01% of 50 DAV
50 DAV is 1,818,000
|
$99.81
-3.09%
|
6/21/2017
|
$47.33
|
PP = $46.94
|
|
MB = $49.29
|
Most Recent Note - 2/21/2018 5:33:28 PM
G - Wedged higher recently, getting more extended from any sound base. Recently reported earnings +61% on +49% sales revenues for the Dec '17 quarter.
>>> FEATURED STOCK ARTICLE : Slumped Below 50-Day Average With Earnings News Due - 2/7/2018 |
View all notes |
Set NEW NOTE alert |
Company Profile |
SEC
News |
Chart |
Request a new note
C
A
S
I |
HQY
-
NASDAQ
"HealthEquity, Inc"
COMPUTER SOFTWARE and SERVICES - Healthcare Information Service
|
$52.51
|
+1.77
3.48% |
$52.62
|
1,727,036
294.57% of 50 DAV
50 DAV is 586,300
|
$57.72
-9.03%
|
2/20/2018
|
$56.37
|
PP = $55.41
|
|
MB = $58.18
|
Most Recent Note - 2/23/2018 12:03:58 PM
Y - Managed a "positive reversal" after early lows today undercut both its 50 and 200 DMA lines. Considerable loss on the prior session raised concerns while abruptly slumping from a new all-time high after 9 consecutive gains, falling back into the prior base. Highlighted in the 2/20/18 mid-day report (read here). Fundamentals remain strong, with earnings +70% on +31% sales revenues for the Oct '17 quarter. See the latest FSU analysis for more details and an annotated graph.
>>> FEATURED STOCK ARTICLE : Fundamentals Remained Favorable and Strength Returned - 2/21/2018 |
View all notes |
Set NEW NOTE alert |
Company Profile |
SEC
News |
Chart |
Request a new note
C
A
S
I |
PYPL
-
NASDAQ
Paypal Holdings Inc
Finance-CrdtCard/PmtPr
|
$79.69
|
+1.99
2.56% |
$79.70
|
7,472,416
77.58% of 50 DAV
50 DAV is 9,632,000
|
$86.32
-7.68%
|
2/1/2018
|
$80.35
|
PP = $79.49
|
|
MB = $83.46
|
Most Recent Note - 2/21/2018 5:39:09 PM
G - Sputtering back below its 50 DMA line ($77.73) his week. Subsequent losses below the recent low ($71.63 on 2/09/18) would raise concerns and trigger a more worrisome technical sell signal.
>>> FEATURED STOCK ARTICLE : Gap Down Following Earnings News Tests Important Support Level - 2/1/2018 |
View all notes |
Set NEW NOTE alert |
Company Profile |
SEC
News |
Chart |
Request a new note
C
A
S
I |
OLLI
-
NASDAQ
Ollie's Bargain Outlet
Retail-DiscountandVariety
|
$59.25
|
+1.40
2.42% |
$59.30
|
337,782
59.47% of 50 DAV
50 DAV is 568,000
|
$58.50
1.28%
|
11/21/2017
|
$46.78
|
PP = $47.00
|
|
MB = $49.35
|
Most Recent Note - 2/20/2018 2:43:02 PM
G - Still quietly consolidating above its 50 DMA line ($53.73). Prior low ($50.15 on 1/04/18) defines the next important near-term support.
>>> FEATURED STOCK ARTICLE : Consolidating Above 50-Day Moving Average Line - 2/13/2018 |
View all notes |
Set NEW NOTE alert |
Company Profile |
SEC
News |
Chart |
Request a new note
C
A
S
I |
WB
-
NASDAQ
Weibo Corp Cl A Ads
INTERNET - Content
|
$139.74
|
+5.03
3.73% |
$139.81
|
1,755,631
98.03% of 50 DAV
50 DAV is 1,791,000
|
$142.12
-1.67%
|
1/16/2018
|
$126.33
|
PP = $122.21
|
|
MB = $128.32
|
Most Recent Note - 2/23/2018 5:18:42 PM
G - Posted a big gain on average volume for a best-ever close. It is extended from the prior base. Recently reported earnings +88% on +77% sales revenues for the Dec '17 quarter, continuing its strong earnings track record.
>>> FEATURED STOCK ARTICLE : Consolidating Near 50-Day Average With Earnings News Due - 2/9/2018 |
View all notes |
Set NEW NOTE alert |
Company Profile |
SEC
News |
Chart |
Request a new note
C
A
S
I |
Symbol/Exchange
Company Name
Industry Group |
PRICE |
CHANGE
(%Change) |
Day High |
Volume
(% DAV)
(% 50 day avg vol) |
52 Wk Hi
% From Hi |
Featured
Date |
Price
Featured |
Pivot Featured |
|
Max Buy |
HLI
-
NYSE
Houlihan Lokey Inc Cl A
Finance-Invest Bnk/Bkrs
|
$46.59
|
+0.31
0.67% |
$46.66
|
135,666
58.23% of 50 DAV
50 DAV is 233,000
|
$52.81
-11.78%
|
1/3/2018
|
$45.88
|
PP = $47.09
|
|
MB = $49.44
|
Most Recent Note - 2/21/2018 5:34:23 PM
G - Quietly consolidating just below its 50 DMA line ($47.32). The recent low ($43.73 on 2/06/18) defines near term support where a violation would raise greater concerns. Recently reported earnings +21% on +5% sales revenues for the Dec '17 quarter, below the +25% minimum earnings guideline (C criteria), raising fundamental concerns. On 10/26/17 it completed a Secondary Offering.
>>> FEATURED STOCK ARTICLE : Damaging Violation of 50-Day Moving Average Line - 2/5/2018 |
View all notes |
Set NEW NOTE alert |
Company Profile |
SEC
News |
Chart |
Request a new note
C
A
S
I |
|
|
|
THESE ARE NOT BUY RECOMMENDATIONS!
Comments contained in the body of this report are technical
opinions only. The material herein has been obtained
from sources believed to be reliable and accurate, however,
its accuracy and completeness cannot be guaranteed.
This site is not an investment advisor, hence it does
not endorse or recommend any securities or other investments.
Any recommendation contained in this report may not
be suitable for all investors and it is not to be deemed
an offer or solicitation on our part with respect to
the purchase or sale of any securities. All trademarks,
service marks and trade names appearing in this report
are the property of their respective owners, and are
likewise used for identification purposes only.
This report is a service available
only to active Paid Premium Members.
You may opt-out of receiving report notifications
at any time. Questions or comments may be submitted
by writing to Premium Membership Services 665 S.E. 10 Street, Suite 201 Deerfield Beach, FL 33441-5634 or by calling 1-800-965-8307
or 954-785-1121.
|
|
|