You are not logged in.
This means you
CAN ONLY VIEW reports that were published prior to Thursday, March 20, 2025.
You
MUST UPGRADE YOUR MEMBERSHIP if you want to see any current reports.
AFTER MARKET UPDATE - TUESDAY, MARCH 13TH, 2018
Previous After Market Report Next After Market Report >>>
|
|
|
|
DOW |
-171.58 |
25,007.03 |
-0.68% |
|
Volume |
780,839,380 |
-2% |
|
Volume |
2,453,958,590 |
+6% |
|
NASDAQ |
-77.31 |
7,511.01 |
-1.02% |
|
Advancers |
1,197 |
40% |
|
Advancers |
1,056 |
36% |
|
S&P 500 |
-17.71 |
2,765.31 |
-0.64% |
|
Decliners |
1,771 |
60% |
|
Decliners |
1,851 |
64% |
|
Russell 2000 |
-9.00 |
1,592.05 |
-0.56% |
|
52 Wk Highs |
87 |
|
|
52 Wk Highs |
219 |
|
|
S&P 600 |
-3.66 |
970.47 |
-0.38% |
|
52 Wk Lows |
37 |
|
|
52 Wk Lows |
24 |
|
|
 |
Major Indices Reversed Early Gains to Close Lower
Kenneth J. Gruneisen - Passed the CAN SLIM® Master's Exam
Stocks finished lower Tuesday. The Dow fell 171 points to 25007. The S&P 500 lost 17 points to 2765 while the Nasdaq Composite was down 77 points to 7511. The volume totals reported were mixed, lighter than the prior session total on the NYSE and slightly higher on the Nasdaq exchange. Decliners led advancers by a 3-2 margin on the NYSE and by 9-5 on the Nasdaq exchange. New 52-week high totals outnumbered new 52-week lows totals on both the Nasdaq exchange and the NYSE. There were 122 high-ranked companies from the Leaders List that made new 52-week highs and were listed on the BreakOuts Page, versus the total of 81 on the prior session. Charts used courtesy of www.stockcharts.com
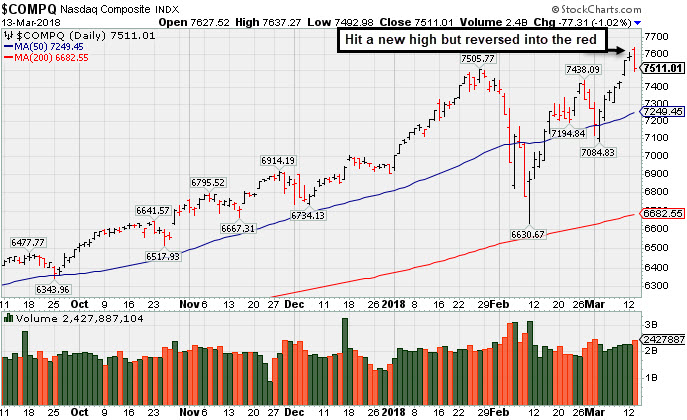 PICTURED: The Nasdaq Composite Index hit a new record high but reversed into the red breaking its streak of 7 consecutive gains. The major indices (M criteria) are in a confirmed uptrend. New buying efforts are justified under the fact-based investment system when all key criteria of the fact-based investment system are satisfied. The Featured Stocks Page provides the most timely analysis on high-ranked leaders that are noteworthy and action worthy.
U.S. equities declined after President Trump unexpectedly announced he fired Secretary of State Rex Tillerson and replaced him with current CIA Director Mike Pompeo. On the data front, the Labor Department reported that consumer prices rose 0.2% in February, matching forecasts. Excluding the volatile food and energy components, core CPI rose 1.8% year-over-year, holding steady for a third consecutive month. A separate release showed February’s small business optimism climbed to the highest level since 1983.
Eight of 11 sectors in the S&P 500 finished lower. Technology shares lagged with Microsoft (MSFT -2.44%) and Google parent Alphabet (GOOGL -2.23%) falling. In earnings, Dick’s Sporting Goods (DKS +0.98%) rose despite posting revenues and comparable store sales below consensus estimates. Shoe store DSW (DSW +10.71%) rose after reporting earnings above estimates and raising forward guidance. U.S. Steel (X -7.64%) fell despite increasing its full-year profit outlook attributed to President Trump’s tariffs on steel and aluminum imports.
Treasuries strengthened with the yield on the 10-year note dropping two basis points to 2.84%. In commodities, NYMEX WTI crude lost 1.2% to $60.60/barrel. COMEX gold gained 0.4% to $1326.50/ounce amid a weaker dollar. |
 Kenneth J. Gruneisen started out as a licensed stockbroker in August 1987, a couple of months prior to the historic stock market crash that took the Dow Jones Industrial Average down -22.6% in a single day. He has published daily fact-based fundamental and technical analysis on high-ranked stocks online for two decades. Through FACTBASEDINVESTING.COM, Kenneth provides educational articles, news, market commentary, and other information regarding proven investment systems that work in good times and bad.
Comments contained in the body of this report are technical opinions only and are not necessarily those of Gruneisen Growth Corp. The material herein has been obtained from sources believed to be reliable and accurate, however, its accuracy and completeness cannot be guaranteed. Our firm, employees, and customers may effect transactions, including transactions contrary to any recommendation herein, or have positions in the securities mentioned herein or options with respect thereto. Any recommendation contained in this report may not be suitable for all investors and it is not to be deemed an offer or solicitation on our part with respect to the purchase or sale of any securities. |
|
 |
Retail, Tech, Financial, and Energy Groups Fell
Kenneth J. Gruneisen - Passed the CAN SLIM® Master's Exam
On Tuesday the Retail Index ($RLX -0.68%), Broker/Dealer Index ($XBD -1.10%), and Bank Index ($BKX -1.16%) suffered unanimous losses. The tech sector had a negative bias as the Networking Index ($NWX -0.38%), Semiconductor Index ($SOX -1.55%), and the Biotechnology Index ($BTK -0.69%) each fell. Energy-linked shares were lower as the Integrated Oil Index ($XOI -0.42%) and the Oil Services Index ($OSX -1.27%) fell, meanwhile the Gold & Silver Index ($XAU +0.04%) finished flat. Charts courtesy wwwstockcharts.com
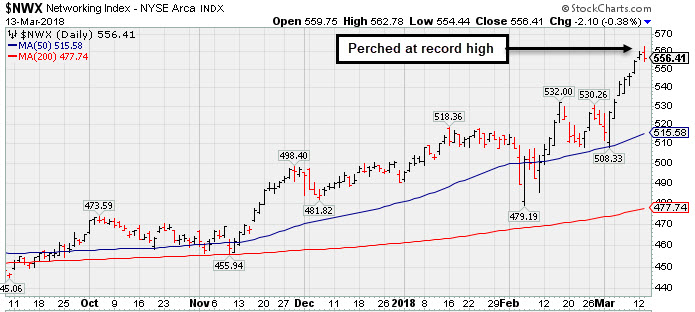 PICTURED: The Networking Index ($NWX -0.38%) is perched at a record high.
| Oil Services |
$OSX |
138.18 |
-1.77 |
-1.26% |
-7.60% |
| Integrated Oil |
$XOI |
1,296.00 |
-5.41 |
-0.42% |
-2.96% |
| Semiconductor |
$SOX |
1,423.46 |
-22.44 |
-1.55% |
+13.60% |
| Networking |
$NWX |
556.41 |
-2.10 |
-0.38% |
+13.43% |
| Broker/Dealer |
$XBD |
298.33 |
-3.33 |
-1.10% |
+12.47% |
| Retail |
$RLX |
2,025.60 |
-13.90 |
-0.68% |
+16.83% |
| Gold & Silver |
$XAU |
79.70 |
+0.03 |
+0.04% |
-6.53% |
| Bank |
$BKX |
114.18 |
-1.34 |
-1.16% |
+7.00% |
| Biotech |
$BTK |
4,865.41 |
-33.75 |
-0.69% |
+15.23% |
|
|
|
 |
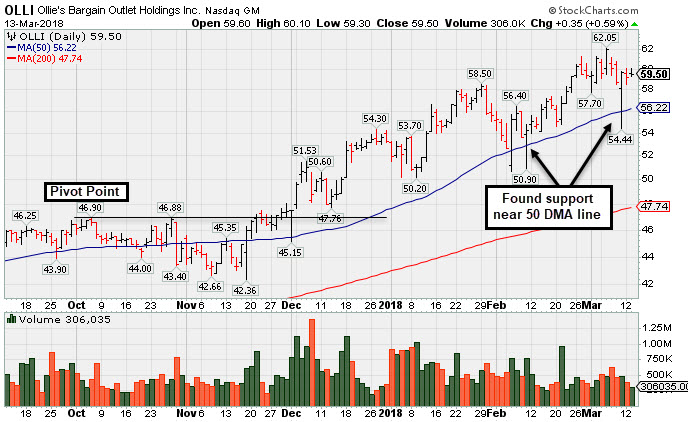
Bargain Outlet's Shares Perched Near All-Time Price High
Kenneth J. Gruneisen - Passed the CAN SLIM® Master's Exam
Ollie's Bargain Outlet (OLLI +$0.35 or +0.59% to $59.50) remains perched near its all-time high after getting extended from any sound base. Support is defined by its 50-day moving average (DMA) line ($56.22) and prior low ($50.15 on 1/04/18). Damaging violations may trigger more worrisome technical sell signals.
Fundamentals remain very strong. Recently it reported earnings +29% on +18% sales revenues for the Oct '17 quarter, continuing its strong earnings track record and meeting the +25% minimum earnings guideline (C criteria). It has earned a very strong 97 Earnings Per Share (EPS) rating.
The Retail - Discount & Variety firm traded up as much as +135% since highlighted in yellow with a pivot point based on its 4/28/16 high plus 10 cents in 7/19/16 mid-day report (read here). OLLI was last shown in this FSU section on 1/18/18 with an annotated graph under the headline, "Bs".
OLLI completed its $16 IPO on 7/16/15. It completed a Secondary Offerings on 6/06/16 and 2/18/16. The number of top-rated funds owning its shares rose from 98 in Sep '15 to 430 in Dec '17, a reassuring sign concerning the I criteria. Its current Up/Down Volume ratio of 1.2 is an unbiased indication its shares have been under slight accumulation over the past 50 days. The small supply of only 61.7 million shares outstanding (S criteria) can contribute to greater price volatility in the event of institutional buying or selling.
|
|
|
Color Codes Explained :
Y - Better candidates highlighted by our
staff of experts.
G - Previously featured
in past reports as yellow but may no longer be buyable under the
guidelines.
***Last / Change / Volume data in this table is the closing quote data***
Symbol/Exchange
Company Name
Industry Group |
PRICE |
CHANGE
(%Change) |
Day High |
Volume
(% DAV)
(% 50 day avg vol) |
52 Wk Hi
% From Hi |
Featured
Date |
Price
Featured |
Pivot Featured |
|
Max Buy |
SIVB
-
NASDAQ
S V B Financial Group
BANKING - Regional - Pacific Banks
|
$262.19
|
-5.29
-1.98% |
$268.20
|
723,049
172.15% of 50 DAV
50 DAV is 420,000
|
$271.79
-3.53%
|
3/12/2018
|
$267.79
|
PP = $263.19
|
|
MB = $276.35
|
Most Recent Note - 3/12/2018 5:48:27 PM
Y - Endured distributional pressure today as it suffered a loss with above average volume after highlighted in yellow with pivot point cited based on its 1/24/18 high plus 10 cents in the mid-day report. Wedged to new 52-week highs with recent gains lacking great volume conviction after a short flat base. Gains above a stock's pivot point must have at least +40% above average volume to trigger a proper technical buy signal. Reported earnings +53% on +32% sales revenues for the Dec '17 quarter, marking its 4th consecutive comparison above the +25% minimum guideline (C criteria), helping it better match the fact-based investment system's guidelines. See the latest FSU analysis for more details and a new annotated graph.
>>> FEATURED STOCK ARTICLE : Endured Distributional Pressure After Wedging Higher - 3/12/2018 |
View all notes |
Set NEW NOTE alert |
Company Profile |
SEC
News |
Chart |
Request a new note
C
A
S
I |
TPL
-
NYSE
Texas Pacific Land Trust
FINANCIAL SERVICES - Diversified Investments
|
$515.03
|
-12.46
-2.36% |
$525.63
|
10,531
58.51% of 50 DAV
50 DAV is 18,000
|
$569.99
-9.64%
|
2/20/2018
|
$517.00
|
PP = $569.99
|
|
MB = $598.49
|
Most Recent Note - 3/12/2018 6:09:26 PM
Y - Volume totals have been cooling while consolidating in an orderly fashion above its 50 DMA line ($512.84). Reported earnings +29% on +118% sales revenues for the Dec '17 quarter.
>>> FEATURED STOCK ARTICLE : Finding Support Above 50-Day Moving Average Line - 2/22/2018 |
View all notes |
Set NEW NOTE alert |
Company Profile |
SEC
News |
Chart |
Request a new note
C
A
S
I |
YY
-
NASDAQ
YY Inc
INTERNET - Internet Service Providers
|
$118.18
|
-1.11
-0.93% |
$121.00
|
1,564,580
99.91% of 50 DAV
50 DAV is 1,566,000
|
$142.97
-17.34%
|
12/29/2017
|
$113.06
|
PP = $123.58
|
|
MB = $129.76
|
Most Recent Note - 3/8/2018 1:00:58 PM
G - Gapped up today but quickly erased early gains and slumped back below its 50 DMA line ($127.85) again. Wider than usual intra-day price swings are a sign of uncertainty. Faces resistance due to overhead supply up to the $142 level. Reported earnings +55% on +56% sales revenues for the Dec '17 quarter, continuing its strong earnings track record.
>>> FEATURED STOCK ARTICLE : Earnings News Due Next Week for Chinese Social Platform - 2/27/2018 |
View all notes |
Set NEW NOTE alert |
Company Profile |
SEC
News |
Chart |
Request a new note
C
A
S
I |
LOGM
-
NASDAQ
Logmein Inc
INTERNET - Internet Software andamp; Services
|
$127.50
|
-0.25
-0.20% |
$129.00
|
404,294
70.45% of 50 DAV
50 DAV is 573,900
|
$134.80
-5.42%
|
2/15/2018
|
$132.35
|
PP = $129.61
|
|
MB = $136.09
|
Most Recent Note - 3/12/2018 6:03:06 PM
Y - Today's quiet gain led to its 3rd best close ever and its color code is changed to yellow. Rebound above the 50 DMA line ($121.38) helped its outlook improve after it found support at its 200 DMA line. However, its Relative Strength rating is 77, still below the 80+ minimum guideline for buy candidates.
>>> FEATURED STOCK ARTICLE : Technical Breakout Came Ahead of Earnings News - 2/15/2018 |
View all notes |
Set NEW NOTE alert |
Company Profile |
SEC
News |
Chart |
Request a new note
C
A
S
I |
HTHT
-
NASDAQ
China Lodging Group Ads
LEISURE - Lodging
|
$147.35
|
-7.15
-4.63% |
$154.55
|
566,940
107.78% of 50 DAV
50 DAV is 526,000
|
$166.19
-11.34%
|
12/22/2017
|
$138.07
|
PP = $142.90
|
|
MB = $150.05
|
 Most Recent Note - 3/13/2018 6:50:28 PM
G - Slumped to a close below its 50 DMA line ($150.20) today. Subsequent losses below the recent low ($141.01 on 3/02/18) would raise greater concerns and trigger a technical sell signal.
>>> FEATURED STOCK ARTICLE : Repaired Recent Technical Damage But Has Not Formed a New Base - 2/23/2018 |
View all notes |
Set NEW NOTE alert |
Company Profile |
SEC
News |
Chart |
Request a new note
C
A
S
I |
Symbol/Exchange
Company Name
Industry Group |
PRICE |
CHANGE
(%Change) |
Day High |
Volume
(% DAV)
(% 50 day avg vol) |
52 Wk Hi
% From Hi |
Featured
Date |
Price
Featured |
Pivot Featured |
|
Max Buy |
PETS
-
NASDAQ
Petmed Express Inc
RETAIL - Drug Stores
|
$46.75
|
-0.38
-0.81% |
$48.07
|
319,099
46.31% of 50 DAV
50 DAV is 689,000
|
$57.80
-19.12%
|
1/19/2018
|
$53.59
|
PP = $51.00
|
|
MB = $53.55
|
Most Recent Note - 3/7/2018 5:34:51 PM
G - Tallied 3 consecutive small gains with light volume, but still sputtering below its 50 DMA line ($46.71). Faces near-term resistance due to overhead supply up to the $57 level. Recently reported earnings +83% on +14% sales revenues, continuing its strong earnings track record.
>>> FEATURED STOCK ARTICLE : Sputtering Below 50-Day Average After Negative Reversal - 2/14/2018 |
View all notes |
Set NEW NOTE alert |
Company Profile |
SEC
News |
Chart |
Request a new note
C
A
S
I |
DPZ
-
NYSE
Dominos Pizza Inc
WHOLESALE - Food Wholesale
|
$226.40
|
-1.29
-0.57% |
$229.93
|
675,327
60.46% of 50 DAV
50 DAV is 1,117,000
|
$236.00
-4.07%
|
2/20/2018
|
$224.86
|
PP = $222.01
|
|
MB = $233.11
|
Most Recent Note - 3/12/2018 5:51:33 PM
Y - After poised for a best-ever close it reversed and closed lower today with higher (below average) volume. Tallied big gains then stalled after highlighted in the 2/20/18 mid-day report with pivot point cited based on its 1/25/18 high plus 10 cents.
>>> FEATURED STOCK ARTICLE : Popular Pizza Firm Met Resistance Near Prior High - 2/20/2018 |
View all notes |
Set NEW NOTE alert |
Company Profile |
SEC
News |
Chart |
Request a new note
C
A
S
I |
FIVE
-
NASDAQ
Five Below Inc
Retail-DiscountandVariety
|
$68.25
|
+0.89
1.32% |
$69.34
|
911,331
88.14% of 50 DAV
50 DAV is 1,034,000
|
$73.55
-7.21%
|
3/9/2018
|
$68.58
|
PP = $73.65
|
|
MB = $77.33
|
Most Recent Note - 3/9/2018 5:46:05 PM
Y - New pivot point is cited based on its 1/05/18 high plus 10 cents. Subsequent volume-driven gains above the pivot point may trigger a new (or add-on) technical buy signal. Consolidating above its 50 DMA line ($66.81). The recent low ($60.00 on 2/06/18) defines important near-term support to watch on pullbacks. See the latest FSU analysis for more details and a new annotated graph.
>>> FEATURED STOCK ARTICLE : Retailer Rebounding Within Striking Distance of Prior High - 3/9/2018 |
View all notes |
Set NEW NOTE alert |
Company Profile |
SEC
News |
Chart |
Request a new note
C
A
S
I |
SPLK
-
NASDAQ
Splunk Inc
Computer Sftwr-Database
|
$106.43
|
-1.47
-1.36% |
$109.76
|
3,203,831
181.31% of 50 DAV
50 DAV is 1,767,000
|
$108.89
-2.26%
|
2/15/2018
|
$96.06
|
PP = $93.68
|
|
MB = $98.36
|
Most Recent Note - 3/7/2018 12:37:23 PM
G - Hitting yet another new all-time high today, getting more extended from any sound base. Disciplined investors avoid chasing extended stocks. Bullish action came after it reported earnings +76% on +37% sales revenues for the quarter ended January 31, 2018 versus the year ago period.
>>> FEATURED STOCK ARTICLE : Pulled Back to 10-Week Moving Average After Technical Breakout - 2/16/2018 |
View all notes |
Set NEW NOTE alert |
Company Profile |
SEC
News |
Chart |
Request a new note
C
A
S
I |
PAYC
-
NYSE
Paycom Software Inc
COMPUTER SOFTWARE and SERVICES - Application Software
|
$109.52
|
-0.68
-0.62% |
$111.42
|
497,603
66.79% of 50 DAV
50 DAV is 745,000
|
$111.34
-1.63%
|
2/15/2018
|
$95.01
|
PP = $93.61
|
|
MB = $98.29
|
Most Recent Note - 3/7/2018 5:20:25 PM
G - Stubbornly holding its ground and it hit yet another new all-time high with today's 4th consecutive gain, getting very extended from any sound base. Prior highs in the $93 area define initial support above its 50 DMA line ($90.13). Fundamentals remain strong. See the latest FSU analysis for more details and a new annotated graph.
>>> FEATURED STOCK ARTICLE : Extended From Prior Base After Streak of Gains - 3/7/2018 |
View all notes |
Set NEW NOTE alert |
Company Profile |
SEC
News |
Chart |
Request a new note
C
A
S
I |
Symbol/Exchange
Company Name
Industry Group |
PRICE |
CHANGE
(%Change) |
Day High |
Volume
(% DAV)
(% 50 day avg vol) |
52 Wk Hi
% From Hi |
Featured
Date |
Price
Featured |
Pivot Featured |
|
Max Buy |
GRUB
-
NYSE
Grubhub Inc
COMPUTER SOFTWARE and SERVICES - Technical and System Software
|
$109.25
|
-0.34
-0.31% |
$112.41
|
1,483,598
80.32% of 50 DAV
50 DAV is 1,847,000
|
$110.36
-1.01%
|
6/21/2017
|
$47.33
|
PP = $46.94
|
|
MB = $49.29
|
Most Recent Note - 3/12/2018 6:10:30 PM
G - Hit another new all-time high today, getting very extended from any sound base. Well above its 50 DMA line and prior highs defining near-term support. Recently reported earnings +61% on +49% sales revenues for the Dec '17 quarter.
>>> FEATURED STOCK ARTICLE : Bullish Action Followed Last Earnings Report - 3/1/2018 |
View all notes |
Set NEW NOTE alert |
Company Profile |
SEC
News |
Chart |
Request a new note
C
A
S
I |
HQY
-
NASDAQ
Healthequity Inc
COMPUTER SOFTWARE and SERVICES - Healthcare Information Service
|
$58.87
|
-0.31
-0.52% |
$59.87
|
325,006
53.90% of 50 DAV
50 DAV is 603,000
|
$59.99
-1.87%
|
2/20/2018
|
$56.37
|
PP = $55.41
|
|
MB = $58.18
|
Most Recent Note - 3/12/2018 5:58:20 PM
G - Color code is changed to green. Pulled back today after wedging into new high territory last week with gains lacking great volume conviction. Fundamentals remain strong.
>>> FEATURED STOCK ARTICLE : Fundamentals Remained Favorable and Strength Returned - 2/21/2018 |
View all notes |
Set NEW NOTE alert |
Company Profile |
SEC
News |
Chart |
Request a new note
C
A
S
I |
PYPL
-
NASDAQ
Paypal Holdings Inc
Finance-CrdtCard/PmtPr
|
$80.20
|
-0.40
-0.50% |
$80.99
|
6,341,072
64.17% of 50 DAV
50 DAV is 9,882,000
|
$86.32
-7.09%
|
2/1/2018
|
$80.35
|
PP = $79.49
|
|
MB = $83.46
|
Most Recent Note - 3/7/2018 5:36:09 PM
G - Quietly consolidating above its 50 DMA line ($78.72). Subsequent losses below the recent low ($71.63 on 2/09/18) would raise concerns and trigger a more worrisome technical sell signal. Fundamentals remain strong.
>>> FEATURED STOCK ARTICLE : Quietly Consolidating Back Above 50-Day Moving Average - 2/26/2018 |
View all notes |
Set NEW NOTE alert |
Company Profile |
SEC
News |
Chart |
Request a new note
C
A
S
I |
OLLI
-
NASDAQ
Ollie's Bargain Outlet
Retail-DiscountandVariety
|
$59.50
|
+0.35
0.59% |
$60.10
|
306,035
56.36% of 50 DAV
50 DAV is 543,000
|
$62.05
-4.11%
|
11/21/2017
|
$46.78
|
PP = $47.00
|
|
MB = $49.35
|
Most Recent Note - 3/13/2018 6:48:50 PM
G - Perched near its all-time high, extended from any sound base. Support is defined by its 50 DMA line ($56.22) and prior low ($50.15 on 1/04/18). See the latest FSU analysis for more details and a new annotated graph.
>>> FEATURED STOCK ARTICLE : Bargain Outlet's Shares Perched Near All-Time Price High - 3/13/2018 |
View all notes |
Set NEW NOTE alert |
Company Profile |
SEC
News |
Chart |
Request a new note
C
A
S
I |
WB
-
NASDAQ
Weibo Corp Cl A Ads
INTERNET - Content
|
$131.13
|
+0.45
0.34% |
$133.80
|
1,695,652
87.22% of 50 DAV
50 DAV is 1,944,000
|
$142.12
-7.73%
|
1/16/2018
|
$126.33
|
PP = $122.21
|
|
MB = $128.32
|
Most Recent Note - 3/12/2018 6:05:28 PM
G - Down today with above average volume, slumping toward its 50 DMA line ($126.64) which recently acted as support. It is extended from any sound base. Recently reported earnings +88% on +77% sales revenues for the Dec '17 quarter, continuing its strong earnings track record.
>>> FEATURED STOCK ARTICLE : Recent Consolidation is Not a New Base of Sufficient Length - 3/8/2018 |
View all notes |
Set NEW NOTE alert |
Company Profile |
SEC
News |
Chart |
Request a new note
C
A
S
I |
Symbol/Exchange
Company Name
Industry Group |
PRICE |
CHANGE
(%Change) |
Day High |
Volume
(% DAV)
(% 50 day avg vol) |
52 Wk Hi
% From Hi |
Featured
Date |
Price
Featured |
Pivot Featured |
|
Max Buy |
HLI
-
NYSE
Houlihan Lokey Inc Cl A
Finance-Invest Bnk/Bkrs
|
$47.44
|
-0.94
-1.94% |
$47.69
|
3,164,317
1,400.14% of 50 DAV
50 DAV is 226,000
|
$52.81
-10.17%
|
1/3/2018
|
$45.88
|
PP = $47.09
|
|
MB = $49.44
|
Most Recent Note - 3/13/2018 12:33:32 PM
G - Priced a new Public Offering and gapped down today for a volume-driven loss undercutting its 50 DMA line ($47.61) and raising concerns. The recent low ($43.73 on 2/06/18) defines near term support where a violation would raise greater concerns. Earnings +21% for the Dec '17 quarter were below the +25% minimum earnings guideline (C criteria).
>>> FEATURED STOCK ARTICLE : Recently Met Resistance at 50-Day Moving Average - 2/28/2018 |
View all notes |
Set NEW NOTE alert |
Company Profile |
SEC
News |
Chart |
Request a new note
C
A
S
I |
SQ
-
NYSE
Square Inc Cl A
Finance-CrdtCard/PmtPr
|
$51.83
|
-1.36
-2.56% |
$53.65
|
13,465,759
86.45% of 50 DAV
50 DAV is 15,576,000
|
$53.79
-3.64%
|
3/5/2018
|
$49.70
|
PP = $49.66
|
|
MB = $52.14
|
Most Recent Note - 3/13/2018 6:52:30 PM
Y - Color code is changed to yellow after quietly pulling back below its "max buy" level. Prior highs in the $49-47 area define initial support to watch on pullbacks. Recent quarterly comparisons through Dec '17 showed strong sales revenues growth acceleration and solid earnings increases versus the year-ago periods. Limited annual earnings (A criteria) history remains a concern, yet it had a profitable FY '16 following its $9 IPO in Nov '15.
>>> FEATURED STOCK ARTICLE : New High & Considerable Gain Backed By Twice Average Volume - 3/5/2018 |
View all notes |
Set NEW NOTE alert |
Company Profile |
SEC
News |
Chart |
Request a new note
C
A
S
I |
SEND
-
NYSE
Sendgrid Inc
INTERNET - Content
|
$30.48
|
+0.27
0.89% |
$31.19
|
268,396
114.70% of 50 DAV
50 DAV is 234,000
|
$32.03
-4.83%
|
3/6/2018
|
$28.00
|
PP = $28.37
|
|
MB = $29.79
|
Most Recent Note - 3/12/2018 6:07:31 PM
G - Reversed into the red for a loss today on higher volume, breaking a streak of 5 consecutive gains. Prior highs in the $27-28 area define initial support to watch on pullbacks.
>>> FEATURED STOCK ARTICLE : Recently Profitable Internet - Content Firm Rallied to New High - 3/6/2018 |
View all notes |
Set NEW NOTE alert |
Company Profile |
SEC
News |
Chart |
Request a new note
C
A
S
I |
|
|
|
THESE ARE NOT BUY RECOMMENDATIONS!
Comments contained in the body of this report are technical
opinions only. The material herein has been obtained
from sources believed to be reliable and accurate, however,
its accuracy and completeness cannot be guaranteed.
This site is not an investment advisor, hence it does
not endorse or recommend any securities or other investments.
Any recommendation contained in this report may not
be suitable for all investors and it is not to be deemed
an offer or solicitation on our part with respect to
the purchase or sale of any securities. All trademarks,
service marks and trade names appearing in this report
are the property of their respective owners, and are
likewise used for identification purposes only.
This report is a service available
only to active Paid Premium Members.
You may opt-out of receiving report notifications
at any time. Questions or comments may be submitted
by writing to Premium Membership Services 665 S.E. 10 Street, Suite 201 Deerfield Beach, FL 33441-5634 or by calling 1-800-965-8307
or 954-785-1121.
|
|
|