You are not logged in.
This means you
CAN ONLY VIEW reports that were published prior to Thursday, March 20, 2025.
You
MUST UPGRADE YOUR MEMBERSHIP if you want to see any current reports.
AFTER MARKET UPDATE - THURSDAY, MARCH 15TH, 2018
Previous After Market Report Next After Market Report >>>
|
|
|
|
DOW |
+115.54 |
24,873.66 |
+0.47% |
|
Volume |
813,796,940 |
-2% |
|
Volume |
1,989,432,950 |
-5% |
|
NASDAQ |
-15.07 |
7,481.74 |
-0.20% |
|
Advancers |
1,086 |
37% |
|
Advancers |
1,263 |
43% |
|
S&P 500 |
-2.15 |
2,747.33 |
-0.08% |
|
Decliners |
1,814 |
63% |
|
Decliners |
1,657 |
57% |
|
Russell 2000 |
-7.69 |
1,576.62 |
-0.49% |
|
52 Wk Highs |
32 |
|
|
52 Wk Highs |
83 |
|
|
S&P 600 |
-3.97 |
961.21 |
-0.41% |
|
52 Wk Lows |
135 |
|
|
52 Wk Lows |
46 |
|
|
 |
Major Indices Ended Mixed While There Was Less Leadership
Kenneth J. Gruneisen - Passed the CAN SLIM® Master's Exam
Stocks finished mixed Thursday. The Dow rose 115 points to 24873 while the S&P fell 2 points to 2747. The Nasdaq Composite lost 15 points to 7481. The volume totals reported were lighter than the prior session totals on the NYSE and on the Nasdaq exchange. Decliners led advancers by more than a 3-2 margin on the NYSE and by 4-3 on the Nasdaq exchange. New 52-week highs outnumbered new 52-week lows on the Nasdaq exchange, but new lows outnumbered new highs on the NYSE. There were 22 high-ranked companies from the Leaders List that made new 52-week highs and were listed on the BreakOuts Page, versus the total of 28 on the prior session. Charts used courtesy of www.stockcharts.com
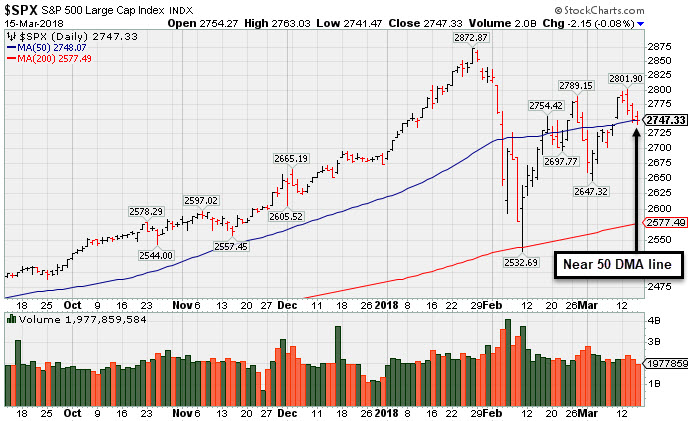 PICTURED: The S&P 500 Index is sputtering near its 50-day moving average (DMA) line. It finished Thursday's session -4.4% off its record high hit on January 26th. The 200 DMA line (2,577) and its February 9th low (2,532) low define important near-term support to watch. The major indices (M criteria) are in a confirmed uptrend. New buying efforts are justified under the fact-based investment system when all key criteria of the fact-based investment system are satisfied. The Featured Stocks Page provides the most timely analysis on high-ranked leaders that are noteworthy and action worthy.
U.S. equities fluctuated amid continuing concerns surrounding global trade and political turmoil. Yesterday, several reports surfaced that President Trump may impose $60 billion in tariffs on Chinese imports. In political news, special counsel Robert Mueller issued a subpoena for documents related to the Trump Organization. On the data front, reports showed import prices rose 0.4% in February and weekly initial jobless claims declined to 226,000. Updates on manufacturing revealed activity accelerated in the Fed’s New York region but slipped modestly in the Philadelphia district.
Eight of 11 sectors in the S&P 500 finished in negative territory. Energy shares reversed earlier gains following a decision from the Federal Energy Regulatory Commission to eliminate a tax benefit for certain MLPs. Industrials outperformed amid strong manufacturing data with Caterpillar (CAT +1.33%). In earnings, Dollar General (DG +4.75%) surged after posting better-than-expected quarterly same-store sales and raising its dividend.
Treasuries weakened with the yield on the 10-year note advancing one basis point to 2.82%. In commodities, NYMEX WTI crude rose 0.4% to $61.22/barrel. COMEX gold fell 0.7% to $1316.40/ounce following remarks from Larry Kudlow, who is reportedly replacing Gary Cohn as President Trump’s top economic advisor. He stated he would sell the metal and supports a stronger dollar. |
 Kenneth J. Gruneisen started out as a licensed stockbroker in August 1987, a couple of months prior to the historic stock market crash that took the Dow Jones Industrial Average down -22.6% in a single day. He has published daily fact-based fundamental and technical analysis on high-ranked stocks online for two decades. Through FACTBASEDINVESTING.COM, Kenneth provides educational articles, news, market commentary, and other information regarding proven investment systems that work in good times and bad.
Comments contained in the body of this report are technical opinions only and are not necessarily those of Gruneisen Growth Corp. The material herein has been obtained from sources believed to be reliable and accurate, however, its accuracy and completeness cannot be guaranteed. Our firm, employees, and customers may effect transactions, including transactions contrary to any recommendation herein, or have positions in the securities mentioned herein or options with respect thereto. Any recommendation contained in this report may not be suitable for all investors and it is not to be deemed an offer or solicitation on our part with respect to the purchase or sale of any securities. |
|
 |
Biotech and Commodity-Linked Groups Led Decliners
Kenneth J. Gruneisen - Passed the CAN SLIM® Master's Exam
On Thursday the Retail Index($RLX -0.22%) and the Broker/Dealer Index ($XBD -0.58%) lost ground while the Bank Index ($BKX +0.03%) finished flat. The Networking Index ($NWX +0.14%) and the Semiconductor Index ($SOX -0.10%) were little changed, but the Biotechnology Index ($BTK -1.10%) led the tech sector lower. The Oil Services Index ($OSX -2.55%) and the Gold & Silver Index ($XAU -1.23%) both suffered solid losses on the session and the Integrated Oil Index ($XOI -0.32%) edged lower. Charts courtesy wwwstockcharts.com
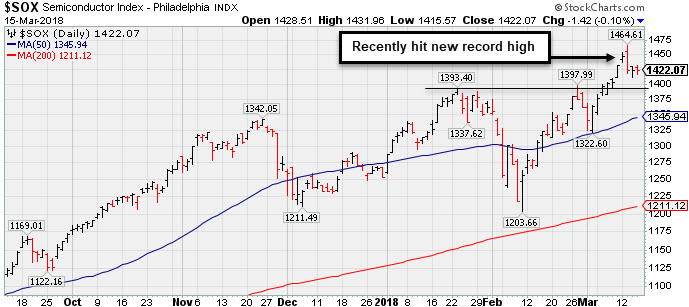 PICTURED: The Semiconductor Index ($SOX -0.10%) is consolidating near its record high.
| Oil Services |
$OSX |
134.83 |
-3.53 |
-2.55% |
-9.84% |
| Integrated Oil |
$XOI |
1,287.74 |
-4.18 |
-0.32% |
-3.58% |
| Semiconductor |
$SOX |
1,422.07 |
-1.43 |
-0.10% |
+13.49% |
| Networking |
$NWX |
554.33 |
+0.77 |
+0.14% |
+13.01% |
| Broker/Dealer |
$XBD |
294.32 |
-1.73 |
-0.58% |
+10.96% |
| Retail |
$RLX |
2,021.73 |
-4.41 |
-0.22% |
+16.61% |
| Gold & Silver |
$XAU |
78.81 |
-0.98 |
-1.23% |
-7.58% |
| Bank |
$BKX |
112.53 |
+0.04 |
+0.04% |
+5.45% |
| Biotech |
$BTK |
4,803.23 |
-53.61 |
-1.10% |
+13.76% |
|
|
|
 |
Recently Endured Distributional Pressure
Kenneth J. Gruneisen - Passed the CAN SLIM® Master's Exam
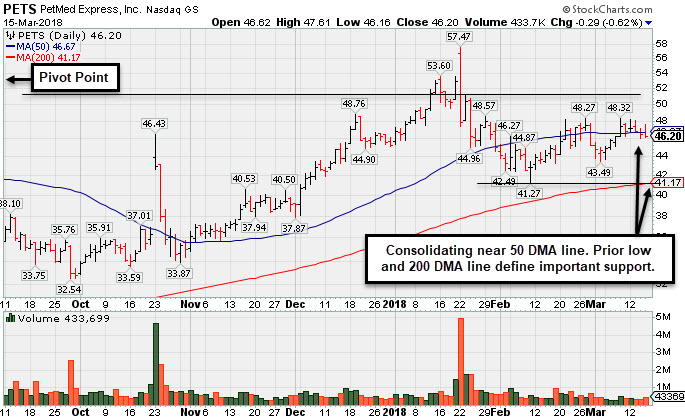
Petmed Express Inc (PETS -$0.29 or -0.62% to $46.20) is quietly consolidating near its 50-day moving average (DMA) line ($46.78). The recent low and 200 DMA line define the next important support in the $41 area. It faces near-term resistance due to overhead supply up to the $57 level. There was a big "negative reversal" on 1/22/18 following earnings news. Its current Up/Down Volume Ratio of 0.8 is an unbiased indication its shares have been under distributional pressure over the past 50 days.
Recently it reported earnings +83% on +14% sales revenues, continuing its strong earnings track record with a 4th consecutive quarterly comparison above the +25% minimum guideline (C criteria). Its fundamentals match the fact based investment system's winning models. It was last shown in this FSU section on 2/14/18 with an annotated graph under the headline, "Sputtering Below 50-Day Average After Negative Reversal". The number of top-rated funds owning its shares rose from 247 in Mar '17 to 313 in Dec '17, a reassuring sign concerning the I criteria. There are only 20.6 million shares outstanding (S criteria), which can contribute to greater price volatility in the event of institutional buying or selling.
Charts used courtesy of www.stockcharts.com
|
|
|
Color Codes Explained :
Y - Better candidates highlighted by our
staff of experts.
G - Previously featured
in past reports as yellow but may no longer be buyable under the
guidelines.
***Last / Change / Volume data in this table is the closing quote data***
Symbol/Exchange
Company Name
Industry Group |
PRICE |
CHANGE
(%Change) |
Day High |
Volume
(% DAV)
(% 50 day avg vol) |
52 Wk Hi
% From Hi |
Featured
Date |
Price
Featured |
Pivot Featured |
|
Max Buy |
SIVB
-
NASDAQ
S V B Financial Group
BANKING - Regional - Pacific Banks
|
$259.77
|
+0.24
0.09% |
$262.73
|
608,253
139.19% of 50 DAV
50 DAV is 437,000
|
$271.79
-4.42%
|
3/12/2018
|
$267.79
|
PP = $263.19
|
|
MB = $276.35
|
 Most Recent Note - 3/15/2018 1:08:26 PM
Y - Volume-driven gains are still needed to clinch a convincing technical buy signal. Endured distributional pressure with 3 straight losses with above average volume after highlighted in yellow in the 3/12/18 mid-day report with pivot point cited based on its 1/24/18 high plus 10 cents. Wedged to new 52-week highs with recent gains lacking great volume conviction after a short flat base. Gains above a stock's pivot point must have at least +40% above average volume to trigger a proper technical buy signal. Reported earnings +53% on +32% sales revenues for the Dec '17 quarter, marking its 4th consecutive comparison above the +25% minimum guideline (C criteria), helping it better match the fact-based investment system's guidelines. See the latest FSU analysis for more details and an annotated graph.
>>> FEATURED STOCK ARTICLE : Endured Distributional Pressure After Wedging Higher - 3/12/2018 |
View all notes |
Set NEW NOTE alert |
Company Profile |
SEC
News |
Chart |
Request a new note
C
A
S
I |
TPL
-
NYSE
Texas Pacific Land Trust
FINANCIAL SERVICES - Diversified Investments
|
$524.41
|
+7.79
1.51% |
$529.00
|
6,858
38.10% of 50 DAV
50 DAV is 18,000
|
$569.99
-8.00%
|
2/20/2018
|
$517.00
|
PP = $569.99
|
|
MB = $598.49
|
Most Recent Note - 3/12/2018 6:09:26 PM
Y - Volume totals have been cooling while consolidating in an orderly fashion above its 50 DMA line ($512.84). Reported earnings +29% on +118% sales revenues for the Dec '17 quarter.
>>> FEATURED STOCK ARTICLE : Finding Support Above 50-Day Moving Average Line - 2/22/2018 |
View all notes |
Set NEW NOTE alert |
Company Profile |
SEC
News |
Chart |
Request a new note
C
A
S
I |
YY
-
NASDAQ
YY Inc
INTERNET - Internet Service Providers
|
$117.04
|
+1.16
1.00% |
$117.70
|
2,042,587
125.85% of 50 DAV
50 DAV is 1,623,000
|
$142.97
-18.14%
|
12/29/2017
|
$113.06
|
PP = $123.58
|
|
MB = $129.76
|
Most Recent Note - 3/14/2018 10:26:47 AM
G - Sputtering further below its 50 DMA line ($128.24). Prior low ($109.06 on 2/09/18) defines the next important support where a violation may trigger a more worrisome sell signal. Faces resistance due to overhead supply up to the $142 level. Reported earnings +55% on +56% sales revenues for the Dec '17 quarter, continuing its strong earnings track record.
>>> FEATURED STOCK ARTICLE : Earnings News Due Next Week for Chinese Social Platform - 2/27/2018 |
View all notes |
Set NEW NOTE alert |
Company Profile |
SEC
News |
Chart |
Request a new note
C
A
S
I |
LOGM
-
NASDAQ
Logmein Inc
INTERNET - Internet Software andamp; Services
|
$127.95
|
+0.80
0.63% |
$128.35
|
335,672
58.10% of 50 DAV
50 DAV is 577,700
|
$134.80
-5.08%
|
2/15/2018
|
$132.35
|
PP = $129.61
|
|
MB = $136.09
|
Most Recent Note - 3/14/2018 5:15:32 PM
Y - Recent rebound above the 50 DMA line ($121.88) helped its outlook improve after it found support at its 200 DMA line. However, its Relative Strength rating is 76, still below the 80+ minimum guideline for buy candidates. See the latest FSU analysis for more details and a new annotated graph.
>>> FEATURED STOCK ARTICLE : Rebounding After Finding Support at 200-Day Average - 3/14/2018 |
View all notes |
Set NEW NOTE alert |
Company Profile |
SEC
News |
Chart |
Request a new note
C
A
S
I |
HTHT
-
NASDAQ
China Lodging Group Ads
LEISURE - Lodging
|
$134.70
|
+2.58
1.95% |
$139.28
|
1,161,755
201.34% of 50 DAV
50 DAV is 577,000
|
$166.19
-18.95%
|
12/22/2017
|
$138.07
|
PP = $142.90
|
|
MB = $150.05
|
Most Recent Note - 3/15/2018 6:17:20 PM
G - Posted a gain today, finding support near its February low ($128.60). Gapped down on the prior session triggering a technical sell signal. A rebound above the 50 DMA line is needed for its outlook to improve. Reported earnings +86% on +42% sales revenues for the Dec '17 quarter.
>>> FEATURED STOCK ARTICLE : Repaired Recent Technical Damage But Has Not Formed a New Base - 2/23/2018 |
View all notes |
Set NEW NOTE alert |
Company Profile |
SEC
News |
Chart |
Request a new note
C
A
S
I |
Symbol/Exchange
Company Name
Industry Group |
PRICE |
CHANGE
(%Change) |
Day High |
Volume
(% DAV)
(% 50 day avg vol) |
52 Wk Hi
% From Hi |
Featured
Date |
Price
Featured |
Pivot Featured |
|
Max Buy |
PETS
-
NASDAQ
Petmed Express Inc
RETAIL - Drug Stores
|
$46.20
|
-0.29
-0.62% |
$47.61
|
433,468
63.10% of 50 DAV
50 DAV is 687,000
|
$57.80
-20.07%
|
1/19/2018
|
$53.59
|
PP = $51.00
|
|
MB = $53.55
|
Most Recent Note - 3/15/2018 6:11:38 PM
G - Quietly consolidating near its 50 DMA line ($46.78). Faces near-term resistance due to overhead supply up to the $57 level. Recently reported earnings +83% on +14% sales revenues, continuing its strong earnings track record. See the latest FSU analysis for more details and an annotated graph.
>>> FEATURED STOCK ARTICLE : Recently Endured Distributional Pressure - 3/15/2018 |
View all notes |
Set NEW NOTE alert |
Company Profile |
SEC
News |
Chart |
Request a new note
C
A
S
I |
DPZ
-
NYSE
Dominos Pizza Inc
WHOLESALE - Food Wholesale
|
$226.82
|
+0.16
0.07% |
$228.27
|
803,064
72.35% of 50 DAV
50 DAV is 1,110,000
|
$236.00
-3.89%
|
2/20/2018
|
$224.86
|
PP = $222.01
|
|
MB = $233.11
|
Most Recent Note - 3/12/2018 5:51:33 PM
Y - After poised for a best-ever close it reversed and closed lower today with higher (below average) volume. Tallied big gains then stalled after highlighted in the 2/20/18 mid-day report with pivot point cited based on its 1/25/18 high plus 10 cents.
>>> FEATURED STOCK ARTICLE : Popular Pizza Firm Met Resistance Near Prior High - 2/20/2018 |
View all notes |
Set NEW NOTE alert |
Company Profile |
SEC
News |
Chart |
Request a new note
C
A
S
I |
FIVE
-
NASDAQ
Five Below Inc
Retail-DiscountandVariety
|
$68.67
|
+0.31
0.45% |
$69.52
|
615,605
59.25% of 50 DAV
50 DAV is 1,039,000
|
$73.55
-6.63%
|
3/9/2018
|
$68.58
|
PP = $73.65
|
|
MB = $77.33
|
Most Recent Note - 3/15/2018 1:46:34 PM
Y - New pivot point was cited based on its 1/05/18 high plus 10 cents. Subsequent volume-driven gains above the pivot point may trigger a new (or add-on) technical buy signal. Consolidating above its 50 DMA line ($66.84). The recent low ($60.00 on 2/06/18) defines important near-term support to watch on pullbacks.
>>> FEATURED STOCK ARTICLE : Retailer Rebounding Within Striking Distance of Prior High - 3/9/2018 |
View all notes |
Set NEW NOTE alert |
Company Profile |
SEC
News |
Chart |
Request a new note
C
A
S
I |
SPLK
-
NASDAQ
Splunk Inc
Computer Sftwr-Database
|
$108.04
|
-0.63
-0.58% |
$109.42
|
2,468,091
133.84% of 50 DAV
50 DAV is 1,844,000
|
$109.88
-1.67%
|
2/15/2018
|
$96.06
|
PP = $93.68
|
|
MB = $98.36
|
Most Recent Note - 3/14/2018 10:07:50 AM
G - Hovering near its new all-time high, extended from any sound base. Disciplined investors avoid chasing extended stocks. Its 50 DMA line and prior highs define support to watch on pullbacks. Bullish action came after it reported earnings +76% on +37% sales revenues for the quarter ended January 31, 2018 versus the year ago period.
>>> FEATURED STOCK ARTICLE : Pulled Back to 10-Week Moving Average After Technical Breakout - 2/16/2018 |
View all notes |
Set NEW NOTE alert |
Company Profile |
SEC
News |
Chart |
Request a new note
C
A
S
I |
PAYC
-
NYSE
Paycom Software Inc
COMPUTER SOFTWARE and SERVICES - Application Software
|
$109.82
|
-1.43
-1.29% |
$111.41
|
504,643
67.11% of 50 DAV
50 DAV is 752,000
|
$112.21
-2.13%
|
2/15/2018
|
$95.01
|
PP = $93.61
|
|
MB = $98.29
|
Most Recent Note - 3/14/2018 10:09:23 AM
G - Stubbornly holding its ground at its all-time high, very extended from any sound base. Prior highs in the $93 area define initial support above its 50 DMA line ($93.04). Fundamentals remain strong.
>>> FEATURED STOCK ARTICLE : Extended From Prior Base After Streak of Gains - 3/7/2018 |
View all notes |
Set NEW NOTE alert |
Company Profile |
SEC
News |
Chart |
Request a new note
C
A
S
I |
Symbol/Exchange
Company Name
Industry Group |
PRICE |
CHANGE
(%Change) |
Day High |
Volume
(% DAV)
(% 50 day avg vol) |
52 Wk Hi
% From Hi |
Featured
Date |
Price
Featured |
Pivot Featured |
|
Max Buy |
GRUB
-
NYSE
Grubhub Inc
COMPUTER SOFTWARE and SERVICES - Technical and System Software
|
$110.89
|
+0.11
0.10% |
$111.92
|
1,517,587
80.77% of 50 DAV
50 DAV is 1,879,000
|
$112.41
-1.35%
|
6/21/2017
|
$47.33
|
PP = $46.94
|
|
MB = $49.29
|
Most Recent Note - 3/12/2018 6:10:30 PM
G - Hit another new all-time high today, getting very extended from any sound base. Well above its 50 DMA line and prior highs defining near-term support. Recently reported earnings +61% on +49% sales revenues for the Dec '17 quarter.
>>> FEATURED STOCK ARTICLE : Bullish Action Followed Last Earnings Report - 3/1/2018 |
View all notes |
Set NEW NOTE alert |
Company Profile |
SEC
News |
Chart |
Request a new note
C
A
S
I |
HQY
-
NASDAQ
Healthequity Inc
COMPUTER SOFTWARE and SERVICES - Healthcare Information Service
|
$59.23
|
-0.75
-1.25% |
$60.00
|
436,851
72.45% of 50 DAV
50 DAV is 603,000
|
$60.00
-1.28%
|
2/20/2018
|
$56.37
|
PP = $55.41
|
|
MB = $58.18
|
Most Recent Note - 3/12/2018 5:58:20 PM
G - Color code is changed to green. Pulled back today after wedging into new high territory last week with gains lacking great volume conviction. Fundamentals remain strong.
>>> FEATURED STOCK ARTICLE : Fundamentals Remained Favorable and Strength Returned - 2/21/2018 |
View all notes |
Set NEW NOTE alert |
Company Profile |
SEC
News |
Chart |
Request a new note
C
A
S
I |
PYPL
-
NASDAQ
Paypal Holdings Inc
Finance-CrdtCard/PmtPr
|
$82.57
|
-0.74
-0.89% |
$83.99
|
9,110,935
89.94% of 50 DAV
50 DAV is 10,130,000
|
$86.32
-4.34%
|
2/1/2018
|
$80.35
|
PP = $79.49
|
|
MB = $83.46
|
Most Recent Note - 3/15/2018 1:00:47 PM
G - Gapped up on the prior session, rising considerably with above average volume after quietly consolidating above its 50 DMA line ($79.58). Subsequent losses below the 50 DMA line and recent low ($71.63 on 2/09/18) would raise concerns and trigger a more worrisome technical sell signals. Fundamentals remain strong.
>>> FEATURED STOCK ARTICLE : Quietly Consolidating Back Above 50-Day Moving Average - 2/26/2018 |
View all notes |
Set NEW NOTE alert |
Company Profile |
SEC
News |
Chart |
Request a new note
C
A
S
I |
OLLI
-
NASDAQ
Ollie's Bargain Outlet
Retail-DiscountandVariety
|
$59.80
|
+1.00
1.70% |
$59.90
|
650,675
119.61% of 50 DAV
50 DAV is 544,000
|
$62.05
-3.63%
|
11/21/2017
|
$46.78
|
PP = $47.00
|
|
MB = $49.35
|
Most Recent Note - 3/13/2018 6:48:50 PM
G - Perched near its all-time high, extended from any sound base. Support is defined by its 50 DMA line ($56.22) and prior low ($50.15 on 1/04/18). See the latest FSU analysis for more details and a new annotated graph.
>>> FEATURED STOCK ARTICLE : Bargain Outlet's Shares Perched Near All-Time Price High - 3/13/2018 |
View all notes |
Set NEW NOTE alert |
Company Profile |
SEC
News |
Chart |
Request a new note
C
A
S
I |
WB
-
NASDAQ
Weibo Corp Cl A Ads
INTERNET - Content
|
$133.72
|
+2.23
1.70% |
$134.91
|
1,385,382
70.25% of 50 DAV
50 DAV is 1,972,000
|
$142.12
-5.91%
|
1/16/2018
|
$126.33
|
PP = $122.21
|
|
MB = $128.32
|
Most Recent Note - 3/12/2018 6:05:28 PM
G - Down today with above average volume, slumping toward its 50 DMA line ($126.64) which recently acted as support. It is extended from any sound base. Recently reported earnings +88% on +77% sales revenues for the Dec '17 quarter, continuing its strong earnings track record.
>>> FEATURED STOCK ARTICLE : Recent Consolidation is Not a New Base of Sufficient Length - 3/8/2018 |
View all notes |
Set NEW NOTE alert |
Company Profile |
SEC
News |
Chart |
Request a new note
C
A
S
I |
Symbol/Exchange
Company Name
Industry Group |
PRICE |
CHANGE
(%Change) |
Day High |
Volume
(% DAV)
(% 50 day avg vol) |
52 Wk Hi
% From Hi |
Featured
Date |
Price
Featured |
Pivot Featured |
|
Max Buy |
HLI
-
NYSE
Houlihan Lokey Inc Cl A
Finance-Invest Bnk/Bkrs
|
$47.07
|
-0.82
-1.71% |
$48.22
|
267,612
91.65% of 50 DAV
50 DAV is 292,000
|
$52.81
-10.87%
|
1/3/2018
|
$45.88
|
PP = $47.09
|
|
MB = $49.44
|
Most Recent Note - 3/13/2018 12:33:32 PM
G - Priced a new Public Offering and gapped down today for a volume-driven loss undercutting its 50 DMA line ($47.61) and raising concerns. The recent low ($43.73 on 2/06/18) defines near term support where a violation would raise greater concerns. Earnings +21% for the Dec '17 quarter were below the +25% minimum earnings guideline (C criteria).
>>> FEATURED STOCK ARTICLE : Recently Met Resistance at 50-Day Moving Average - 2/28/2018 |
View all notes |
Set NEW NOTE alert |
Company Profile |
SEC
News |
Chart |
Request a new note
C
A
S
I |
SQ
-
NYSE
Square Inc Cl A
Finance-CrdtCard/PmtPr
|
$54.84
|
+0.23
0.42% |
$55.54
|
13,397,653
84.19% of 50 DAV
50 DAV is 15,913,000
|
$54.84
0.00%
|
3/5/2018
|
$49.70
|
PP = $49.66
|
|
MB = $52.14
|
Most Recent Note - 3/14/2018 12:33:38 PM
G - Gapped up today, technically, getting more extended from the prior base while rallying well above its "max buy" level with a big gain backed by higher volume. Prior highs in the $49-47 area define initial support to watch on pullbacks. Fundamentals remain strong.
>>> FEATURED STOCK ARTICLE : New High & Considerable Gain Backed By Twice Average Volume - 3/5/2018 |
View all notes |
Set NEW NOTE alert |
Company Profile |
SEC
News |
Chart |
Request a new note
C
A
S
I |
SEND
-
NYSE
Sendgrid Inc
INTERNET - Content
|
$30.56
|
-0.55
-1.77% |
$31.23
|
476,404
205.35% of 50 DAV
50 DAV is 232,000
|
$32.03
-4.58%
|
3/6/2018
|
$28.00
|
PP = $28.37
|
|
MB = $29.79
|
Most Recent Note - 3/15/2018 6:14:20 PM
G - Suffered a loss today with twice average volume, action indicative of distributional pressure after getting extended from the previously noted base. Prior highs in the $27-28 area define initial support to watch on pullbacks.
>>> FEATURED STOCK ARTICLE : Recently Profitable Internet - Content Firm Rallied to New High - 3/6/2018 |
View all notes |
Set NEW NOTE alert |
Company Profile |
SEC
News |
Chart |
Request a new note
C
A
S
I |
|
|
|
THESE ARE NOT BUY RECOMMENDATIONS!
Comments contained in the body of this report are technical
opinions only. The material herein has been obtained
from sources believed to be reliable and accurate, however,
its accuracy and completeness cannot be guaranteed.
This site is not an investment advisor, hence it does
not endorse or recommend any securities or other investments.
Any recommendation contained in this report may not
be suitable for all investors and it is not to be deemed
an offer or solicitation on our part with respect to
the purchase or sale of any securities. All trademarks,
service marks and trade names appearing in this report
are the property of their respective owners, and are
likewise used for identification purposes only.
This report is a service available
only to active Paid Premium Members.
You may opt-out of receiving report notifications
at any time. Questions or comments may be submitted
by writing to Premium Membership Services 665 S.E. 10 Street, Suite 201 Deerfield Beach, FL 33441-5634 or by calling 1-800-965-8307
or 954-785-1121.
|
|
|

