You are not logged in.
This means you
CAN ONLY VIEW reports that were published prior to Wednesday, March 26, 2025.
You
MUST UPGRADE YOUR MEMBERSHIP if you want to see any current reports.
AFTER MARKET UPDATE - FRIDAY, FEBRUARY 16TH, 2018
Previous After Market Report Next After Market Report >>>
|
|
|
|
DOW |
+19.01 |
25,219.38 |
+0.08% |
|
Volume |
945,841,360 |
+14% |
|
Volume |
2,028,345,210 |
-4% |
|
NASDAQ |
-16.96 |
7,239.47 |
-0.23% |
|
Advancers |
1,756 |
60% |
|
Advancers |
1,681 |
57% |
|
S&P 500 |
+1.02 |
2,732.22 |
+0.04% |
|
Decliners |
1,185 |
40% |
|
Decliners |
1,251 |
43% |
|
Russell 2000 |
+6.35 |
1,543.55 |
+0.41% |
|
52 Wk Highs |
78 |
|
|
52 Wk Highs |
83 |
|
|
S&P 600 |
+4.14 |
942.05 |
+0.44% |
|
52 Wk Lows |
25 |
|
|
52 Wk Lows |
29 |
|
|
 |
Leadership Improved and Breadth Was Positive as Indices Rose
Kenneth J. Gruneisen - Passed the CAN SLIM® Master's Exam
For the week, the Dow and S&P 500 both rose 4.3%, and the Nasdaq Composite advanced 5.3%. Stocks were generally higher Friday to post the best weekly gain since 2013. The Dow was up 19 points to 25219 and the S&P 500 gained a point to 2732. The Nasdaq Composite closed 17 points lower at 7239. Volume totals reported were mixed, higher than the prior session total on the NYSE and lower on the Nasdaq exchange. Breadth was positive as advancers led decliners by a 3-2 margin on the NYSE and on the Nasdaq exchange. For a 2nd consecutive session new 52-week highs totals expanded and outnumbered shrinking new 52-week lows totals on both the NYSE and the Nasdaq exchange. That marks a favorable shift, as new 52 week lows had decidedly outnumbered new highs since January 30th. New leadership again improved as there were 46 high-ranked companies from the Leaders List that made new 52-week highs and were listed on the BreakOuts Page, up from the total of 42 on the prior session. Charts used courtesy of www.stockcharts.com
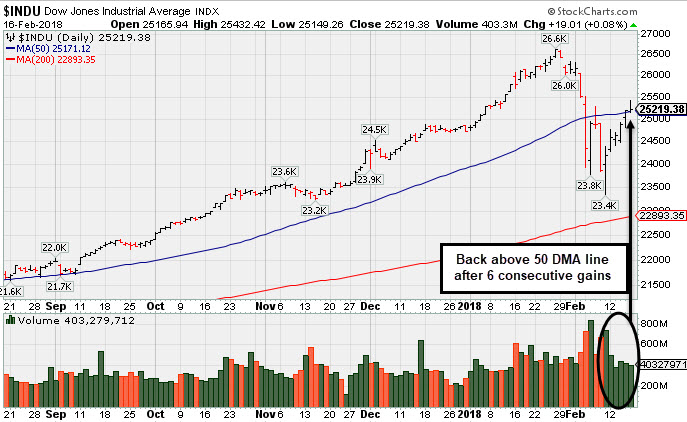 PICTURED: The Dow Jones Industrial Average has rebounded and closed above its 50-day moving average (DMA) line with a 6th gain. The major indices (M criteria) are back in a confirmed uptrend after Wednesday's noted follow-through-day gain. New buying efforts may be justified under the fact-based investment system, however, only when all key criteria of the fact-based investment system are satisfied. The Featured Stocks Page provides the latest analysis on noteworthy high-ranked leaders.
U.S. equities finished broadly in positive territory to extend the recovery from the market correction to a sixth consecutive day. On the economic front, reports unexpectedly showed housing starts grew 9.7% and building permits increased 7.4% in January. The University of Michigan revealed a surprise rise in consumer sentiment in February. The market pared its gains as investors digested news of new indictments related to Russian interference in the 2016 U.S. presidential election.
Health Care was the best performing S&P 500 sector led by Johnson & Johnson (JNJ +1.46%). In earnings news, Deere (DE +1.58%) and Coca-Cola (KO +0.45%) rose after both Dow members posted quarterly results above analyst projections. Consumer Discretionary was the notable decliner with apparel maker VF Corp (VFC -11.08%) down as its profits came in below analyst forecasts.
Treasuries were generally higher sending yields lower along the yield curve. The 10-year note yield was down four basis points to 2.87%. In commodities, NYMEX WTI crude was 0.5% higher at $61.66/barrel. COMEX gold was up 0.1% to $1353.20/ounce.
|
 Kenneth J. Gruneisen started out as a licensed stockbroker in August 1987, a couple of months prior to the historic stock market crash that took the Dow Jones Industrial Average down -22.6% in a single day. He has published daily fact-based fundamental and technical analysis on high-ranked stocks online for two decades. Through FACTBASEDINVESTING.COM, Kenneth provides educational articles, news, market commentary, and other information regarding proven investment systems that work in good times and bad.
Comments contained in the body of this report are technical opinions only and are not necessarily those of Gruneisen Growth Corp. The material herein has been obtained from sources believed to be reliable and accurate, however, its accuracy and completeness cannot be guaranteed. Our firm, employees, and customers may effect transactions, including transactions contrary to any recommendation herein, or have positions in the securities mentioned herein or options with respect thereto. Any recommendation contained in this report may not be suitable for all investors and it is not to be deemed an offer or solicitation on our part with respect to the purchase or sale of any securities. |
|
 |
Broker/Dealer Index Rose; Gold & Silver Index Fell
Kenneth J. Gruneisen - Passed the CAN SLIM® Master's Exam
The Retail Index ($RLX -0.34%) edged lower, the Bank Index ($BKX +0.07%) was unchanged, and the Broker/Dealer Index ($XBD +0.93%) rose on Friday. The Networking Index ($NWX -1.42%) outpaced the Semiconductor Index ($SOX -0.35%) and the Biotechnology Index ($BTK -0.14%) to the downside while the tech sector had a negative bias. The Oil Services Index ($OSX +0.22%) and Integrated Oil Index ($XOI -0.28%) were mixed and little changed. The Gold & Silver Index ($XAU -2.63%) was a standout decliner. Charts courtesy wwwstockcharts.com
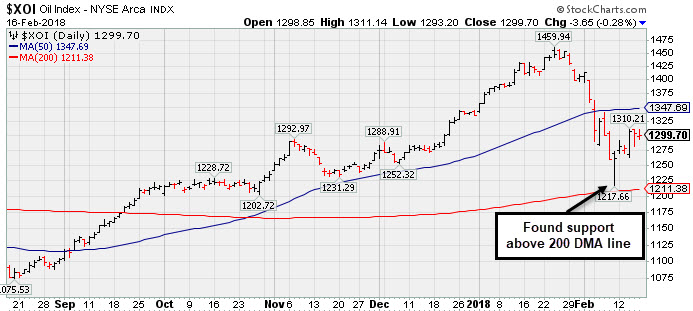 PICTURED: The Integrated Oil Index ($XOI -0.28%) found prompt support above its 200-day moving average (DMA) line after slumping from its January high.
| Oil Services |
$OSX |
136.85 |
+0.30 |
+0.22% |
-8.49% |
| Integrated Oil |
$XOI |
1,299.70 |
-3.65 |
-0.28% |
-2.68% |
| Semiconductor |
$SOX |
1,318.32 |
-4.63 |
-0.35% |
+5.21% |
| Networking |
$NWX |
524.42 |
-7.56 |
-1.42% |
+6.91% |
| Broker/Dealer |
$XBD |
283.16 |
+2.60 |
+0.93% |
+6.76% |
| Retail |
$RLX |
1,951.62 |
-6.59 |
-0.34% |
+12.57% |
| Gold & Silver |
$XAU |
83.23 |
-2.25 |
-2.63% |
-2.39% |
| Bank |
$BKX |
113.72 |
+0.08 |
+0.07% |
+6.57% |
| Biotech |
$BTK |
4,690.07 |
-6.41 |
-0.14% |
+11.08% |
|
|
|
 |
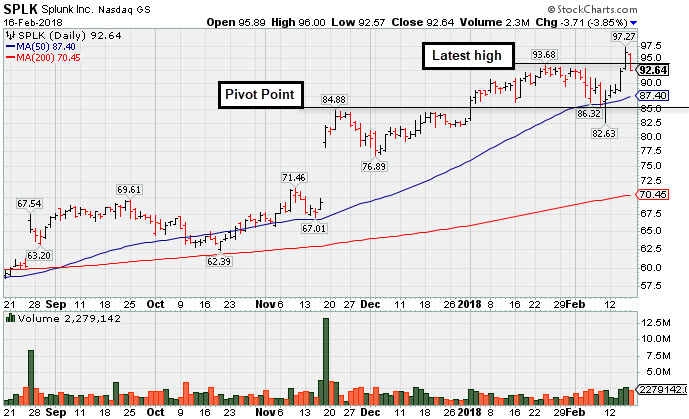
Pulled Back to 10-Week Moving Average After Technical Breakout
Kenneth J. Gruneisen - Passed the CAN SLIM® Master's Exam
Splunk Inc (SPLK -$3.71 or -3.85% to $92.64) pulled back today after hitting new multi-year highs with volume-driven gains. It was highlighted in yellow in the 2/15/18 mid-day report (read here). A valid secondary buy point exists up to +5% above the prior high since finding support at the 10-week moving average (WMA) after the prior breakout.
The high-ranked Reported earnings +70% on +34% sales revenues for the Oct '17 quarter. Three of the past 4 quarterly comparisons showed strong earnings above the +25% minimum guideline (C criteria) and its annual earnings (A criteria) history has been strong since reaching profitability in FY '15.
The current Up/Down Volume Ratio of 1.5 is an unbiased indication its shares have been under accumulation over the past 50 days. Its Timeliness Rating is A and Sponsorship Rating is B.The number of top-rated funds owning its shares rose from 749 in Mar '17 to 790 in Dec '17, a reassuring sign concerning the I criteria. |
|
|
Color Codes Explained :
Y - Better candidates highlighted by our
staff of experts.
G - Previously featured
in past reports as yellow but may no longer be buyable under the
guidelines.
***Last / Change / Volume data in this table is the closing quote data***
Symbol/Exchange
Company Name
Industry Group |
PRICE |
CHANGE
(%Change) |
Day High |
Volume
(% DAV)
(% 50 day avg vol) |
52 Wk Hi
% From Hi |
Featured
Date |
Price
Featured |
Pivot Featured |
|
Max Buy |
TPL
-
NYSE
Texas Pacific Land Trust
FINANCIAL SERVICES - Diversified Investments
|
$505.74
|
+5.59
1.12% |
$513.69
|
8,299
46.11% of 50 DAV
50 DAV is 18,000
|
$569.99
-11.27%
|
12/21/2017
|
$419.50
|
PP = $435.09
|
|
MB = $456.84
|
Most Recent Note - 2/14/2018 7:38:59 PM
G - Consolidating after getting very extended from the previously noted base. Its 50 DMA line ($475) defines initial support to watch above prior highs in the $435 area. Reported earnings +29% on +118% sales revenues for the Dec '17 quarter.
>>> FEATURED STOCK ARTICLE : Considerable Gains in First 2-3 Weeks After Recent Breakout - 1/23/2018 |
View all notes |
Set NEW NOTE alert |
Company Profile |
SEC
News |
Chart |
Request a new note
C
A
S
I |
YY
-
NASDAQ
YY Inc
INTERNET - Internet Service Providers
|
$128.93
|
-0.09
-0.07% |
$132.29
|
906,512
77.48% of 50 DAV
50 DAV is 1,170,000
|
$142.97
-9.82%
|
12/29/2017
|
$113.06
|
PP = $123.58
|
|
MB = $129.76
|
Most Recent Note - 2/14/2018 1:21:01 PM
G - Rebounding above its 50 DMA line ($121.61) with a gain today helping its outlook improve, but it has not formed a sound new base of sufficient length.
>>> FEATURED STOCK ARTICLE : Retreating After +78% Rally in 5 Months - 2/2/2018 |
View all notes |
Set NEW NOTE alert |
Company Profile |
SEC
News |
Chart |
Request a new note
C
A
S
I |
LOGM
-
NASDAQ
Logmein Inc
INTERNET - Internet Software andamp; Services
|
$122.45
|
-11.35
-8.48% |
$129.94
|
2,381,669
454.52% of 50 DAV
50 DAV is 524,000
|
$134.80
-9.16%
|
2/15/2018
|
$132.35
|
PP = $129.61
|
|
MB = $136.09
|
 Most Recent Note - 2/16/2018 12:08:57 PM
Y - Trading in a wide range today after a gap down and big volume-driven loss raised concerns. The strong gain on 2/14/18 triggered a technical buy signal as it rose above the pivot point cited. Reported Dec '17 earnings +94% on +214% sales revenues. Volume and volatility often increase near earnings news. Annual earnings (A criteria) history has been strong after a downturn in FY '13. See the latest FSU analysis for more details and an annotated graph.
>>> FEATURED STOCK ARTICLE : Technical Breakout Came Ahead of Earnings News - 2/15/2018 |
View all notes |
Set NEW NOTE alert |
Company Profile |
SEC
News |
Chart |
Request a new note
C
A
S
I |
HTHT
-
NASDAQ
China Lodging Group Ads
LEISURE - Lodging
|
$146.99
|
-0.48
-0.33% |
$150.52
|
224,873
35.08% of 50 DAV
50 DAV is 641,000
|
$166.19
-11.55%
|
12/22/2017
|
$138.07
|
PP = $142.90
|
|
MB = $150.05
|
Most Recent Note - 2/14/2018 7:55:26 PM
G - Consolidating above its 50 DMA line ($140.98), it has not formed a sound base. More damaging losses below the prior low ($128.60 on 2/09/18) the would raise greater concerns.
>>> FEATURED STOCK ARTICLE : Found Support Above Prior High After Latest Breakout - 1/24/2018 |
View all notes |
Set NEW NOTE alert |
Company Profile |
SEC
News |
Chart |
Request a new note
C
A
S
I |
PETS
-
NASDAQ
Petmed Express Inc
RETAIL - Drug Stores
|
$44.17
|
-0.71
-1.58% |
$45.24
|
920,822
128.97% of 50 DAV
50 DAV is 714,000
|
$57.80
-23.58%
|
1/19/2018
|
$53.59
|
PP = $51.00
|
|
MB = $53.55
|
Most Recent Note - 2/14/2018 7:34:42 PM
G - Still sputtering below its 50 DMA ($46.28) line, and a rebound above the 50 DMA line is needed to help its outlook improve. Recently reported earnings +83% on +14% sales revenues, continuing its strong earnings track record. See the latest FSU analysis for more details and an annotated graph.
>>> FEATURED STOCK ARTICLE : Sputtering Below 50-Day Average After Negative Reversal - 2/14/2018 |
View all notes |
Set NEW NOTE alert |
Company Profile |
SEC
News |
Chart |
Request a new note
C
A
S
I |
Symbol/Exchange
Company Name
Industry Group |
PRICE |
CHANGE
(%Change) |
Day High |
Volume
(% DAV)
(% 50 day avg vol) |
52 Wk Hi
% From Hi |
Featured
Date |
Price
Featured |
Pivot Featured |
|
Max Buy |
ESNT
-
NYSE
Essent Group Ltd
Finance-MrtgandRel Svc
|
$47.23
|
+0.36
0.77% |
$47.64
|
291,892
41.79% of 50 DAV
50 DAV is 698,500
|
$50.08
-5.69%
|
10/9/2017
|
$39.75
|
PP = $41.54
|
|
MB = $43.62
|
Most Recent Note - 2/14/2018 7:57:44 PM
G - Rebounded above its 50 DMA line ($46.11) with today's 4th consecutive volume-driven gain since slumping near its 200 DMA line ($40.94). More damaging losses would raise greater concerns. Reported earnings +16% on +27% sales revenues for the Dec '17 quarter, below the +25% minimum earnings guideline (C criteria), raising fundamental concerns.
>>> FEATURED STOCK ARTICLE : Slumped Below 50-Day Average With Earnings News Due Friday - 2/6/2018 |
View all notes |
Set NEW NOTE alert |
Company Profile |
SEC
News |
Chart |
Request a new note
C
A
S
I |
FIVE
-
NASDAQ
Five Below Inc
Retail-DiscountandVariety
|
$66.92
|
+2.40
3.72% |
$67.32
|
1,174,336
107.74% of 50 DAV
50 DAV is 1,090,000
|
$73.55
-9.01%
|
1/2/2018
|
$69.16
|
PP = $68.99
|
|
MB = $72.44
|
Most Recent Note - 2/14/2018 8:00:50 PM
G - Posted a gain today with light volume. A rebound above the 50 DMA line ($66.38) is needed for its outlook to improve. See the latest FSU analysis for more details and an annotated graph.
>>> FEATURED STOCK ARTICLE : Rebound Above 50-day Moving Average is Needed to Help Outlook - 2/12/2018 |
View all notes |
Set NEW NOTE alert |
Company Profile |
SEC
News |
Chart |
Request a new note
C
A
S
I |
MDXG
-
NASDAQ
MiMedx Group Inc
Medical-Products
|
$14.47
|
-0.96
-6.22% |
$15.41
|
3,402,189
182.13% of 50 DAV
50 DAV is 1,868,000
|
$18.25
-20.71%
|
1/29/2018
|
$17.43
|
PP = $17.57
|
|
MB = $18.45
|
Most Recent Note - 2/16/2018 11:42:12 AM
Y - Undercutting the recent low ($14.61 on 2/09/18) while slumping near its 50 and 200 DMA lines. Concerns were raised after it negated the recent breakout and slumped into the prior base. Disciplined investors always limit losses by selling any stock that falls more than -7% from their purchase price.
>>> FEATURED STOCK ARTICLE : Hit a New High With it 6th Consecutive Gain - 1/29/2018 |
View all notes |
Set NEW NOTE alert |
Company Profile |
SEC
News |
Chart |
Request a new note
C
A
S
I |
SPLK
-
NASDAQ
Splunk Inc
Computer Sftwr-Database
|
$92.64
|
-3.71
-3.85% |
$96.00
|
2,278,370
152.20% of 50 DAV
50 DAV is 1,497,000
|
$97.27
-4.76%
|
2/15/2018
|
$96.06
|
PP = $93.68
|
|
MB = $98.36
|
Most Recent Note - 2/16/2018 7:08:16 PM
Y - Pulled back today after hitting new multi-year highs with 2 consecutive volume-driven gains. A valid secondary buy point exists up to +5% above the prior high since finding support at the 10 WMA after the prior breakout. Reported earnings +70% on +34% sales revenues for the Oct '17 quarter. Three of the past 4 quarterly comparisons showed strong earnings above the +25% minimum guideline (C criteria) and its annual earnings (A criteria) history has been strong since reaching profitability in FY '15. See the latest FSU analysis for more details and an annotated graph.
>>> FEATURED STOCK ARTICLE : Pulled Back to 10-Week Moving Average After Technical Breakout - 2/16/2018 |
View all notes |
Set NEW NOTE alert |
Company Profile |
SEC
News |
Chart |
Request a new note
C
A
S
I |
ANET
-
NYSE
Arista Networks Inc
TELECOMMUNICATIONS - Communication Equipment
|
$249.49
|
-58.47
-18.99% |
$269.00
|
8,862,470
1,021.02% of 50 DAV
50 DAV is 868,000
|
$311.67
-19.95%
|
1/8/2018
|
$248.88
|
PP = $245.75
|
|
MB = $258.04
|
Most Recent Note - 2/16/2018 11:36:27 AM
G - Gapped down today for a considerable volume-driven loss undercutting its 50 DMA line ($254.54) and raising concerns. Prior highs in the $245 area define the next important support. Reported earnings +64% on +43% sales revenues for the Dec '17 quarter. Volume and volatility often increase near earnings news.
>>> FEATURED STOCK ARTICLE : Consolidating After Getting Extended From its Prior High - 1/31/2018 |
View all notes |
Set NEW NOTE alert |
Company Profile |
SEC
News |
Chart |
Request a new note
C
A
S
I |
Symbol/Exchange
Company Name
Industry Group |
PRICE |
CHANGE
(%Change) |
Day High |
Volume
(% DAV)
(% 50 day avg vol) |
52 Wk Hi
% From Hi |
Featured
Date |
Price
Featured |
Pivot Featured |
|
Max Buy |
PAYC
-
NYSE
Paycom Software Inc
COMPUTER SOFTWARE and SERVICES - Application Software
|
$94.90
|
-0.11
-0.12% |
$96.59
|
1,067,956
153.00% of 50 DAV
50 DAV is 698,000
|
$95.65
-0.78%
|
2/15/2018
|
$95.01
|
PP = $93.61
|
|
MB = $98.29
|
Most Recent Note - 2/15/2018 5:58:32 PM
Y - Color code is changed to yellow while a valid "secondary buy point" exists up to +5% above the latest high. Found prompt support at its 10-week moving average following the prior breakout. Recently reported Dec '17 quarterly earnings +61% on +30% sales revenues after the close, continuing its strong earnings track record.
>>> FEATURED STOCK ARTICLE : Fell Below 50 Day Average With Losses on Above Average Volume - 2/8/2018 |
View all notes |
Set NEW NOTE alert |
Company Profile |
SEC
News |
Chart |
Request a new note
C
A
S
I |
GRUB
-
NYSE
Grubhub Inc
COMPUTER SOFTWARE and SERVICES - Technical and System Software
|
$95.93
|
+1.53
1.62% |
$96.58
|
1,836,414
105.85% of 50 DAV
50 DAV is 1,735,000
|
$94.89
1.10%
|
6/21/2017
|
$47.33
|
PP = $46.94
|
|
MB = $49.29
|
Most Recent Note - 2/14/2018 7:52:11 PM
G - Rallied for a new high close with today's big volume-driven gain, getting more extended from any sound base. Recently reported earnings +61% on +49% sales revenues for the Dec '17 quarter.
>>> FEATURED STOCK ARTICLE : Slumped Below 50-Day Average With Earnings News Due - 2/7/2018 |
View all notes |
Set NEW NOTE alert |
Company Profile |
SEC
News |
Chart |
Request a new note
C
A
S
I |
PYPL
-
NASDAQ
Paypal Holdings Inc
Finance-CrdtCard/PmtPr
|
$78.37
|
+0.08
0.10% |
$78.75
|
9,740,307
98.92% of 50 DAV
50 DAV is 9,847,000
|
$86.32
-9.21%
|
2/1/2018
|
$80.35
|
PP = $79.49
|
|
MB = $83.46
|
Most Recent Note - 2/14/2018 7:37:53 PM
G - Posted a gain today and closed near its 50 DMA line ($77.31) helping its outlook improve. More damaging losses below the recent low ($71.63 on 2/09/18) would raise concerns and trigger a more worrisome technical sell signal.
>>> FEATURED STOCK ARTICLE : Gap Down Following Earnings News Tests Important Support Level - 2/1/2018 |
View all notes |
Set NEW NOTE alert |
Company Profile |
SEC
News |
Chart |
Request a new note
C
A
S
I |
OLLI
-
NASDAQ
Ollie's Bargain Outlet
Retail-DiscountandVariety
|
$56.55
|
-0.35
-0.62% |
$57.40
|
343,010
56.60% of 50 DAV
50 DAV is 606,000
|
$58.50
-3.33%
|
11/21/2017
|
$46.78
|
PP = $47.00
|
|
MB = $49.35
|
Most Recent Note - 2/13/2018 6:19:31 PM
G - Holding its ground quietly, it managed two positive reversals last week after intra-day dips below its 50 DMA line ($53.21) raised concerns. Prior low ($50.15 on 1/04/18) defines the next important near-term support. See the latest FSU analysis for more details and a new annotated graph.
>>> FEATURED STOCK ARTICLE : Consolidating Above 50-Day Moving Average Line - 2/13/2018 |
View all notes |
Set NEW NOTE alert |
Company Profile |
SEC
News |
Chart |
Request a new note
C
A
S
I |
WB
-
NASDAQ
Weibo Corp Cl A Ads
INTERNET - Content
|
$134.74
|
-0.38
-0.28% |
$138.90
|
1,727,226
94.95% of 50 DAV
50 DAV is 1,819,000
|
$142.12
-5.19%
|
1/16/2018
|
$126.33
|
PP = $122.21
|
|
MB = $128.32
|
Most Recent Note - 2/15/2018 2:27:58 PM
G - Hit new all-time highs with 4 consecutive gains backed by above average volume, rallying further above its "max buy" level. Recently reported earnings +88% on +77% sales revenues for the Dec '17 quarter, continuing its strong earnings track record.
>>> FEATURED STOCK ARTICLE : Consolidating Near 50-Day Average With Earnings News Due - 2/9/2018 |
View all notes |
Set NEW NOTE alert |
Company Profile |
SEC
News |
Chart |
Request a new note
C
A
S
I |
Symbol/Exchange
Company Name
Industry Group |
PRICE |
CHANGE
(%Change) |
Day High |
Volume
(% DAV)
(% 50 day avg vol) |
52 Wk Hi
% From Hi |
Featured
Date |
Price
Featured |
Pivot Featured |
|
Max Buy |
HLI
-
NYSE
Houlihan Lokey Inc Cl A
Finance-Invest Bnk/Bkrs
|
$46.16
|
-0.12
-0.26% |
$46.76
|
222,637
98.95% of 50 DAV
50 DAV is 225,000
|
$52.81
-12.59%
|
1/3/2018
|
$45.88
|
PP = $47.09
|
|
MB = $49.44
|
Most Recent Note - 2/14/2018 7:44:41 PM
G - Consolidating near its 50 DMA line ($47.16). The recent low ($43.73 on 2/06/18) defines near term support where a violation would raise greater concerns. Recently reported earnings +21% on +5% sales revenues for the Dec '17 quarter, below the +25% minimum earnings guideline (C criteria), raising fundamental concerns. On 10/26/17 it completed a Secondary Offering.
>>> FEATURED STOCK ARTICLE : Damaging Violation of 50-Day Moving Average Line - 2/5/2018 |
View all notes |
Set NEW NOTE alert |
Company Profile |
SEC
News |
Chart |
Request a new note
C
A
S
I |
|
|
|
THESE ARE NOT BUY RECOMMENDATIONS!
Comments contained in the body of this report are technical
opinions only. The material herein has been obtained
from sources believed to be reliable and accurate, however,
its accuracy and completeness cannot be guaranteed.
This site is not an investment advisor, hence it does
not endorse or recommend any securities or other investments.
Any recommendation contained in this report may not
be suitable for all investors and it is not to be deemed
an offer or solicitation on our part with respect to
the purchase or sale of any securities. All trademarks,
service marks and trade names appearing in this report
are the property of their respective owners, and are
likewise used for identification purposes only.
This report is a service available
only to active Paid Premium Members.
You may opt-out of receiving report notifications
at any time. Questions or comments may be submitted
by writing to Premium Membership Services 665 S.E. 10 Street, Suite 201 Deerfield Beach, FL 33441-5634 or by calling 1-800-965-8307
or 954-785-1121.
|
|
|