***Last / Change / Volume data in this table is the closing quote data***
Symbol/Exchange
Company Name
Industry Group |
PRICE |
CHANGE
(%Change) |
Day High |
Volume
(% DAV)
(% 50 day avg vol) |
52 Wk Hi
% From Hi |
Featured
Date |
Price
Featured |
Pivot Featured |
|
Max Buy |
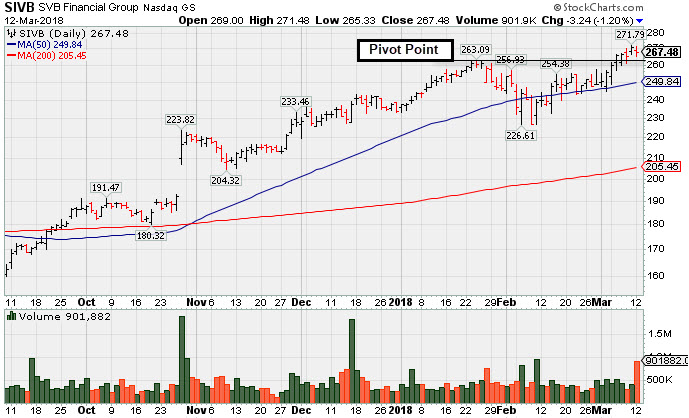
SIVB
-
NASDAQ
S V B Financial Group
BANKING - Regional - Pacific Banks
|
$267.48
|
-3.24
-1.20% |
$271.48
|
901,882
219.97% of 50 DAV
50 DAV is 410,000
|
$271.79
-1.59%
|
3/12/2018
|
$267.79
|
PP = $263.19
|
|
MB = $276.35
|
 Most Recent Note - 3/12/2018 5:48:27 PM
Y - Endured distributional pressure today as it suffered a loss with above average volume after highlighted in yellow with pivot point cited based on its 1/24/18 high plus 10 cents in the mid-day report. Wedged to new 52-week highs with recent gains lacking great volume conviction after a short flat base. Gains above a stock's pivot point must have at least +40% above average volume to trigger a proper technical buy signal. Reported earnings +53% on +32% sales revenues for the Dec '17 quarter, marking its 4th consecutive comparison above the +25% minimum guideline (C criteria), helping it better match the fact-based investment system's guidelines. See the latest FSU analysis for more details and a new annotated graph.
>>> FEATURED STOCK ARTICLE : Endured Distributional Pressure After Wedging Higher - 3/12/2018 |
View all notes |
Set NEW NOTE alert |
Company Profile |
SEC
News |
Chart |
Request a new note
C
A
S
I |
TPL
-
NYSE
Texas Pacific Land Trust
FINANCIAL SERVICES - Diversified Investments
|
$527.49
|
+4.85
0.93% |
$531.74
|
11,309
62.83% of 50 DAV
50 DAV is 18,000
|
$569.99
-7.46%
|
2/20/2018
|
$517.00
|
PP = $569.99
|
|
MB = $598.49
|
Most Recent Note - 3/12/2018 6:09:26 PM
Y - Volume totals have been cooling while consolidating in an orderly fashion above its 50 DMA line ($512.84). Reported earnings +29% on +118% sales revenues for the Dec '17 quarter.
>>> FEATURED STOCK ARTICLE : Finding Support Above 50-Day Moving Average Line - 2/22/2018 |
View all notes |
Set NEW NOTE alert |
Company Profile |
SEC
News |
Chart |
Request a new note
C
A
S
I |
YY
-
NASDAQ
YY Inc
INTERNET - Internet Service Providers
|
$119.29
|
-0.70
-0.58% |
$121.49
|
2,136,922
139.58% of 50 DAV
50 DAV is 1,531,000
|
$142.97
-16.56%
|
12/29/2017
|
$113.06
|
PP = $123.58
|
|
MB = $129.76
|
Most Recent Note - 3/8/2018 1:00:58 PM
G - Gapped up today but quickly erased early gains and slumped back below its 50 DMA line ($127.85) again. Wider than usual intra-day price swings are a sign of uncertainty. Faces resistance due to overhead supply up to the $142 level. Reported earnings +55% on +56% sales revenues for the Dec '17 quarter, continuing its strong earnings track record.
>>> FEATURED STOCK ARTICLE : Earnings News Due Next Week for Chinese Social Platform - 2/27/2018 |
View all notes |
Set NEW NOTE alert |
Company Profile |
SEC
News |
Chart |
Request a new note
C
A
S
I |
LOGM
-
NASDAQ
Logmein Inc
INTERNET - Internet Software andamp; Services
|
$127.75
|
+1.50
1.19% |
$128.95
|
453,074
78.92% of 50 DAV
50 DAV is 574,100
|
$134.80
-5.23%
|
2/15/2018
|
$132.35
|
PP = $129.61
|
|
MB = $136.09
|
Most Recent Note - 3/12/2018 6:03:06 PM
Y - Today's quiet gain led to its 3rd best close ever and its color code is changed to yellow. Rebound above the 50 DMA line ($121.38) helped its outlook improve after it found support at its 200 DMA line. However, its Relative Strength rating is 77, still below the 80+ minimum guideline for buy candidates.
>>> FEATURED STOCK ARTICLE : Technical Breakout Came Ahead of Earnings News - 2/15/2018 |
View all notes |
Set NEW NOTE alert |
Company Profile |
SEC
News |
Chart |
Request a new note
C
A
S
I |
HTHT
-
NASDAQ
China Lodging Group Ads
LEISURE - Lodging
|
$154.50
|
+0.76
0.49% |
$155.97
|
679,885
129.50% of 50 DAV
50 DAV is 525,000
|
$166.19
-7.03%
|
12/22/2017
|
$138.07
|
PP = $142.90
|
|
MB = $150.05
|
Most Recent Note - 3/7/2018 5:39:42 PM
G - While consolidating above its 50 DMA line ($149) its outlook has improved. Subsequent losses below the recent low ($141.01 on 3/02/18) would raise greater concerns and trigger a technical sell signal.
>>> FEATURED STOCK ARTICLE : Repaired Recent Technical Damage But Has Not Formed a New Base - 2/23/2018 |
View all notes |
Set NEW NOTE alert |
Company Profile |
SEC
News |
Chart |
Request a new note
C
A
S
I |
Symbol/Exchange
Company Name
Industry Group |
PRICE |
CHANGE
(%Change) |
Day High |
Volume
(% DAV)
(% 50 day avg vol) |
52 Wk Hi
% From Hi |
Featured
Date |
Price
Featured |
Pivot Featured |
|
Max Buy |
PETS
-
NASDAQ
Petmed Express Inc
RETAIL - Drug Stores
|
$47.13
|
+0.38
0.81% |
$48.22
|
385,439
55.94% of 50 DAV
50 DAV is 689,000
|
$57.80
-18.46%
|
1/19/2018
|
$53.59
|
PP = $51.00
|
|
MB = $53.55
|
Most Recent Note - 3/7/2018 5:34:51 PM
G - Tallied 3 consecutive small gains with light volume, but still sputtering below its 50 DMA line ($46.71). Faces near-term resistance due to overhead supply up to the $57 level. Recently reported earnings +83% on +14% sales revenues, continuing its strong earnings track record.
>>> FEATURED STOCK ARTICLE : Sputtering Below 50-Day Average After Negative Reversal - 2/14/2018 |
View all notes |
Set NEW NOTE alert |
Company Profile |
SEC
News |
Chart |
Request a new note
C
A
S
I |
DPZ
-
NYSE
Dominos Pizza Inc
WHOLESALE - Food Wholesale
|
$227.69
|
-2.57
-1.12% |
$232.49
|
855,319
77.13% of 50 DAV
50 DAV is 1,109,000
|
$236.00
-3.52%
|
2/20/2018
|
$224.86
|
PP = $222.01
|
|
MB = $233.11
|
Most Recent Note - 3/12/2018 5:51:33 PM
Y - After poised for a best-ever close it reversed and closed lower today with higher (below average) volume. Tallied big gains then stalled after highlighted in the 2/20/18 mid-day report with pivot point cited based on its 1/25/18 high plus 10 cents.
>>> FEATURED STOCK ARTICLE : Popular Pizza Firm Met Resistance Near Prior High - 2/20/2018 |
View all notes |
Set NEW NOTE alert |
Company Profile |
SEC
News |
Chart |
Request a new note
C
A
S
I |
ESNT
-
NYSE
Essent Group Ltd
Finance-MrtgandRel Svc
|
$42.99
|
-4.67
-9.80% |
$47.66
|
1,998,199
319.71% of 50 DAV
50 DAV is 625,000
|
$50.08
-14.16%
|
10/9/2017
|
$39.75
|
PP = $41.54
|
|
MB = $43.62
|
Most Recent Note - 3/12/2018 5:53:05 PM
It will be dropped from the Featured Stocks list tonight. Slumped well below its 50 DMA line ($46.30) with a big volume-driven loss raising concerns and again testing support near its 200 DMA line. Reported earnings +16% on +27% sales revenues for the Dec '17 quarter, below the +25% minimum earnings guideline (C criteria), raising fundamental concerns.
>>> FEATURED STOCK ARTICLE : Sputtering ESNBelow 50-Day Moving Average Line - 3/2/2018 |
View all notes |
Set NEW NOTE alert |
Company Profile |
SEC
News |
Chart |
Request a new note
C
A
S
I |
FIVE
-
NASDAQ
Five Below Inc
Retail-DiscountandVariety
|
$67.36
|
-1.22
-1.78% |
$69.70
|
1,432,760
140.60% of 50 DAV
50 DAV is 1,019,000
|
$73.55
-8.42%
|
3/9/2018
|
$68.58
|
PP = $73.65
|
|
MB = $77.33
|
Most Recent Note - 3/9/2018 5:46:05 PM
Y - New pivot point is cited based on its 1/05/18 high plus 10 cents. Subsequent volume-driven gains above the pivot point may trigger a new (or add-on) technical buy signal. Consolidating above its 50 DMA line ($66.81). The recent low ($60.00 on 2/06/18) defines important near-term support to watch on pullbacks. See the latest FSU analysis for more details and a new annotated graph.
>>> FEATURED STOCK ARTICLE : Retailer Rebounding Within Striking Distance of Prior High - 3/9/2018 |
View all notes |
Set NEW NOTE alert |
Company Profile |
SEC
News |
Chart |
Request a new note
C
A
S
I |
SPLK
-
NASDAQ
Splunk Inc
Computer Sftwr-Database
|
$107.90
|
+0.69
0.64% |
$108.48
|
2,225,499
128.12% of 50 DAV
50 DAV is 1,737,000
|
$108.89
-0.91%
|
2/15/2018
|
$96.06
|
PP = $93.68
|
|
MB = $98.36
|
Most Recent Note - 3/7/2018 12:37:23 PM
G - Hitting yet another new all-time high today, getting more extended from any sound base. Disciplined investors avoid chasing extended stocks. Bullish action came after it reported earnings +76% on +37% sales revenues for the quarter ended January 31, 2018 versus the year ago period.
>>> FEATURED STOCK ARTICLE : Pulled Back to 10-Week Moving Average After Technical Breakout - 2/16/2018 |
View all notes |
Set NEW NOTE alert |
Company Profile |
SEC
News |
Chart |
Request a new note
C
A
S
I |
Symbol/Exchange
Company Name
Industry Group |
PRICE |
CHANGE
(%Change) |
Day High |
Volume
(% DAV)
(% 50 day avg vol) |
52 Wk Hi
% From Hi |
Featured
Date |
Price
Featured |
Pivot Featured |
|
Max Buy |
PAYC
-
NYSE
Paycom Software Inc
COMPUTER SOFTWARE and SERVICES - Application Software
|
$110.20
|
+0.24
0.22% |
$111.34
|
459,948
62.07% of 50 DAV
50 DAV is 741,000
|
$110.25
-0.05%
|
2/15/2018
|
$95.01
|
PP = $93.61
|
|
MB = $98.29
|
Most Recent Note - 3/7/2018 5:20:25 PM
G - Stubbornly holding its ground and it hit yet another new all-time high with today's 4th consecutive gain, getting very extended from any sound base. Prior highs in the $93 area define initial support above its 50 DMA line ($90.13). Fundamentals remain strong. See the latest FSU analysis for more details and a new annotated graph.
>>> FEATURED STOCK ARTICLE : Extended From Prior Base After Streak of Gains - 3/7/2018 |
View all notes |
Set NEW NOTE alert |
Company Profile |
SEC
News |
Chart |
Request a new note
C
A
S
I |
GRUB
-
NYSE
Grubhub Inc
COMPUTER SOFTWARE and SERVICES - Technical and System Software
|
$109.59
|
+1.03
0.95% |
$110.36
|
1,339,064
73.13% of 50 DAV
50 DAV is 1,831,000
|
$108.66
0.86%
|
6/21/2017
|
$47.33
|
PP = $46.94
|
|
MB = $49.29
|
Most Recent Note - 3/12/2018 6:10:30 PM
G - Hit another new all-time high today, getting very extended from any sound base. Well above its 50 DMA line and prior highs defining near-term support. Recently reported earnings +61% on +49% sales revenues for the Dec '17 quarter.
>>> FEATURED STOCK ARTICLE : Bullish Action Followed Last Earnings Report - 3/1/2018 |
View all notes |
Set NEW NOTE alert |
Company Profile |
SEC
News |
Chart |
Request a new note
C
A
S
I |
HQY
-
NASDAQ
Healthequity Inc
COMPUTER SOFTWARE and SERVICES - Healthcare Information Service
|
$59.18
|
-0.38
-0.64% |
$59.82
|
541,284
90.36% of 50 DAV
50 DAV is 599,000
|
$59.99
-1.35%
|
2/20/2018
|
$56.37
|
PP = $55.41
|
|
MB = $58.18
|
Most Recent Note - 3/12/2018 5:58:20 PM
G - Color code is changed to green. Pulled back today after wedging into new high territory last week with gains lacking great volume conviction. Fundamentals remain strong.
>>> FEATURED STOCK ARTICLE : Fundamentals Remained Favorable and Strength Returned - 2/21/2018 |
View all notes |
Set NEW NOTE alert |
Company Profile |
SEC
News |
Chart |
Request a new note
C
A
S
I |
PYPL
-
NASDAQ
Paypal Holdings Inc
Finance-CrdtCard/PmtPr
|
$80.60
|
-0.11
-0.14% |
$81.17
|
6,577,644
66.85% of 50 DAV
50 DAV is 9,839,000
|
$86.32
-6.63%
|
2/1/2018
|
$80.35
|
PP = $79.49
|
|
MB = $83.46
|
Most Recent Note - 3/7/2018 5:36:09 PM
G - Quietly consolidating above its 50 DMA line ($78.72). Subsequent losses below the recent low ($71.63 on 2/09/18) would raise concerns and trigger a more worrisome technical sell signal. Fundamentals remain strong.
>>> FEATURED STOCK ARTICLE : Quietly Consolidating Back Above 50-Day Moving Average - 2/26/2018 |
View all notes |
Set NEW NOTE alert |
Company Profile |
SEC
News |
Chart |
Request a new note
C
A
S
I |
OLLI
-
NASDAQ
Ollie's Bargain Outlet
Retail-DiscountandVariety
|
$59.15
|
-0.50
-0.84% |
$60.05
|
381,232
70.60% of 50 DAV
50 DAV is 540,000
|
$62.05
-4.67%
|
11/21/2017
|
$46.78
|
PP = $47.00
|
|
MB = $49.35
|
Most Recent Note - 3/7/2018 5:43:56 PM
G - Gapped down for a loss on higher volume indicative of distributional pressure, retreating from its all-time high after getting extended from any sound base. Support is defined by its 50 DMA line ($55.74) and prior low ($50.15 on 1/04/18).
>>> FEATURED STOCK ARTICLE : Consolidating Above 50-Day Moving Average Line - 2/13/2018 |
View all notes |
Set NEW NOTE alert |
Company Profile |
SEC
News |
Chart |
Request a new note
C
A
S
I |
Symbol/Exchange
Company Name
Industry Group |
PRICE |
CHANGE
(%Change) |
Day High |
Volume
(% DAV)
(% 50 day avg vol) |
52 Wk Hi
% From Hi |
Featured
Date |
Price
Featured |
Pivot Featured |
|
Max Buy |
WB
-
NASDAQ
Weibo Corp Cl A Ads
INTERNET - Content
|
$130.68
|
-6.83
-4.97% |
$138.40
|
2,534,691
132.85% of 50 DAV
50 DAV is 1,908,000
|
$142.12
-8.05%
|
1/16/2018
|
$126.33
|
PP = $122.21
|
|
MB = $128.32
|
Most Recent Note - 3/12/2018 6:05:28 PM
G - Down today with above average volume, slumping toward its 50 DMA line ($126.64) which recently acted as support. It is extended from any sound base. Recently reported earnings +88% on +77% sales revenues for the Dec '17 quarter, continuing its strong earnings track record.
>>> FEATURED STOCK ARTICLE : Recent Consolidation is Not a New Base of Sufficient Length - 3/8/2018 |
View all notes |
Set NEW NOTE alert |
Company Profile |
SEC
News |
Chart |
Request a new note
C
A
S
I |
HLI
-
NYSE
Houlihan Lokey Inc Cl A
Finance-Invest Bnk/Bkrs
|
$48.38
|
+0.21
0.44% |
$48.95
|
291,135
129.97% of 50 DAV
50 DAV is 224,000
|
$52.81
-8.39%
|
1/3/2018
|
$45.88
|
PP = $47.09
|
|
MB = $49.44
|
Most Recent Note - 3/12/2018 5:54:54 PM
G - Rebounded above its 50 DMA line ($47.59) during a streak of 7 consecutive gains. The recent low ($43.73 on 2/06/18) defines near term support where a violation would raise greater concerns. Earnings +21% for the Dec '17 quarter were below the +25% minimum earnings guideline (C criteria) raising fundamental concerns.
>>> FEATURED STOCK ARTICLE : Recently Met Resistance at 50-Day Moving Average - 2/28/2018 |
View all notes |
Set NEW NOTE alert |
Company Profile |
SEC
News |
Chart |
Request a new note
C
A
S
I |
SQ
-
NYSE
Square Inc Cl A
Finance-CrdtCard/PmtPr
|
$53.19
|
+0.70
1.33% |
$53.79
|
12,470,286
80.37% of 50 DAV
50 DAV is 15,517,000
|
$53.22
-0.06%
|
3/5/2018
|
$49.70
|
PP = $49.66
|
|
MB = $52.14
|
Most Recent Note - 3/8/2018 11:53:51 AM
G - Color code is changed to green after hitting a new all-time high and rising above its "max buy" level. Prior highs in the $49-47 area define initial support to watch on pullbacks. Recent quarterly comparisons through Dec '17 showed strong sales revenues growth acceleration and solid earnings increases versus the year-ago periods. Limited annual earnings (A criteria) history remains a concern, yet it had a profitable FY '16 following its $9 IPO in Nov '15.
>>> FEATURED STOCK ARTICLE : New High & Considerable Gain Backed By Twice Average Volume - 3/5/2018 |
View all notes |
Set NEW NOTE alert |
Company Profile |
SEC
News |
Chart |
Request a new note
C
A
S
I |
SEND
-
NYSE
Sendgrid Inc
INTERNET - Content
|
$30.21
|
-0.83
-2.67% |
$32.03
|
362,901
157.78% of 50 DAV
50 DAV is 230,000
|
$31.73
-4.79%
|
3/6/2018
|
$28.00
|
PP = $28.37
|
|
MB = $29.79
|
Most Recent Note - 3/12/2018 6:07:31 PM
G - Reversed into the red for a loss today on higher volume, breaking a streak of 5 consecutive gains. Prior highs in the $27-28 area define initial support to watch on pullbacks.
>>> FEATURED STOCK ARTICLE : Recently Profitable Internet - Content Firm Rallied to New High - 3/6/2018 |
View all notes |
Set NEW NOTE alert |
Company Profile |
SEC
News |
Chart |
Request a new note
C
A
S
I |