You are not logged in.
This means you
CAN ONLY VIEW reports that were published prior to Tuesday, April 8, 2025.
You
MUST UPGRADE YOUR MEMBERSHIP if you want to see any current reports.
AFTER MARKET UPDATE - WEDNESDAY, MARCH 14TH, 2018
Previous After Market Report Next After Market Report >>>
|
|
|
|
DOW |
-248.91 |
24,758.12 |
-1.00% |
|
Volume |
829,113,330 |
+6% |
|
Volume |
2,104,471,751 |
-14% |
|
NASDAQ |
-14.20 |
7,496.81 |
-0.19% |
|
Advancers |
1,249 |
42% |
|
Advancers |
1,160 |
39% |
|
S&P 500 |
-15.83 |
2,749.48 |
-0.57% |
|
Decliners |
1,703 |
58% |
|
Decliners |
1,779 |
61% |
|
Russell 2000 |
-7.74 |
1,584.31 |
-0.49% |
|
52 Wk Highs |
51 |
|
|
52 Wk Highs |
78 |
|
|
S&P 600 |
-5.29 |
965.18 |
-0.55% |
|
52 Wk Lows |
85 |
|
|
52 Wk Lows |
35 |
|
|
 |
Breadth Negative and Less Leadership as Indices Fell
Kenneth J. Gruneisen - Passed the CAN SLIM® Master's Exam
Stocks finished lower Wednesday. The Dow fell 248 points to 24758 while the S&P 500 dropped 15 points to 2749. The Nasdaq Composite lost 14 points to 7496. The volume totals reported were mixed, higher than the prior session total on the NYSE and lower on the Nasdaq exchange. Decliners led advancers by almost a 3-2 margin on the NYSE and by 3-2 on the Nasdaq exchange. New 52-week highs outnumbered new 52-week lows on the NYSE while new lows outnumbered new highs on the Nasdaq exchange. Leadership contracted as there were 28 high-ranked companies from the Leaders List that made new 52-week highs and were listed on the BreakOuts Page, versus the total of 122 on the prior session. Charts used courtesy of www.stockcharts.com
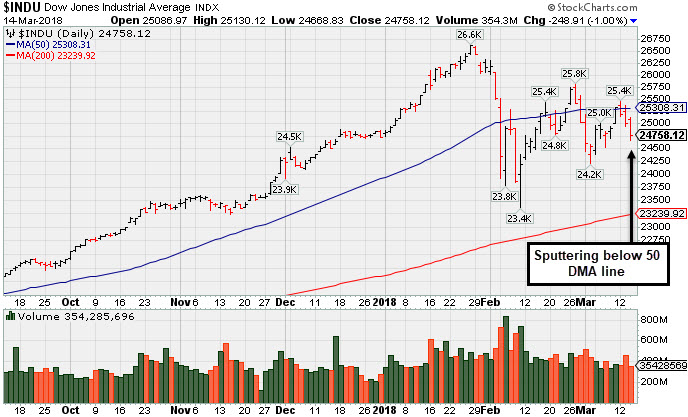 PICTURED: The Dow Jones Industrial Average is sputtering below its 50-day moving average (DMA) line. It finished Wednesday's session -6.9% off its record high hit on January 26th. The 200 DMA line (23,239) and its February 9th low (23,360) low define important near-term support to watch. The major indices (M criteria) are in a confirmed uptrend. New buying efforts are justified under the fact-based investment system when all key criteria of the fact-based investment system are satisfied. The Featured Stocks Page provides the most timely analysis on high-ranked leaders that are noteworthy and action worthy.
U.S. equities declined as potential trade war concerns were reignited. President Trump is considering new tariffs on Chinese imports, while the Commerce Department indicated U.S. companies will be granted few tariff exemptions. In political news, Larry Kudlow is expected to replace Gary Cohn as director of the National Economic Council.
On the data front, producer prices rose 0.2% month-over-month in February, in line with consensus forecasts. A separate release revealed retail sales slipped 0.1% last month, missing estimates for a 0.3% gain. This marks the first time since April 2012 that retail sales fell for three consecutive months. Another report showed U.S. business inventories grew 0.6% in January, meeting expectations. Nine of 11 sectors in the S&P 500 finished lower. Materials and Consumer Staples led decliners. Financials also lagged with Citigroup (C -1.92%). Department store shares fell amid weak retail sales data. In earnings, Signet Jewelers (SIG -20.23%) slumped after the company reduced forward guidance.
Treasuries strengthened with the yield on the benchmark 10-year note losing three basis points to 2.81%. In commodities, NYMEX WTI crude rose 0.3% to $60.88/barrel. COMEX gold slipped 0.1% to $1325.50/ounce amid a stronger dollar. |
 Kenneth J. Gruneisen started out as a licensed stockbroker in August 1987, a couple of months prior to the historic stock market crash that took the Dow Jones Industrial Average down -22.6% in a single day. He has published daily fact-based fundamental and technical analysis on high-ranked stocks online for two decades. Through FACTBASEDINVESTING.COM, Kenneth provides educational articles, news, market commentary, and other information regarding proven investment systems that work in good times and bad.
Comments contained in the body of this report are technical opinions only and are not necessarily those of Gruneisen Growth Corp. The material herein has been obtained from sources believed to be reliable and accurate, however, its accuracy and completeness cannot be guaranteed. Our firm, employees, and customers may effect transactions, including transactions contrary to any recommendation herein, or have positions in the securities mentioned herein or options with respect thereto. Any recommendation contained in this report may not be suitable for all investors and it is not to be deemed an offer or solicitation on our part with respect to the purchase or sale of any securities. |
|
 |
Financials and Networking Index Worst Declining Groups
Kenneth J. Gruneisen - Passed the CAN SLIM® Master's Exam
On Wednesday the Retail Index ($RLX +0.03%) finished flat while the Broker/Dealer Index ($XBD -0.76%), and Bank Index ($BKX -1.48%) suffered losses. The tech sector had a negative bias as the Networking Index ($NWX -0.51%) and the Biotechnology Index ($BTK -0.18%) each fell slightly and the Semiconductor Index ($SOX +0.00%) was unchanged. Commodity-linked shares were mixed and little changed with the Integrated Oil Index ($XOI -0.31%) edging lower and the Oil Services Index ($OSX +0.13%) the Gold & Silver Index ($XAU +0.11%) both inching higher. Charts courtesy wwwstockcharts.com
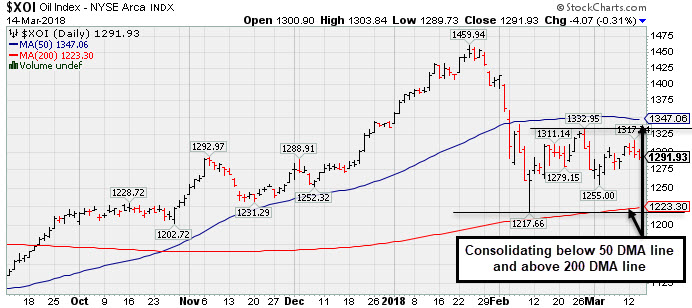 PICTURED: The Integrated Oil Index ($XOI -0.31%) is consolidating above its 200-day moving average (DMA) line and below its 50 DMA line.
| Oil Services |
$OSX |
138.36 |
+0.18 |
+0.13% |
-7.48% |
| Integrated Oil |
$XOI |
1,291.93 |
-4.07 |
-0.31% |
-3.27% |
| Semiconductor |
$SOX |
1,423.50 |
+0.04 |
+0.00% |
+13.60% |
| Networking |
$NWX |
553.55 |
-2.86 |
-0.51% |
+12.85% |
| Broker/Dealer |
$XBD |
296.05 |
-2.28 |
-0.76% |
+11.62% |
| Retail |
$RLX |
2,026.14 |
+0.54 |
+0.03% |
+16.86% |
| Gold & Silver |
$XAU |
79.79 |
+0.09 |
+0.11% |
-6.43% |
| Bank |
$BKX |
112.49 |
-1.69 |
-1.48% |
+5.42% |
| Biotech |
$BTK |
4,856.83 |
-8.58 |
-0.18% |
+15.03% |
|
|
|
 |
Rebounding After Finding Support at 200-Day Average
Kenneth J. Gruneisen - Passed the CAN SLIM® Master's Exam
Logmein Inc (LOGM -$0.35 or -0.27% to $127.15) is perched within -5.7% of its record high. Keep in mind that any stock that was sold can be bought again if strength returns. The recent rebound above the 50-day moving average (DMA) line ($121.88) helped its outlook improve after it found support at its 200 DMA line. However, its Relative Strength rating is 76, still below the 80+ minimum guideline for buy candidates.
LOGM was highlighted in yellow with pivot point cited based on its 10/27/17 high plus 10 cents in the 2/15/18 mid-day report (read here). A strong gain on the prior session triggered a technical buy signal. The Computer Software - Enterprise firm reported Dec '17 earnings +94% on +214% sales revenues versus the year ago period, and prior quarters have been above the +25% minimum guideline (C criteria). Annual earnings (A criteria) history has been strong after a downturn in FY '13).
The number of top-rated funds owning its shares rose from 754 in Jun '17 to 771 in Dec '17, a reassuring sign concerning the I criteria. Its current Up/Down Volume Ratio of 1.3 is an unbiased indication its shares have been under accumulation over the past 50 days. It has earned a Timeliness Rating of A and Sponsorship Rating of B.
|
|
|
Color Codes Explained :
Y - Better candidates highlighted by our
staff of experts.
G - Previously featured
in past reports as yellow but may no longer be buyable under the
guidelines.
***Last / Change / Volume data in this table is the closing quote data***
Symbol/Exchange
Company Name
Industry Group |
PRICE |
CHANGE
(%Change) |
Day High |
Volume
(% DAV)
(% 50 day avg vol) |
52 Wk Hi
% From Hi |
Featured
Date |
Price
Featured |
Pivot Featured |
|
Max Buy |
SIVB
-
NASDAQ
S V B Financial Group
BANKING - Regional - Pacific Banks
|
$259.53
|
-2.66
-1.01% |
$263.35
|
590,556
137.34% of 50 DAV
50 DAV is 430,000
|
$271.79
-4.51%
|
3/12/2018
|
$267.79
|
PP = $263.19
|
|
MB = $276.35
|
Most Recent Note - 3/12/2018 5:48:27 PM
Y - Endured distributional pressure today as it suffered a loss with above average volume after highlighted in yellow with pivot point cited based on its 1/24/18 high plus 10 cents in the mid-day report. Wedged to new 52-week highs with recent gains lacking great volume conviction after a short flat base. Gains above a stock's pivot point must have at least +40% above average volume to trigger a proper technical buy signal. Reported earnings +53% on +32% sales revenues for the Dec '17 quarter, marking its 4th consecutive comparison above the +25% minimum guideline (C criteria), helping it better match the fact-based investment system's guidelines. See the latest FSU analysis for more details and a new annotated graph.
>>> FEATURED STOCK ARTICLE : Endured Distributional Pressure After Wedging Higher - 3/12/2018 |
View all notes |
Set NEW NOTE alert |
Company Profile |
SEC
News |
Chart |
Request a new note
C
A
S
I |
TPL
-
NYSE
Texas Pacific Land Trust
FINANCIAL SERVICES - Diversified Investments
|
$516.62
|
+1.59
0.31% |
$526.56
|
9,061
50.34% of 50 DAV
50 DAV is 18,000
|
$569.99
-9.36%
|
2/20/2018
|
$517.00
|
PP = $569.99
|
|
MB = $598.49
|
Most Recent Note - 3/12/2018 6:09:26 PM
Y - Volume totals have been cooling while consolidating in an orderly fashion above its 50 DMA line ($512.84). Reported earnings +29% on +118% sales revenues for the Dec '17 quarter.
>>> FEATURED STOCK ARTICLE : Finding Support Above 50-Day Moving Average Line - 2/22/2018 |
View all notes |
Set NEW NOTE alert |
Company Profile |
SEC
News |
Chart |
Request a new note
C
A
S
I |
YY
-
NASDAQ
YY Inc
INTERNET - Internet Service Providers
|
$115.88
|
-2.30
-1.95% |
$118.43
|
2,195,438
138.16% of 50 DAV
50 DAV is 1,589,000
|
$142.97
-18.95%
|
12/29/2017
|
$113.06
|
PP = $123.58
|
|
MB = $129.76
|
 Most Recent Note - 3/14/2018 10:26:47 AM
G - Sputtering further below its 50 DMA line ($128.24). Prior low ($109.06 on 2/09/18) defines the next important support where a violation may trigger a more worrisome sell signal. Faces resistance due to overhead supply up to the $142 level. Reported earnings +55% on +56% sales revenues for the Dec '17 quarter, continuing its strong earnings track record.
>>> FEATURED STOCK ARTICLE : Earnings News Due Next Week for Chinese Social Platform - 2/27/2018 |
View all notes |
Set NEW NOTE alert |
Company Profile |
SEC
News |
Chart |
Request a new note
C
A
S
I |
LOGM
-
NASDAQ
Logmein Inc
INTERNET - Internet Software andamp; Services
|
$127.15
|
-0.35
-0.27% |
$128.95
|
307,327
53.29% of 50 DAV
50 DAV is 576,700
|
$134.80
-5.68%
|
2/15/2018
|
$132.35
|
PP = $129.61
|
|
MB = $136.09
|
Most Recent Note - 3/14/2018 5:15:32 PM
Y - Recent rebound above the 50 DMA line ($121.88) helped its outlook improve after it found support at its 200 DMA line. However, its Relative Strength rating is 76, still below the 80+ minimum guideline for buy candidates. See the latest FSU analysis for more details and a new annotated graph.
>>> FEATURED STOCK ARTICLE : Technical Breakout Came Ahead of Earnings News - 2/15/2018 |
View all notes |
Set NEW NOTE alert |
Company Profile |
SEC
News |
Chart |
Request a new note
C
A
S
I |
HTHT
-
NASDAQ
China Lodging Group Ads
LEISURE - Lodging
|
$132.12
|
-15.23
-10.34% |
$134.20
|
3,402,281
646.82% of 50 DAV
50 DAV is 526,000
|
$166.19
-20.50%
|
12/22/2017
|
$138.07
|
PP = $142.90
|
|
MB = $150.05
|
Most Recent Note - 3/14/2018 9:54:20 AM
G - Reported earnings +86% on +42% sales revenues for the Dec '17 quarter after closing below its 50 DMA line ($150.20) on the prior session. Gapped down today undercutting the recent low ($141.01 on 3/02/18) triggering a technical sell signal.
>>> FEATURED STOCK ARTICLE : Repaired Recent Technical Damage But Has Not Formed a New Base - 2/23/2018 |
View all notes |
Set NEW NOTE alert |
Company Profile |
SEC
News |
Chart |
Request a new note
C
A
S
I |
Symbol/Exchange
Company Name
Industry Group |
PRICE |
CHANGE
(%Change) |
Day High |
Volume
(% DAV)
(% 50 day avg vol) |
52 Wk Hi
% From Hi |
Featured
Date |
Price
Featured |
Pivot Featured |
|
Max Buy |
PETS
-
NASDAQ
Petmed Express Inc
RETAIL - Drug Stores
|
$46.49
|
-0.26
-0.56% |
$47.09
|
289,110
41.96% of 50 DAV
50 DAV is 689,000
|
$57.80
-19.57%
|
1/19/2018
|
$53.59
|
PP = $51.00
|
|
MB = $53.55
|
Most Recent Note - 3/14/2018 10:23:33 AM
G - Quietly consolidating near its 50 DMA line ($46.80). Faces near-term resistance due to overhead supply up to the $57 level. Recently reported earnings +83% on +14% sales revenues, continuing its strong earnings track record.
>>> FEATURED STOCK ARTICLE : Sputtering Below 50-Day Average After Negative Reversal - 2/14/2018 |
View all notes |
Set NEW NOTE alert |
Company Profile |
SEC
News |
Chart |
Request a new note
C
A
S
I |
DPZ
-
NYSE
Dominos Pizza Inc
WHOLESALE - Food Wholesale
|
$226.66
|
+0.81
0.36% |
$228.39
|
394,197
35.13% of 50 DAV
50 DAV is 1,122,000
|
$236.00
-3.96%
|
2/20/2018
|
$224.86
|
PP = $222.01
|
|
MB = $233.11
|
Most Recent Note - 3/12/2018 5:51:33 PM
Y - After poised for a best-ever close it reversed and closed lower today with higher (below average) volume. Tallied big gains then stalled after highlighted in the 2/20/18 mid-day report with pivot point cited based on its 1/25/18 high plus 10 cents.
>>> FEATURED STOCK ARTICLE : Popular Pizza Firm Met Resistance Near Prior High - 2/20/2018 |
View all notes |
Set NEW NOTE alert |
Company Profile |
SEC
News |
Chart |
Request a new note
C
A
S
I |
FIVE
-
NASDAQ
Five Below Inc
Retail-DiscountandVariety
|
$68.36
|
+0.11
0.16% |
$69.40
|
620,259
59.41% of 50 DAV
50 DAV is 1,044,000
|
$73.55
-7.06%
|
3/9/2018
|
$68.58
|
PP = $73.65
|
|
MB = $77.33
|
Most Recent Note - 3/9/2018 5:46:05 PM
Y - New pivot point is cited based on its 1/05/18 high plus 10 cents. Subsequent volume-driven gains above the pivot point may trigger a new (or add-on) technical buy signal. Consolidating above its 50 DMA line ($66.81). The recent low ($60.00 on 2/06/18) defines important near-term support to watch on pullbacks. See the latest FSU analysis for more details and a new annotated graph.
>>> FEATURED STOCK ARTICLE : Retailer Rebounding Within Striking Distance of Prior High - 3/9/2018 |
View all notes |
Set NEW NOTE alert |
Company Profile |
SEC
News |
Chart |
Request a new note
C
A
S
I |
SPLK
-
NASDAQ
Splunk Inc
Computer Sftwr-Database
|
$108.67
|
+2.24
2.10% |
$109.88
|
2,113,295
116.31% of 50 DAV
50 DAV is 1,817,000
|
$109.76
-0.99%
|
2/15/2018
|
$96.06
|
PP = $93.68
|
|
MB = $98.36
|
Most Recent Note - 3/14/2018 10:07:50 AM
G - Hovering near its new all-time high, extended from any sound base. Disciplined investors avoid chasing extended stocks. Its 50 DMA line and prior highs define support to watch on pullbacks. Bullish action came after it reported earnings +76% on +37% sales revenues for the quarter ended January 31, 2018 versus the year ago period.
>>> FEATURED STOCK ARTICLE : Pulled Back to 10-Week Moving Average After Technical Breakout - 2/16/2018 |
View all notes |
Set NEW NOTE alert |
Company Profile |
SEC
News |
Chart |
Request a new note
C
A
S
I |
PAYC
-
NYSE
Paycom Software Inc
COMPUTER SOFTWARE and SERVICES - Application Software
|
$111.25
|
+1.73
1.58% |
$112.21
|
374,793
49.91% of 50 DAV
50 DAV is 751,000
|
$111.42
-0.15%
|
2/15/2018
|
$95.01
|
PP = $93.61
|
|
MB = $98.29
|
Most Recent Note - 3/14/2018 10:09:23 AM
G - Stubbornly holding its ground at its all-time high, very extended from any sound base. Prior highs in the $93 area define initial support above its 50 DMA line ($93.04). Fundamentals remain strong.
>>> FEATURED STOCK ARTICLE : Extended From Prior Base After Streak of Gains - 3/7/2018 |
View all notes |
Set NEW NOTE alert |
Company Profile |
SEC
News |
Chart |
Request a new note
C
A
S
I |
Symbol/Exchange
Company Name
Industry Group |
PRICE |
CHANGE
(%Change) |
Day High |
Volume
(% DAV)
(% 50 day avg vol) |
52 Wk Hi
% From Hi |
Featured
Date |
Price
Featured |
Pivot Featured |
|
Max Buy |
GRUB
-
NYSE
Grubhub Inc
COMPUTER SOFTWARE and SERVICES - Technical and System Software
|
$110.78
|
+1.53
1.40% |
$111.15
|
1,530,159
82.00% of 50 DAV
50 DAV is 1,866,000
|
$112.41
-1.45%
|
6/21/2017
|
$47.33
|
PP = $46.94
|
|
MB = $49.29
|
Most Recent Note - 3/12/2018 6:10:30 PM
G - Hit another new all-time high today, getting very extended from any sound base. Well above its 50 DMA line and prior highs defining near-term support. Recently reported earnings +61% on +49% sales revenues for the Dec '17 quarter.
>>> FEATURED STOCK ARTICLE : Bullish Action Followed Last Earnings Report - 3/1/2018 |
View all notes |
Set NEW NOTE alert |
Company Profile |
SEC
News |
Chart |
Request a new note
C
A
S
I |
HQY
-
NASDAQ
Healthequity Inc
COMPUTER SOFTWARE and SERVICES - Healthcare Information Service
|
$59.98
|
+1.11
1.89% |
$60.00
|
456,964
76.16% of 50 DAV
50 DAV is 600,000
|
$59.99
-0.02%
|
2/20/2018
|
$56.37
|
PP = $55.41
|
|
MB = $58.18
|
Most Recent Note - 3/12/2018 5:58:20 PM
G - Color code is changed to green. Pulled back today after wedging into new high territory last week with gains lacking great volume conviction. Fundamentals remain strong.
>>> FEATURED STOCK ARTICLE : Fundamentals Remained Favorable and Strength Returned - 2/21/2018 |
View all notes |
Set NEW NOTE alert |
Company Profile |
SEC
News |
Chart |
Request a new note
C
A
S
I |
PYPL
-
NASDAQ
Paypal Holdings Inc
Finance-CrdtCard/PmtPr
|
$83.31
|
+3.11
3.88% |
$83.50
|
13,698,572
137.90% of 50 DAV
50 DAV is 9,934,000
|
$86.32
-3.49%
|
2/1/2018
|
$80.35
|
PP = $79.49
|
|
MB = $83.46
|
Most Recent Note - 3/14/2018 12:29:39 PM
G - Gapped up, rising considerably today after quietly consolidating above its 50 DMA line ($79.36). Subsequent losses below the 50 DMA line and recent low ($71.63 on 2/09/18) would raise concerns and trigger a more worrisome technical sell signals. Fundamentals remain strong.
>>> FEATURED STOCK ARTICLE : Quietly Consolidating Back Above 50-Day Moving Average - 2/26/2018 |
View all notes |
Set NEW NOTE alert |
Company Profile |
SEC
News |
Chart |
Request a new note
C
A
S
I |
OLLI
-
NASDAQ
Ollie's Bargain Outlet
Retail-DiscountandVariety
|
$58.80
|
-0.70
-1.18% |
$60.20
|
412,110
75.90% of 50 DAV
50 DAV is 543,000
|
$62.05
-5.24%
|
11/21/2017
|
$46.78
|
PP = $47.00
|
|
MB = $49.35
|
Most Recent Note - 3/13/2018 6:48:50 PM
G - Perched near its all-time high, extended from any sound base. Support is defined by its 50 DMA line ($56.22) and prior low ($50.15 on 1/04/18). See the latest FSU analysis for more details and a new annotated graph.
>>> FEATURED STOCK ARTICLE : Bargain Outlet's Shares Perched Near All-Time Price High - 3/13/2018 |
View all notes |
Set NEW NOTE alert |
Company Profile |
SEC
News |
Chart |
Request a new note
C
A
S
I |
WB
-
NASDAQ
Weibo Corp Cl A Ads
INTERNET - Content
|
$131.49
|
+0.36
0.27% |
$133.55
|
942,863
47.96% of 50 DAV
50 DAV is 1,966,000
|
$142.12
-7.48%
|
1/16/2018
|
$126.33
|
PP = $122.21
|
|
MB = $128.32
|
Most Recent Note - 3/12/2018 6:05:28 PM
G - Down today with above average volume, slumping toward its 50 DMA line ($126.64) which recently acted as support. It is extended from any sound base. Recently reported earnings +88% on +77% sales revenues for the Dec '17 quarter, continuing its strong earnings track record.
>>> FEATURED STOCK ARTICLE : Recent Consolidation is Not a New Base of Sufficient Length - 3/8/2018 |
View all notes |
Set NEW NOTE alert |
Company Profile |
SEC
News |
Chart |
Request a new note
C
A
S
I |
Symbol/Exchange
Company Name
Industry Group |
PRICE |
CHANGE
(%Change) |
Day High |
Volume
(% DAV)
(% 50 day avg vol) |
52 Wk Hi
% From Hi |
Featured
Date |
Price
Featured |
Pivot Featured |
|
Max Buy |
HLI
-
NYSE
Houlihan Lokey Inc Cl A
Finance-Invest Bnk/Bkrs
|
$47.89
|
+0.45
0.95% |
$48.07
|
416,676
145.18% of 50 DAV
50 DAV is 287,000
|
$52.81
-9.32%
|
1/3/2018
|
$45.88
|
PP = $47.09
|
|
MB = $49.44
|
Most Recent Note - 3/13/2018 12:33:32 PM
G - Priced a new Public Offering and gapped down today for a volume-driven loss undercutting its 50 DMA line ($47.61) and raising concerns. The recent low ($43.73 on 2/06/18) defines near term support where a violation would raise greater concerns. Earnings +21% for the Dec '17 quarter were below the +25% minimum earnings guideline (C criteria).
>>> FEATURED STOCK ARTICLE : Recently Met Resistance at 50-Day Moving Average - 2/28/2018 |
View all notes |
Set NEW NOTE alert |
Company Profile |
SEC
News |
Chart |
Request a new note
C
A
S
I |
SQ
-
NYSE
Square Inc Cl A
Finance-CrdtCard/PmtPr
|
$54.61
|
+2.78
5.36% |
$54.84
|
21,836,112
139.25% of 50 DAV
50 DAV is 15,681,000
|
$53.79
1.52%
|
3/5/2018
|
$49.70
|
PP = $49.66
|
|
MB = $52.14
|
Most Recent Note - 3/14/2018 12:33:38 PM
G - Gapped up today, technically, getting more extended from the prior base while rallying well above its "max buy" level with a big gain backed by higher volume. Prior highs in the $49-47 area define initial support to watch on pullbacks. Fundamentals remain strong.
>>> FEATURED STOCK ARTICLE : New High & Considerable Gain Backed By Twice Average Volume - 3/5/2018 |
View all notes |
Set NEW NOTE alert |
Company Profile |
SEC
News |
Chart |
Request a new note
C
A
S
I |
SEND
-
NYSE
Sendgrid Inc
INTERNET - Content
|
$31.11
|
+0.63
2.07% |
$31.23
|
371,223
158.64% of 50 DAV
50 DAV is 234,000
|
$32.03
-2.86%
|
3/6/2018
|
$28.00
|
PP = $28.37
|
|
MB = $29.79
|
Most Recent Note - 3/12/2018 6:07:31 PM
G - Reversed into the red for a loss today on higher volume, breaking a streak of 5 consecutive gains. Prior highs in the $27-28 area define initial support to watch on pullbacks.
>>> FEATURED STOCK ARTICLE : Recently Profitable Internet - Content Firm Rallied to New High - 3/6/2018 |
View all notes |
Set NEW NOTE alert |
Company Profile |
SEC
News |
Chart |
Request a new note
C
A
S
I |
|
|
|
THESE ARE NOT BUY RECOMMENDATIONS!
Comments contained in the body of this report are technical
opinions only. The material herein has been obtained
from sources believed to be reliable and accurate, however,
its accuracy and completeness cannot be guaranteed.
This site is not an investment advisor, hence it does
not endorse or recommend any securities or other investments.
Any recommendation contained in this report may not
be suitable for all investors and it is not to be deemed
an offer or solicitation on our part with respect to
the purchase or sale of any securities. All trademarks,
service marks and trade names appearing in this report
are the property of their respective owners, and are
likewise used for identification purposes only.
This report is a service available
only to active Paid Premium Members.
You may opt-out of receiving report notifications
at any time. Questions or comments may be submitted
by writing to Premium Membership Services 665 S.E. 10 Street, Suite 201 Deerfield Beach, FL 33441-5634 or by calling 1-800-965-8307
or 954-785-1121.
|
|
|


