***Last / Change / Volume data in this table is the closing quote data***
Symbol/Exchange
Company Name
Industry Group |
PRICE |
CHANGE
(%Change) |
Day High |
Volume
(% DAV)
(% 50 day avg vol) |
52 Wk Hi
% From Hi |
Featured
Date |
Price
Featured |
Pivot Featured |
|
Max Buy |
SIVB
-
NASDAQ
S V B Financial Group
BANKING - Regional - Pacific Banks
|
$264.59
|
+4.00
1.53% |
$265.16
|
576,470
88.28% of 50 DAV
50 DAV is 653,000
|
$271.79
-2.65%
|
3/12/2018
|
$267.79
|
PP = $263.19
|
|
MB = $276.35
|
Most Recent Note - 3/16/2018 4:40:00 PM
Y - Tallied a volume-driven gain today helping clinch a technical buy signal. Reported earnings +53% on +32% sales revenues for the Dec '17 quarter, marking its 4th consecutive comparison above the +25% minimum guideline (C criteria), helping it better match the fact-based investment system's guidelines.
>>> FEATURED STOCK ARTICLE : Endured Distributional Pressure After Wedging Higher - 3/12/2018 |
View all notes |
Set NEW NOTE alert |
Company Profile |
SEC
News |
Chart |
Request a new note
C
A
S
I |
TPL
-
NYSE
Texas Pacific Land Trust
FINANCIAL SERVICES - Diversified Investments
|
$518.88
|
+3.88
0.75% |
$522.50
|
22,292
131.13% of 50 DAV
50 DAV is 17,000
|
$569.99
-8.97%
|
2/20/2018
|
$517.00
|
PP = $569.99
|
|
MB = $598.49
|
Most Recent Note - 3/19/2018 6:05:57 PM
G - Color code is changed to green after slumping and closing below its 50 DMA line ($519.72). A prompt rebound above the 50 DMA line is needed for its outlook to improve. The prior low ($480 on 2/09/18) is the next important support level. Reported earnings +29% on +118% sales revenues for the Dec '17 quarter.
>>> FEATURED STOCK ARTICLE : Finding Support Above 50-Day Moving Average Line - 2/22/2018 |
View all notes |
Set NEW NOTE alert |
Company Profile |
SEC
News |
Chart |
Request a new note
C
A
S
I |
YY
-
NASDAQ
YY Inc
INTERNET - Internet Service Providers
|
$127.43
|
+8.68
7.31% |
$127.77
|
2,443,232
148.62% of 50 DAV
50 DAV is 1,644,000
|
$142.97
-10.87%
|
12/29/2017
|
$113.06
|
PP = $123.58
|
|
MB = $129.76
|
 Most Recent Note - 3/20/2018 12:57:05 PM
G - Faces resistance due to overhead supply up to the $142 level. Still sputtering below its 50 DMA line ($127.96) which is now downward sloping. Found support above the prior low ($109.06 on 2/09/18) which defines the next important support to watch. Reported earnings +55% on +56% sales revenues for the Dec '17 quarter, continuing its strong earnings track record.
>>> FEATURED STOCK ARTICLE : Earnings News Due Next Week for Chinese Social Platform - 2/27/2018 |
View all notes |
Set NEW NOTE alert |
Company Profile |
SEC
News |
Chart |
Request a new note
C
A
S
I |
LOGM
-
NASDAQ
Logmein Inc
INTERNET - Internet Software andamp; Services
|
$125.75
|
+1.40
1.13% |
$126.60
|
366,185
63.93% of 50 DAV
50 DAV is 572,800
|
$134.80
-6.71%
|
2/15/2018
|
$132.35
|
PP = $129.61
|
|
MB = $136.09
|
Most Recent Note - 3/20/2018 6:44:39 PM
Y - Consolidating above the 50 DMA line ($122.55) after it recently found support at its 200 DMA line. Its Relative Strength rating is 79, just below the 80+ minimum guideline for buy candidates.
>>> FEATURED STOCK ARTICLE : Rebounding After Finding Support at 200-Day Average - 3/14/2018 |
View all notes |
Set NEW NOTE alert |
Company Profile |
SEC
News |
Chart |
Request a new note
C
A
S
I |
HTHT
-
NASDAQ
China Lodging Group Ads
LEISURE - Lodging
|
$132.15
|
+0.68
0.52% |
$132.50
|
692,867
121.98% of 50 DAV
50 DAV is 568,000
|
$166.19
-20.48%
|
12/22/2017
|
$138.07
|
PP = $142.90
|
|
MB = $150.05
|
Most Recent Note - 3/15/2018 6:17:20 PM
G - Posted a gain today, finding support near its February low ($128.60). Gapped down on the prior session triggering a technical sell signal. A rebound above the 50 DMA line is needed for its outlook to improve. Reported earnings +86% on +42% sales revenues for the Dec '17 quarter.
>>> FEATURED STOCK ARTICLE : Repaired Recent Technical Damage But Has Not Formed a New Base - 2/23/2018 |
View all notes |
Set NEW NOTE alert |
Company Profile |
SEC
News |
Chart |
Request a new note
C
A
S
I |
Symbol/Exchange
Company Name
Industry Group |
PRICE |
CHANGE
(%Change) |
Day High |
Volume
(% DAV)
(% 50 day avg vol) |
52 Wk Hi
% From Hi |
Featured
Date |
Price
Featured |
Pivot Featured |
|
Max Buy |
LMAT
-
NASDAQ
Lemaitre Vascular Inc
Medical-Products
|
$36.90
|
+0.33
0.90% |
$37.20
|
197,640
154.41% of 50 DAV
50 DAV is 128,000
|
$39.88
-7.47%
|
3/19/2018
|
$36.77
|
PP = $39.98
|
|
MB = $41.98
|
Most Recent Note - 3/19/2018 6:09:12 PM
Y - Highlighted in yellow with new pivot point cited based on its 10/20/17 high plus 10 cents in the earlier mid-day report. Subsequent volume-driven gains for new highs are needed to trigger a technical buy signal. Fundamentals remain strong, as it reported +62% earnings on +12% sales revenues for the Dec '17 quarter. Recently consolidating above its 50 and 200 DMA lines. It was dropped from the Featured Stocks list on 12/04/17. See the latest FSU analysis for more details and a new annotated graph.
>>> FEATURED STOCK ARTICLE : Rebounding Near High After Choppy Consolidation - 3/19/2018 |
View all notes |
Set NEW NOTE alert |
Company Profile |
SEC
News |
Chart |
Request a new note
C
A
S
I |
PETS
-
NASDAQ
Petmed Express Inc
RETAIL - Drug Stores
|
$44.32
|
+1.17
2.71% |
$44.68
|
511,886
73.55% of 50 DAV
50 DAV is 696,000
|
$57.80
-23.32%
|
1/19/2018
|
$53.59
|
PP = $51.00
|
|
MB = $53.55
|
Most Recent Note - 3/20/2018 6:46:34 PM
G - Found support at its 200 DMA line. A rebound above the 50 DMA line ($46.54) is needed for its outlook to improve. Faces near-term resistance due to overhead supply up to the $57 level. Recently reported earnings +83% on +14% sales revenues, continuing its strong earnings track record.
>>> FEATURED STOCK ARTICLE : Recently Endured Distributional Pressure - 3/15/2018 |
View all notes |
Set NEW NOTE alert |
Company Profile |
SEC
News |
Chart |
Request a new note
C
A
S
I |
DPZ
-
NYSE
Dominos Pizza Inc
WHOLESALE - Food Wholesale
|
$231.59
|
+3.92
1.72% |
$232.88
|
574,168
52.48% of 50 DAV
50 DAV is 1,094,000
|
$236.00
-1.87%
|
2/20/2018
|
$224.86
|
PP = $222.01
|
|
MB = $233.11
|
Most Recent Note - 3/19/2018 5:58:49 PM
Y - Volume totals have been cooling while hovering near its high. Stalled soon after highlighted in the 2/20/18 mid-day report with pivot point cited based on its 1/25/18 high plus 10 cents.
>>> FEATURED STOCK ARTICLE : Popular Pizza Firm Met Resistance Near Prior High - 2/20/2018 |
View all notes |
Set NEW NOTE alert |
Company Profile |
SEC
News |
Chart |
Request a new note
C
A
S
I |
FIVE
-
NASDAQ
Five Below Inc
Retail-DiscountandVariety
|
$68.98
|
-0.07
-0.10% |
$69.20
|
1,585,012
155.55% of 50 DAV
50 DAV is 1,019,000
|
$73.55
-6.21%
|
3/9/2018
|
$68.58
|
PP = $73.65
|
|
MB = $77.33
|
Most Recent Note - 3/15/2018 1:46:34 PM
Y - New pivot point was cited based on its 1/05/18 high plus 10 cents. Subsequent volume-driven gains above the pivot point may trigger a new (or add-on) technical buy signal. Consolidating above its 50 DMA line ($66.84). The recent low ($60.00 on 2/06/18) defines important near-term support to watch on pullbacks.
>>> FEATURED STOCK ARTICLE : Retailer Rebounding Within Striking Distance of Prior High - 3/9/2018 |
View all notes |
Set NEW NOTE alert |
Company Profile |
SEC
News |
Chart |
Request a new note
C
A
S
I |
SPLK
-
NASDAQ
Splunk Inc
Computer Sftwr-Database
|
$110.01
|
+3.18
2.98% |
$110.07
|
2,394,640
130.85% of 50 DAV
50 DAV is 1,830,000
|
$109.88
0.12%
|
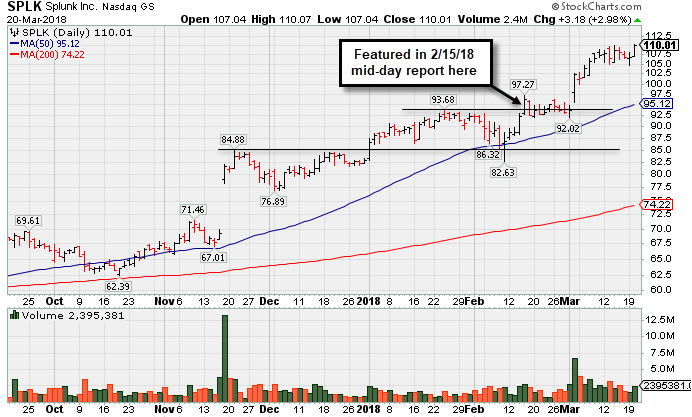
2/15/2018
|
$96.06
|
PP = $93.68
|
|
MB = $98.36
|
Most Recent Note - 3/20/2018 6:38:22 PM
G - Posted a solid volume-driven gain for a new all-time high. Disciplined investors avoid chasing extended stocks. Its 50 DMA line and prior highs define support to watch on pullbacks. See the latest FSU analysis for more details and a new annotated graph.
>>> FEATURED STOCK ARTICLE : Extended After Rallying from Secondary Buy Point - 3/20/2018 |
View all notes |
Set NEW NOTE alert |
Company Profile |
SEC
News |
Chart |
Request a new note
C
A
S
I |
Symbol/Exchange
Company Name
Industry Group |
PRICE |
CHANGE
(%Change) |
Day High |
Volume
(% DAV)
(% 50 day avg vol) |
52 Wk Hi
% From Hi |
Featured
Date |
Price
Featured |
Pivot Featured |
|
Max Buy |
PAYC
-
NYSE
Paycom Software Inc
COMPUTER SOFTWARE and SERVICES - Application Software
|
$111.10
|
+3.06
2.83% |
$111.67
|
396,695
51.79% of 50 DAV
50 DAV is 766,000
|
$112.21
-0.98%
|
2/15/2018
|
$95.01
|
PP = $93.61
|
|
MB = $98.29
|
Most Recent Note - 3/20/2018 6:42:41 PM
G - Perched near its all-time high, very extended from any sound base. Prior highs in the $93 area define initial support above its 50 DMA line ($95.27). Fundamentals remain strong.
>>> FEATURED STOCK ARTICLE : Extended From Prior Base After Streak of Gains - 3/7/2018 |
View all notes |
Set NEW NOTE alert |
Company Profile |
SEC
News |
Chart |
Request a new note
C
A
S
I |
GRUB
-
NYSE
Grubhub Inc
COMPUTER SOFTWARE and SERVICES - Technical and System Software
|
$110.48
|
+1.66
1.53% |
$111.86
|
1,448,912
75.86% of 50 DAV
50 DAV is 1,910,000
|
$112.41
-1.72%
|
6/21/2017
|
$47.33
|
PP = $46.94
|
|
MB = $49.29
|
Most Recent Note - 3/19/2018 6:00:24 PM
G - Pulling back from its all-time high, very extended from any sound base. Well above its 50 DMA line and prior highs defining near-term support. Recently reported earnings +61% on +49% sales revenues for the Dec '17 quarter.
>>> FEATURED STOCK ARTICLE : Bullish Action Followed Last Earnings Report - 3/1/2018 |
View all notes |
Set NEW NOTE alert |
Company Profile |
SEC
News |
Chart |
Request a new note
C
A
S
I |
HQY
-
NASDAQ
Healthequity Inc
COMPUTER SOFTWARE and SERVICES - Healthcare Information Service
|
$64.54
|
+6.64
11.47% |
$65.00
|
2,889,583
469.09% of 50 DAV
50 DAV is 616,000
|
$60.00
7.57%
|
2/20/2018
|
$56.37
|
PP = $55.41
|
|
MB = $58.18
|
Most Recent Note - 3/20/2018 12:36:10 PM
G - Reported earnings +57% on +29% sales revenues for the Jan '18 quarter versus the year ago period. Color code was changed to green after gapping up and quickly rallying to new all-time highs well above its "max buy" level.
>>> FEATURED STOCK ARTICLE : Fundamentals Remained Favorable and Strength Returned - 2/21/2018 |
View all notes |
Set NEW NOTE alert |
Company Profile |
SEC
News |
Chart |
Request a new note
C
A
S
I |
LOB
-
NASDAQ
Live Oak Bancshares Inc
Banks-Southeast
|
$29.30
|
+0.55
1.91% |
$29.40
|
164,807
120.30% of 50 DAV
50 DAV is 137,000
|
$29.00
1.03%
|
3/16/2018
|
$28.63
|
PP = $28.30
|
|
MB = $29.72
|
Most Recent Note - 3/20/2018 6:49:07 PM
Y - Hit another new all-time high with today's 4th consecutive gain. Rallied above the pivot point cited based on its 1/25/18 high plus 10 cents when highlighted in yellow in the 3/16/18 mid-day report (read here). The gain and close above the pivot point was backed by +393% above average volume as it triggered a technical buy signal. Reported very strong sales revenues and earnings increases for the Sep and Dec '17 quarters. Completed a new Public Offering on 8/09/17. Prior quarterly and annual earnings (C and A criteria) history is a good match with the fact-based investment system's guidelines. See the latest FSU analysis for more details and an annotated graph.
>>> FEATURED STOCK ARTICLE : Tallied Volume-Driven Gain for New High - 3/16/2018 |
View all notes |
Set NEW NOTE alert |
Company Profile |
SEC
News |
Chart |
Request a new note
C
A
S
I |
PYPL
-
NASDAQ
Paypal Holdings Inc
Finance-CrdtCard/PmtPr
|
$80.86
|
+0.56
0.70% |
$81.19
|
7,276,046
71.64% of 50 DAV
50 DAV is 10,157,000
|
$86.32
-6.33%
|
2/1/2018
|
$80.35
|
PP = $79.49
|
|
MB = $83.46
|
Most Recent Note - 3/15/2018 1:00:47 PM
G - Gapped up on the prior session, rising considerably with above average volume after quietly consolidating above its 50 DMA line ($79.58). Subsequent losses below the 50 DMA line and recent low ($71.63 on 2/09/18) would raise concerns and trigger a more worrisome technical sell signals. Fundamentals remain strong.
>>> FEATURED STOCK ARTICLE : Quietly Consolidating Back Above 50-Day Moving Average - 2/26/2018 |
View all notes |
Set NEW NOTE alert |
Company Profile |
SEC
News |
Chart |
Request a new note
C
A
S
I |
Symbol/Exchange
Company Name
Industry Group |
PRICE |
CHANGE
(%Change) |
Day High |
Volume
(% DAV)
(% 50 day avg vol) |
52 Wk Hi
% From Hi |
Featured
Date |
Price
Featured |
Pivot Featured |
|
Max Buy |
OLLI
-
NASDAQ
Ollie's Bargain Outlet
Retail-DiscountandVariety
|
$59.85
|
-0.05
-0.08% |
$60.50
|
391,820
73.65% of 50 DAV
50 DAV is 532,000
|
$62.05
-3.55%
|
11/21/2017
|
$46.78
|
PP = $47.00
|
|
MB = $49.35
|
Most Recent Note - 3/19/2018 6:07:53 PM
G - Perched near its all-time high, extended from any sound base. Support is defined by its 50 DMA line ($56.81) and prior low ($50.15 on 1/04/18).
>>> FEATURED STOCK ARTICLE : Bargain Outlet's Shares Perched Near All-Time Price High - 3/13/2018 |
View all notes |
Set NEW NOTE alert |
Company Profile |
SEC
News |
Chart |
Request a new note
C
A
S
I |
WB
-
NASDAQ
Weibo Corp Cl A Ads
INTERNET - Content
|
$135.94
|
+2.38
1.78% |
$138.72
|
2,099,610
108.62% of 50 DAV
50 DAV is 1,933,000
|
$142.12
-4.35%
|
1/16/2018
|
$126.33
|
PP = $122.21
|
|
MB = $128.32
|
Most Recent Note - 3/19/2018 6:07:04 PM
G - Consolidating above its 50 DMA line ($128.85) which recently acted as support. Recently reported earnings +88% on +77% sales revenues for the Dec '17 quarter, continuing its strong earnings track record.
>>> FEATURED STOCK ARTICLE : Recent Consolidation is Not a New Base of Sufficient Length - 3/8/2018 |
View all notes |
Set NEW NOTE alert |
Company Profile |
SEC
News |
Chart |
Request a new note
C
A
S
I |
HLI
-
NYSE
Houlihan Lokey Inc Cl A
Finance-Invest Bnk/Bkrs
|
$47.53
|
+0.07
0.15% |
$47.78
|
253,750
83.47% of 50 DAV
50 DAV is 304,000
|
$52.81
-10.00%
|
1/3/2018
|
$45.88
|
PP = $47.09
|
|
MB = $49.44
|
Most Recent Note - 3/19/2018 6:01:14 PM
G - Priced a new Public Offering and gapped down on 3/12/18 for a volume-driven loss undercutting its 50 DMA line ($47.76) and raising concerns. The recent low ($43.73 on 2/06/18) defines near term support where a violation would raise greater concerns. Earnings +21% for the Dec '17 quarter were below the +25% minimum earnings guideline (C criteria).
>>> FEATURED STOCK ARTICLE : Recently Met Resistance at 50-Day Moving Average - 2/28/2018 |
View all notes |
Set NEW NOTE alert |
Company Profile |
SEC
News |
Chart |
Request a new note
C
A
S
I |
SQ
-
NYSE
Square Inc Cl A
Finance-CrdtCard/PmtPr
|
$57.69
|
+3.11
5.70% |
$58.07
|
17,179,439
108.30% of 50 DAV
50 DAV is 15,863,000
|
$55.89
3.23%
|
3/5/2018
|
$49.70
|
PP = $49.66
|
|
MB = $52.14
|
Most Recent Note - 3/20/2018 6:40:35 PM
G - Powered to another new high today, getting very extended from the prior base. Prior highs in the $49-47 area define initial support to watch on pullbacks. Fundamentals remain strong.
>>> FEATURED STOCK ARTICLE : New High & Considerable Gain Backed By Twice Average Volume - 3/5/2018 |
View all notes |
Set NEW NOTE alert |
Company Profile |
SEC
News |
Chart |
Request a new note
C
A
S
I |
SEND
-
NYSE
Sendgrid Inc
INTERNET - Content
|
$30.39
|
+0.45
1.50% |
$30.59
|
247,314
108.95% of 50 DAV
50 DAV is 227,000
|
$32.03
-5.11%
|
3/6/2018
|
$28.00
|
PP = $28.37
|
|
MB = $29.79
|
Most Recent Note - 3/16/2018 4:53:27 PM
G - Churned above average volume the past 3 sessions without making progress, action indicative of distributional pressure. It is extended from the previously noted base. Prior highs in the $27-28 area define initial support to watch on pullbacks.
>>> FEATURED STOCK ARTICLE : Recently Profitable Internet - Content Firm Rallied to New High - 3/6/2018 |
View all notes |
Set NEW NOTE alert |
Company Profile |
SEC
News |
Chart |
Request a new note
C
A
S
I |
Symbol/Exchange
Company Name
Industry Group |
PRICE |
CHANGE
(%Change) |
Day High |
Volume
(% DAV)
(% 50 day avg vol) |
52 Wk Hi
% From Hi |
Featured
Date |
Price
Featured |
Pivot Featured |
|
Max Buy |