You are not logged in.
This means you
CAN ONLY VIEW reports that were published prior to Thursday, March 20, 2025.
You
MUST UPGRADE YOUR MEMBERSHIP if you want to see any current reports.
AFTER MARKET UPDATE - WEDNESDAY, FEBRUARY 21ST, 2018
Previous After Market Report Next After Market Report >>>
|
|
|
|
DOW |
-166.97 |
24,797.78 |
-0.67% |
|
Volume |
889,602,440 |
+4% |
|
Volume |
1,936,487,650 |
+1% |
|
NASDAQ |
-16.08 |
7,218.23 |
-0.22% |
|
Advancers |
1,358 |
46% |
|
Advancers |
1,628 |
55% |
|
S&P 500 |
-14.93 |
2,701.33 |
-0.55% |
|
Decliners |
1,614 |
54% |
|
Decliners |
1,310 |
45% |
|
Russell 2000 |
+1.84 |
1,531.84 |
+0.12% |
|
52 Wk Highs |
81 |
|
|
52 Wk Highs |
104 |
|
|
S&P 600 |
+1.99 |
934.93 |
+0.21% |
|
52 Wk Lows |
65 |
|
|
52 Wk Lows |
54 |
|
|
 |
Indices Reversed Early Gains to End Session Lower
Kenneth J. Gruneisen - Passed the CAN SLIM® Master's Exam
U.S. equities Stocks finished lower Wednesday. The Dow dropped 166 points to 24797. The S&P 500 declined 14 points to 2701 while the Nasdaq Composite lost 16 points to 7218. The volume totals reported were higher than the prior session totals on the NYSE and on the Nasdaq exchange. Decliners led advancers by an 8-7 margin on the NYSE while advancers led decliners by 8-7 on the Nasdaq exchange. New 52-week highs totals outnumbered new 52-week lows totals on both the NYSE and the Nasdaq exchange. There were 50 high-ranked companies from the Leaders List that made new 52-week highs and were listed on the BreakOuts Page, versus the total of 39 on the prior session. Charts used courtesy of www.stockcharts.com
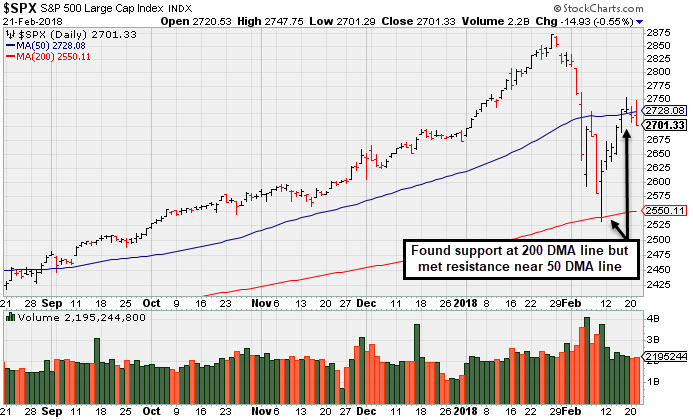 PICTURED: The S&P 500 Index found support at its 200-day moving average (DMA) line, but it met resistance near its 50 DMA line recently. The major indices (M criteria) are in a confirmed uptrend. New buying efforts may be justified under the fact-based investment system, however, only when all key criteria of the fact-based investment system are satisfied. The Featured Stocks Pageprovides the latest analysis on noteworthy high-ranked leaders.
U.S equities reversed earlier gains to close lower as investors digested the release of the minutes from last month’s FOMC meeting. According to the minutes, policymakers had gained more confidence in the economic outlook and inflation, bolstering the viewpoint that “further gradual” rate hikes would be warranted. On the data front, research firm Markit revealed that activity in both the manufacturing and service sectors unexpectedly expanded at a faster pace than forecasted in February. Another report showed existing home sales slumped 3.2% in January versus a projected growth of 0.5%.
All 11 sectors in the S&P 500 finished lower. Energy led decliners with shares of Devon Energy (DVN -11.77%) and Newfield Exploration (NFX -9.83%) tumbling following both companies’ recent earnings reports. In other earnings news, Advance Auto Parts (AAP +8.21%) rose after posting quarterly profits above projections.
Treasuries weakened along the curve. The yield on the 10-year note jumped five basis points to 2.95% following the Fed minutes release, the highest since January 2014, ultimately settling up four basis points to 2.94%. In commodities, NYMEX WTI crude fell 1.2% to $61.08/barrel. COMEX gold was up 0.1% to $1330.00/ounce amid a stronger dollar. |
 Kenneth J. Gruneisen started out as a licensed stockbroker in August 1987, a couple of months prior to the historic stock market crash that took the Dow Jones Industrial Average down -22.6% in a single day. He has published daily fact-based fundamental and technical analysis on high-ranked stocks online for two decades. Through FACTBASEDINVESTING.COM, Kenneth provides educational articles, news, market commentary, and other information regarding proven investment systems that work in good times and bad.
Comments contained in the body of this report are technical opinions only and are not necessarily those of Gruneisen Growth Corp. The material herein has been obtained from sources believed to be reliable and accurate, however, its accuracy and completeness cannot be guaranteed. Our firm, employees, and customers may effect transactions, including transactions contrary to any recommendation herein, or have positions in the securities mentioned herein or options with respect thereto. Any recommendation contained in this report may not be suitable for all investors and it is not to be deemed an offer or solicitation on our part with respect to the purchase or sale of any securities. |
|
 |
Bank Index Posted a Standout Gain
Kenneth J. Gruneisen - Passed the CAN SLIM® Master's Exam
Financial groups were mixed as the Broker/Dealer Index ($XBD -0.63%) fell and the Bank Index ($BKX +0.43%) rose, meanwhile the Retail Index ($RLX +0.05%) finished flat. The tech sector had a negative bias as the Semiconductor Index ($SOX -1.21%) outpaced the Networking Index ($NWX -0.54%) and the Biotechnology Index ($BTK -0.56%) to the downside. Energy-linked shares were weak as the Oil Services Index ($OSX -1.00%) and Integrated Oil Index ($XOI -1.22%) both fell. The Gold & Silver Index ($XAU -0.39%) also edged lower. Charts courtesy wwwstockcharts.com
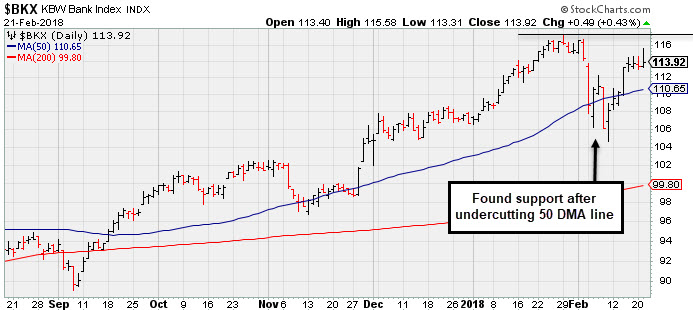 PICTURED: The Bank Index ($BKX +0.43%) recently found support and rebounded above its 50-day moving average (DMA) line.
| Oil Services |
$OSX |
134.70 |
-1.36 |
-1.00% |
-9.93% |
| Integrated Oil |
$XOI |
1,279.21 |
-15.86 |
-1.22% |
-4.22% |
| Semiconductor |
$SOX |
1,325.35 |
-16.18 |
-1.21% |
+5.77% |
| Networking |
$NWX |
511.07 |
-2.75 |
-0.54% |
+4.19% |
| Broker/Dealer |
$XBD |
281.49 |
-1.79 |
-0.63% |
+6.13% |
| Retail |
$RLX |
1,952.42 |
+1.03 |
+0.05% |
+12.61% |
| Gold & Silver |
$XAU |
80.51 |
-0.32 |
-0.40% |
-5.58% |
| Bank |
$BKX |
113.92 |
+0.49 |
+0.43% |
+6.76% |
| Biotech |
$BTK |
4,623.56 |
-26.04 |
-0.56% |
+9.51% |
|
|
|
 |
Fundamentals Remained Favorable and Strength Returned
Kenneth J. Gruneisen - Passed the CAN SLIM® Master's Exam
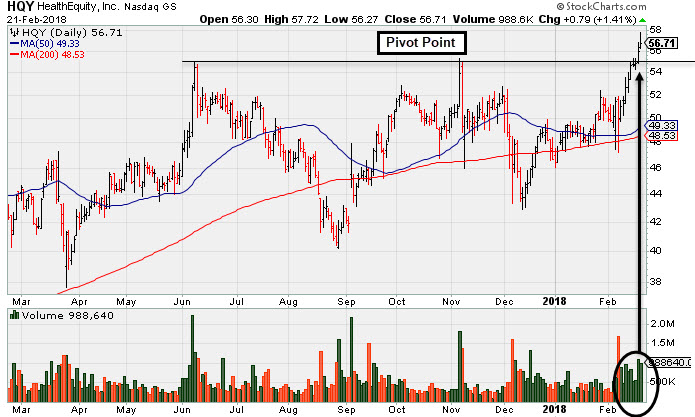
Healthequity Inc (HQY +$0.79 or +1.41% to $56.71) hit yet another new high with today's 9th consecutive gain. It triggered a technical buy signal with a gain above the new pivot point cited backed by +90% above average volume on the prior session when highlighted in the 2/20/18 mid-day report (read here). Disciplined investors always limit losses by selling any stock that falls more than -7% from their purchase price, knowing they can always buy back any stock if strength returns.
HQY's fundamentals remain strong, with earnings +70% on +31% sales revenues for the Oct '17 quarter. so the past 3 quarterly comparisons were above the +25% minimum earnings guideline (C criteria) and underpinned by strong sales revenues increases.
The number of top-rated funds owning its shares rose from 369 in Dec '16 to 441 in Dec '17, a reassuring sign concerning the I criteria. Its current Up/Down Volume Ratio of 2.5 is also an unbiased indication its shares have been under slight accumulation over the past 50 days. It has a fairly small supply of only 60.7 million shares (S criteria) outstanding, which can contribute to greater price volatility in the event of institutional buying or selling. It currently has a Timeliness Rating of A and a Sponsorship Rating of C.
The Commercial Services - Outsourcing industry group currently has a Group Relative Strength Rating of 52, however there are other strong leaders in the group hitting new highs, a reassuring sign concerning the L criteria. It completed its $14 IPO on 7/31/14 followed by an additional Public Offering on 5/05/15 and Secondary Offerings on both 10/20/16 and 9/23/15. |
|
|
Color Codes Explained :
Y - Better candidates highlighted by our
staff of experts.
G - Previously featured
in past reports as yellow but may no longer be buyable under the
guidelines.
***Last / Change / Volume data in this table is the closing quote data***
Symbol/Exchange
Company Name
Industry Group |
PRICE |
CHANGE
(%Change) |
Day High |
Volume
(% DAV)
(% 50 day avg vol) |
52 Wk Hi
% From Hi |
Featured
Date |
Price
Featured |
Pivot Featured |
|
Max Buy |
TPL
-
NYSE
Texas Pacific Land Trust
FINANCIAL SERVICES - Diversified Investments
|
$506.03
|
-1.70
-0.33% |
$527.87
|
10,998
61.10% of 50 DAV
50 DAV is 18,000
|
$569.99
-11.22%
|
2/20/2018
|
$517.00
|
PP = $569.99
|
|
MB = $598.49
|
Most Recent Note - 2/20/2018 2:50:47 PM
Y - Color code is changed to yellow as a valid secondary buy point exists up to +5% above the latest high after it successfully tested the 10 week moving average (WMA) line following an earlier technical breakout. Reported earnings +29% on +118% sales revenues for the Dec '17 quarter.
>>> FEATURED STOCK ARTICLE : Considerable Gains in First 2-3 Weeks After Recent Breakout - 1/23/2018 |
View all notes |
Set NEW NOTE alert |
Company Profile |
SEC
News |
Chart |
Request a new note
C
A
S
I |
YY
-
NASDAQ
YY Inc
INTERNET - Internet Service Providers
|
$133.24
|
+2.47
1.89% |
$135.81
|
1,039,904
89.42% of 50 DAV
50 DAV is 1,163,000
|
$142.97
-6.81%
|
12/29/2017
|
$113.06
|
PP = $123.58
|
|
MB = $129.76
|
Most Recent Note - 2/20/2018 2:51:51 PM
G - Consolidating above its 50 DMA line ($123.34), but it has not formed a sound new base of sufficient length.
>>> FEATURED STOCK ARTICLE : Retreating After +78% Rally in 5 Months - 2/2/2018 |
View all notes |
Set NEW NOTE alert |
Company Profile |
SEC
News |
Chart |
Request a new note
C
A
S
I |
LOGM
-
NASDAQ
Logmein Inc
INTERNET - Internet Software andamp; Services
|
$116.65
|
-0.75
-0.64% |
$119.55
|
906,236
154.23% of 50 DAV
50 DAV is 587,600
|
$134.80
-13.46%
|
2/15/2018
|
$132.35
|
PP = $129.61
|
|
MB = $136.09
|
Most Recent Note - 2/20/2018 2:18:55 PM
G - Color code is changed to green while slumping below its 50 DMA line ($120.34) with above average volume behind another loss today raising greater concerns. Only a prompt rebound above the 50 DMA line would help its outlook improve.
>>> FEATURED STOCK ARTICLE : Technical Breakout Came Ahead of Earnings News - 2/15/2018 |
View all notes |
Set NEW NOTE alert |
Company Profile |
SEC
News |
Chart |
Request a new note
C
A
S
I |
HTHT
-
NASDAQ
China Lodging Group Ads
LEISURE - Lodging
|
$154.78
|
+1.26
0.82% |
$158.85
|
370,212
58.58% of 50 DAV
50 DAV is 632,000
|
$166.19
-6.87%
|
12/22/2017
|
$138.07
|
PP = $142.90
|
|
MB = $150.05
|
Most Recent Note - 2/20/2018 2:45:11 PM
G - Still consolidating above its 50 DMA line ($143.28), but it has not formed a sound base of sufficient length. More damaging losses below the prior low ($128.60 on 2/09/18) the would raise greater concerns.
>>> FEATURED STOCK ARTICLE : Found Support Above Prior High After Latest Breakout - 1/24/2018 |
View all notes |
Set NEW NOTE alert |
Company Profile |
SEC
News |
Chart |
Request a new note
C
A
S
I |
PETS
-
NASDAQ
Petmed Express Inc
RETAIL - Drug Stores
|
$46.87
|
+1.18
2.58% |
$48.21
|
581,961
80.83% of 50 DAV
50 DAV is 720,000
|
$57.80
-18.91%
|
1/19/2018
|
$53.59
|
PP = $51.00
|
|
MB = $53.55
|
Most Recent Note - 2/20/2018 2:46:52 PM
G - Rebounding near its 50 DMA ($46.48) line. A rebound above the 50 DMA line is needed to help its outlook improve. Recently reported earnings +83% on +14% sales revenues, continuing its strong earnings track record.
>>> FEATURED STOCK ARTICLE : Sputtering Below 50-Day Average After Negative Reversal - 2/14/2018 |
View all notes |
Set NEW NOTE alert |
Company Profile |
SEC
News |
Chart |
Request a new note
C
A
S
I |
Symbol/Exchange
Company Name
Industry Group |
PRICE |
CHANGE
(%Change) |
Day High |
Volume
(% DAV)
(% 50 day avg vol) |
52 Wk Hi
% From Hi |
Featured
Date |
Price
Featured |
Pivot Featured |
|
Max Buy |
DPZ
-
NYSE
Dominos Pizza Inc
WHOLESALE - Food Wholesale
|
$230.53
|
+9.04
4.08% |
$236.00
|
3,393,487
314.79% of 50 DAV
50 DAV is 1,078,000
|
$227.10
1.51%
|
2/20/2018
|
$224.86
|
PP = $222.01
|
|
MB = $233.11
|
 Most Recent Note - 2/21/2018 11:57:53 AM
Y - Hitting another new high today. Finished the prior session below the pivot point after highlighted in the mid-day report in yellow with pivot point cited based on its 1/25/18 high plus 10 cents. See the latest FSU analysis for more details and an annotated graph.
>>> FEATURED STOCK ARTICLE : Popular Pizza Firm Met Resistance Near Prior High - 2/20/2018 |
View all notes |
Set NEW NOTE alert |
Company Profile |
SEC
News |
Chart |
Request a new note
C
A
S
I |
ESNT
-
NYSE
Essent Group Ltd
Finance-MrtgandRel Svc
|
$47.13
|
+0.29
0.62% |
$47.95
|
496,544
72.28% of 50 DAV
50 DAV is 687,000
|
$50.08
-5.89%
|
10/9/2017
|
$39.75
|
PP = $41.54
|
|
MB = $43.62
|
Most Recent Note - 2/21/2018 5:29:28 PM
G - Quietly consolidating above its 50 DMA line ($46.22) after a "positive reversal" when testing support near its 200 DMA line. More damaging losses would raise greater concerns. Reported earnings +16% on +27% sales revenues for the Dec '17 quarter, below the +25% minimum earnings guideline (C criteria), raising fundamental concerns.
>>> FEATURED STOCK ARTICLE : Slumped Below 50-Day Average With Earnings News Due Friday - 2/6/2018 |
View all notes |
Set NEW NOTE alert |
Company Profile |
SEC
News |
Chart |
Request a new note
C
A
S
I |
FIVE
-
NASDAQ
Five Below Inc
Retail-DiscountandVariety
|
$66.43
|
+1.02
1.56% |
$68.38
|
934,316
86.27% of 50 DAV
50 DAV is 1,083,000
|
$73.55
-9.68%
|
1/2/2018
|
$69.16
|
PP = $68.99
|
|
MB = $72.44
|
Most Recent Note - 2/21/2018 5:32:34 PM
G - It has not formed a sound new base and is sputtering near its 50 DMA line ($66.41). The recent low ($60.00 on 2/06/18) defines important near-term support to watch on pullbacks.
>>> FEATURED STOCK ARTICLE : Rebound Above 50-day Moving Average is Needed to Help Outlook - 2/12/2018 |
View all notes |
Set NEW NOTE alert |
Company Profile |
SEC
News |
Chart |
Request a new note
C
A
S
I |
SPLK
-
NASDAQ
Splunk Inc
Computer Sftwr-Database
|
$92.85
|
-0.83
-0.89% |
$95.09
|
1,757,282
116.84% of 50 DAV
50 DAV is 1,504,000
|
$97.27
-4.54%
|
2/15/2018
|
$96.06
|
PP = $93.68
|
|
MB = $98.36
|
Most Recent Note - 2/16/2018 7:08:16 PM
Y - Pulled back today after hitting new multi-year highs with 2 consecutive volume-driven gains. A valid secondary buy point exists up to +5% above the prior high since finding support at the 10 WMA after the prior breakout. Reported earnings +70% on +34% sales revenues for the Oct '17 quarter. Three of the past 4 quarterly comparisons showed strong earnings above the +25% minimum guideline (C criteria) and its annual earnings (A criteria) history has been strong since reaching profitability in FY '15. See the latest FSU analysis for more details and an annotated graph.
>>> FEATURED STOCK ARTICLE : Pulled Back to 10-Week Moving Average After Technical Breakout - 2/16/2018 |
View all notes |
Set NEW NOTE alert |
Company Profile |
SEC
News |
Chart |
Request a new note
C
A
S
I |
ANET
-
NYSE
Arista Networks Inc
TELECOMMUNICATIONS - Communication Equipment
|
$238.03
|
-11.62
-4.65% |
$250.56
|
2,984,830
283.46% of 50 DAV
50 DAV is 1,053,000
|
$311.67
-23.63%
|
1/8/2018
|
$248.88
|
PP = $245.75
|
|
MB = $258.04
|
Most Recent Note - 2/21/2018 5:42:21 PM
Suffered another damaging volume-driven loss and it will be dropped from the Featured Stocks list tonight.
>>> FEATURED STOCK ARTICLE : Consolidating After Getting Extended From its Prior High - 1/31/2018 |
View all notes |
Set NEW NOTE alert |
Company Profile |
SEC
News |
Chart |
Request a new note
C
A
S
I |
Symbol/Exchange
Company Name
Industry Group |
PRICE |
CHANGE
(%Change) |
Day High |
Volume
(% DAV)
(% 50 day avg vol) |
52 Wk Hi
% From Hi |
Featured
Date |
Price
Featured |
Pivot Featured |
|
Max Buy |
PAYC
-
NYSE
Paycom Software Inc
COMPUTER SOFTWARE and SERVICES - Application Software
|
$95.62
|
-0.14
-0.15% |
$97.56
|
599,095
85.71% of 50 DAV
50 DAV is 699,000
|
$97.11
-1.53%
|
2/15/2018
|
$95.01
|
PP = $93.61
|
|
MB = $98.29
|
Most Recent Note - 2/15/2018 5:58:32 PM
Y - Color code is changed to yellow while a valid "secondary buy point" exists up to +5% above the latest high. Found prompt support at its 10-week moving average following the prior breakout. Recently reported Dec '17 quarterly earnings +61% on +30% sales revenues after the close, continuing its strong earnings track record.
>>> FEATURED STOCK ARTICLE : Fell Below 50 Day Average With Losses on Above Average Volume - 2/8/2018 |
View all notes |
Set NEW NOTE alert |
Company Profile |
SEC
News |
Chart |
Request a new note
C
A
S
I |
GRUB
-
NYSE
Grubhub Inc
COMPUTER SOFTWARE and SERVICES - Technical and System Software
|
$97.52
|
+0.47
0.48% |
$99.81
|
1,366,628
77.08% of 50 DAV
50 DAV is 1,773,000
|
$99.32
-1.81%
|
6/21/2017
|
$47.33
|
PP = $46.94
|
|
MB = $49.29
|
Most Recent Note - 2/21/2018 5:33:28 PM
G - Wedged higher recently, getting more extended from any sound base. Recently reported earnings +61% on +49% sales revenues for the Dec '17 quarter.
>>> FEATURED STOCK ARTICLE : Slumped Below 50-Day Average With Earnings News Due - 2/7/2018 |
View all notes |
Set NEW NOTE alert |
Company Profile |
SEC
News |
Chart |
Request a new note
C
A
S
I |
HQY
-
NASDAQ
Healthequity Inc
COMPUTER SOFTWARE and SERVICES - Healthcare Information Service
|
$56.71
|
+0.79
1.41% |
$57.72
|
988,640
171.04% of 50 DAV
50 DAV is 578,000
|
$56.81
-0.18%
|
2/20/2018
|
$56.37
|
PP = $55.41
|
|
MB = $58.18
|
Most Recent Note - 2/21/2018 5:36:47 PM
Y - Hit a new high with today's 9th consecutive gain. Triggered a technical buy signal with a gain above the new pivot point cited backed by +90% above average volume on the prior session when highlighted in the mid-day report (read here). Fundamentals remain strong, with earnings +70% on +31% sales revenues for the Oct '17 quarter. See the latest FSU analysis for more details and a new annotated graph.
>>> FEATURED STOCK ARTICLE : Fundamentals Remained Favorable and Strength Returned - 2/21/2018 |
View all notes |
Set NEW NOTE alert |
Company Profile |
SEC
News |
Chart |
Request a new note
C
A
S
I |
PYPL
-
NASDAQ
Paypal Holdings Inc
Finance-CrdtCard/PmtPr
|
$76.51
|
-0.55
-0.71% |
$78.50
|
8,254,200
85.45% of 50 DAV
50 DAV is 9,660,000
|
$86.32
-11.36%
|
2/1/2018
|
$80.35
|
PP = $79.49
|
|
MB = $83.46
|
Most Recent Note - 2/21/2018 5:39:09 PM
G - Sputtering back below its 50 DMA line ($77.73) his week. Subsequent losses below the recent low ($71.63 on 2/09/18) would raise concerns and trigger a more worrisome technical sell signal.
>>> FEATURED STOCK ARTICLE : Gap Down Following Earnings News Tests Important Support Level - 2/1/2018 |
View all notes |
Set NEW NOTE alert |
Company Profile |
SEC
News |
Chart |
Request a new note
C
A
S
I |
OLLI
-
NASDAQ
Ollie's Bargain Outlet
Retail-DiscountandVariety
|
$56.70
|
+1.70
3.09% |
$57.40
|
963,449
164.41% of 50 DAV
50 DAV is 586,000
|
$58.50
-3.08%
|
11/21/2017
|
$46.78
|
PP = $47.00
|
|
MB = $49.35
|
Most Recent Note - 2/20/2018 2:43:02 PM
G - Still quietly consolidating above its 50 DMA line ($53.73). Prior low ($50.15 on 1/04/18) defines the next important near-term support.
>>> FEATURED STOCK ARTICLE : Consolidating Above 50-Day Moving Average Line - 2/13/2018 |
View all notes |
Set NEW NOTE alert |
Company Profile |
SEC
News |
Chart |
Request a new note
C
A
S
I |
Symbol/Exchange
Company Name
Industry Group |
PRICE |
CHANGE
(%Change) |
Day High |
Volume
(% DAV)
(% 50 day avg vol) |
52 Wk Hi
% From Hi |
Featured
Date |
Price
Featured |
Pivot Featured |
|
Max Buy |
WB
-
NASDAQ
Weibo Corp Cl A Ads
INTERNET - Content
|
$136.75
|
+2.85
2.13% |
$139.59
|
1,814,132
99.79% of 50 DAV
50 DAV is 1,818,000
|
$142.12
-3.78%
|
1/16/2018
|
$126.33
|
PP = $122.21
|
|
MB = $128.32
|
Most Recent Note - 2/15/2018 2:27:58 PM
G - Hit new all-time highs with 4 consecutive gains backed by above average volume, rallying further above its "max buy" level. Recently reported earnings +88% on +77% sales revenues for the Dec '17 quarter, continuing its strong earnings track record.
>>> FEATURED STOCK ARTICLE : Consolidating Near 50-Day Average With Earnings News Due - 2/9/2018 |
View all notes |
Set NEW NOTE alert |
Company Profile |
SEC
News |
Chart |
Request a new note
C
A
S
I |
HLI
-
NYSE
Houlihan Lokey Inc Cl A
Finance-Invest Bnk/Bkrs
|
$46.41
|
-0.07
-0.15% |
$47.40
|
198,998
87.28% of 50 DAV
50 DAV is 228,000
|
$52.81
-12.12%
|
1/3/2018
|
$45.88
|
PP = $47.09
|
|
MB = $49.44
|
Most Recent Note - 2/21/2018 5:34:23 PM
G - Quietly consolidating just below its 50 DMA line ($47.32). The recent low ($43.73 on 2/06/18) defines near term support where a violation would raise greater concerns. Recently reported earnings +21% on +5% sales revenues for the Dec '17 quarter, below the +25% minimum earnings guideline (C criteria), raising fundamental concerns. On 10/26/17 it completed a Secondary Offering.
>>> FEATURED STOCK ARTICLE : Damaging Violation of 50-Day Moving Average Line - 2/5/2018 |
View all notes |
Set NEW NOTE alert |
Company Profile |
SEC
News |
Chart |
Request a new note
C
A
S
I |
|
|
|
THESE ARE NOT BUY RECOMMENDATIONS!
Comments contained in the body of this report are technical
opinions only. The material herein has been obtained
from sources believed to be reliable and accurate, however,
its accuracy and completeness cannot be guaranteed.
This site is not an investment advisor, hence it does
not endorse or recommend any securities or other investments.
Any recommendation contained in this report may not
be suitable for all investors and it is not to be deemed
an offer or solicitation on our part with respect to
the purchase or sale of any securities. All trademarks,
service marks and trade names appearing in this report
are the property of their respective owners, and are
likewise used for identification purposes only.
This report is a service available
only to active Paid Premium Members.
You may opt-out of receiving report notifications
at any time. Questions or comments may be submitted
by writing to Premium Membership Services 665 S.E. 10 Street, Suite 201 Deerfield Beach, FL 33441-5634 or by calling 1-800-965-8307
or 954-785-1121.
|
|
|