You are not logged in.
This means you
CAN ONLY VIEW reports that were published prior to Wednesday, April 2, 2025.
You
MUST UPGRADE YOUR MEMBERSHIP if you want to see any current reports.
AFTER MARKET UPDATE - MONDAY, FEBRUARY 26TH, 2018
Previous After Market Report Next After Market Report >>>
|
|
|
|
DOW |
+399.28 |
25,709.27 |
+1.58% |
|
Volume |
813,060,740 |
+12% |
|
Volume |
1,859,588,786 |
-1% |
|
NASDAQ |
+84.07 |
7,421.46 |
+1.15% |
|
Advancers |
1,982 |
67% |
|
Advancers |
1,932 |
66% |
|
S&P 500 |
+32.30 |
2,779.60 |
+1.18% |
|
Decliners |
958 |
33% |
|
Decliners |
1,014 |
34% |
|
Russell 2000 |
+10.15 |
1,559.33 |
+0.65% |
|
52 Wk Highs |
90 |
|
|
52 Wk Highs |
114 |
|
|
S&P 600 |
+6.21 |
952.76 |
+0.66% |
|
52 Wk Lows |
26 |
|
|
52 Wk Lows |
37 |
|
|
 |
Breadth Positive as Leadership Improved Behind Indices' Gains
Kenneth J. Gruneisen - Passed the CAN SLIM® Master's Exam
Stocks closed firmly higher Monday. The Dow climbed 399 points to 25709. The S&P 500 added 32 points to 2779 while the Nasdaq Composite gained 84 points to 7421. The volume totals reported were mixed, slightly higher than the prior session total on the NYSE but lower on the Nasdaq exchange. Advancers led decliners by a 2-1 margin on the NYSE and nearly 2-1 on the Nasdaq exchange. New 52-week highs totals expanded and outnumbered shrinking new 52-week lows totals on both the Nasdaq exchange and the NYSE. Leadership improved as there were 52 high-ranked companies from the Leaders List that made new 52-week highs and were listed on the BreakOuts Page, versus the total of 31 on the prior session. Charts used courtesy of www.stockcharts.com
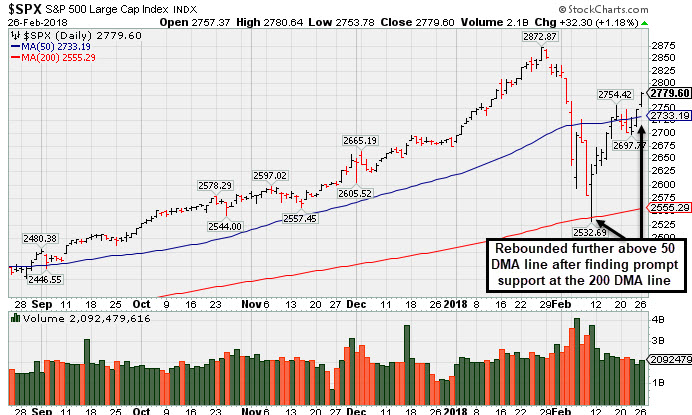 PICTURED: The S&P 500 Index recently found prompt support at its 200-day moving average (DMA) line, and rebounded further above its 50 DMA line with Monday's gain. The major indices (M criteria) are in a confirmed uptrend. New buying efforts may be justified under the fact-based investment system, however, only when all key criteria of the fact-based investment system are satisfied. The Featured Stocks Pageprovides the latest analysis on noteworthy high-ranked leaders.
The major averages advanced to the highest levels in over three weeks as Treasury yields eased. Investors appeared optimistic ahead of newly appointed Fed Chair Jerome Powell’s testimony to Congress tomorrow and a scheduled revision of fourth-quarter GDP on Wednesday. On the data front today, a report showed new home sales unexpectedly dropped 7.8% in January versus a projected rise of 3.5%.
Ten of 11 sectors in the S&P 500 finished higher, with Utilities the sole laggard. Technology shares paced gains with HP Inc. (HPQ +6.01%) rising following an analyst upgrade. Financials also outperformed with Berkshire Hathaway B shares (BRKB +3.88%) up following the release of Warren Buffett’s annual letter over the weekend. Materials underperformed on a relative basis as Albemarle (ALB -7.28%) and FMC Corp (FMC -2.41%) fell after both companies were subject to analyst downgrades over concerns of falling lithium prices.
Treasuries were mostly firmer with the yield on the benchmark 10-year note down one basis point to 2.86% ahead of Fed Chair Powell’s testimony before lawmakers tomorrow. In commodities, NYMEX WTI crude gained 0.6% to $63.94/barrel. COMEX gold rose 0.2% to $1330.70/ounce. |
 Kenneth J. Gruneisen started out as a licensed stockbroker in August 1987, a couple of months prior to the historic stock market crash that took the Dow Jones Industrial Average down -22.6% in a single day. He has published daily fact-based fundamental and technical analysis on high-ranked stocks online for two decades. Through FACTBASEDINVESTING.COM, Kenneth provides educational articles, news, market commentary, and other information regarding proven investment systems that work in good times and bad.
Comments contained in the body of this report are technical opinions only and are not necessarily those of Gruneisen Growth Corp. The material herein has been obtained from sources believed to be reliable and accurate, however, its accuracy and completeness cannot be guaranteed. Our firm, employees, and customers may effect transactions, including transactions contrary to any recommendation herein, or have positions in the securities mentioned herein or options with respect thereto. Any recommendation contained in this report may not be suitable for all investors and it is not to be deemed an offer or solicitation on our part with respect to the purchase or sale of any securities. |
|
 |
Financial, Retail, Tech Groups Led Gainers
Kenneth J. Gruneisen - Passed the CAN SLIM® Master's Exam
Financial groups had a positive bias as the Broker/Dealer Index ($XBD +1.28%) and the Bank Index ($BKX +0.94%) both rose on Monday. The Retail Index ($RLX +0.93%) also finished higher. The tech sector had a positive bias as the Semiconductor Index ($SOX +2.16%), Networking Index ($NWX +1.84%), and the Biotechnology Index ($BTK +0.613%) posted unanimous gains. The Oil Services Index ($OSX -0.08%) finished flat while the Integrated Oil Index ($XOI +0.50%) and the Gold & Silver Index ($XAU +0.92%) both were higher. Charts courtesy wwwstockcharts.com
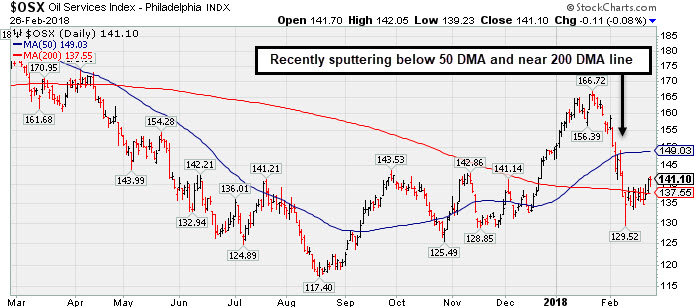 PICTURED: The Oil Services Index ($OSX -0.08%) has recently been sputtering below its 50-day moving average (DMA) line and near its 200 DMA line.
| Oil Services |
$OSX |
141.10 |
-0.11 |
-0.08% |
-5.65% |
| Integrated Oil |
$XOI |
1,326.45 |
+6.57 |
+0.50% |
-0.68% |
| Semiconductor |
$SOX |
1,380.27 |
+29.18 |
+2.16% |
+10.15% |
| Networking |
$NWX |
525.89 |
+9.52 |
+1.84% |
+7.21% |
| Broker/Dealer |
$XBD |
286.24 |
+3.63 |
+1.28% |
+7.92% |
| Retail |
$RLX |
2,005.55 |
+18.45 |
+0.93% |
+15.68% |
| Gold & Silver |
$XAU |
81.27 |
+0.74 |
+0.92% |
-4.69% |
| Bank |
$BKX |
115.30 |
+1.07 |
+0.94% |
+8.05% |
| Biotech |
$BTK |
4,724.35 |
+28.49 |
+0.61% |
+11.89% |
|
|
|
 |
Quietly Consolidating Back Above 50-Day Moving Average
Kenneth J. Gruneisen - Passed the CAN SLIM® Master's Exam
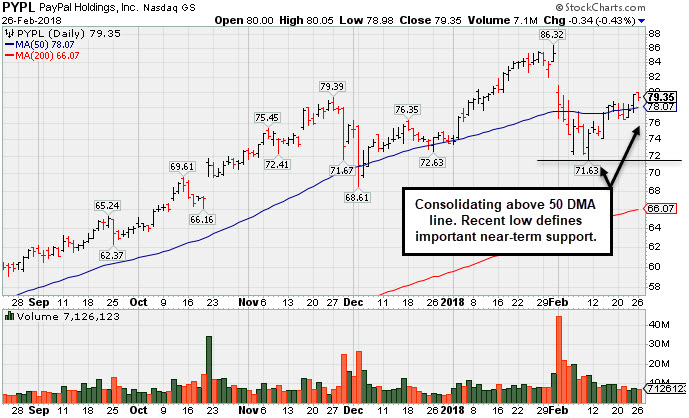
Paypal Holdings Inc (PYPL -$0.34 or -0.43% to $79.35) is quietly consolidating above its 50-day moving average (DMA) line ($78.02). Subsequent losses below the recent low ($71.63 on 2/09/18) would raise concerns and trigger a more worrisome technical sell signal.
Sales revenues rose by +17%, +18%, +21%, and +26% in the Mar, Jun, Sep, Dec '17 quarters, respectively, versus the year ago periods. This is very encouraging sales revenues and earnings growth rate acceleration in sequential quarterly comparisons, making it a better match with the fact-based investment system's winning models. Its annual earnings (A criteria) history has been very strong and steady. It reported earnings +31% on +26% sales revenues for the Dec '17 quarter, its 3rd consecutive quarterly earnings increase above the +25% minimum guideline (C criteria).
The high-ranked Finance - Credit Card/Payment Processing firm saw the number of top-rated funds owning its shares rise from 2,054 in Mar '17 to 2,392 in Dec '17, a reassuring sign concerning the I criteria. Its current Up/Down Volume Ratio of 1.3 is an unbiased indication its shares have been under accumulation over the past 50 days. It has a Timeliness Rating of A and Sponsorship Rating of B. Charts courtesy wwwstockcharts.com
 |
|
|
Color Codes Explained :
Y - Better candidates highlighted by our
staff of experts.
G - Previously featured
in past reports as yellow but may no longer be buyable under the
guidelines.
***Last / Change / Volume data in this table is the closing quote data***
Symbol/Exchange
Company Name
Industry Group |
PRICE |
CHANGE
(%Change) |
Day High |
Volume
(% DAV)
(% 50 day avg vol) |
52 Wk Hi
% From Hi |
Featured
Date |
Price
Featured |
Pivot Featured |
|
Max Buy |
TPL
-
NYSE
Texas Pacific Land Trust
FINANCIAL SERVICES - Diversified Investments
|
$532.00
|
+6.40
1.22% |
$544.66
|
17,471
97.06% of 50 DAV
50 DAV is 18,000
|
$569.99
-6.67%
|
2/20/2018
|
$517.00
|
PP = $569.99
|
|
MB = $598.49
|
Most Recent Note - 2/22/2018 5:26:09 PM
Y - Consolidating in an orderly fashion above its 50 DMA line. A valid secondary buy point exists up to +5% above the latest high after it successfully tested the 10 week moving average (WMA) line following an earlier technical breakout. Reported earnings +29% on +118% sales revenues for the Dec '17 quarter. See the latest FSU analysis for more details and a new annotated graph.
>>> FEATURED STOCK ARTICLE : Finding Support Above 50-Day Moving Average Line - 2/22/2018 |
View all notes |
Set NEW NOTE alert |
Company Profile |
SEC
News |
Chart |
Request a new note
C
A
S
I |
YY
-
NASDAQ
YY Inc
INTERNET - Internet Service Providers
|
$132.25
|
-4.00
-2.94% |
$139.58
|
1,072,759
95.44% of 50 DAV
50 DAV is 1,124,000
|
$142.97
-7.50%
|
12/29/2017
|
$113.06
|
PP = $123.58
|
|
MB = $129.76
|
Most Recent Note - 2/23/2018 5:19:06 PM
G - Consolidating above its 50 DMA line ($124.84), but it has not formed a sound new base of sufficient length.
>>> FEATURED STOCK ARTICLE : Retreating After +78% Rally in 5 Months - 2/2/2018 |
View all notes |
Set NEW NOTE alert |
Company Profile |
SEC
News |
Chart |
Request a new note
C
A
S
I |
LOGM
-
NASDAQ
Logmein Inc
INTERNET - Internet Software andamp; Services
|
$119.80
|
+2.20
1.87% |
$120.35
|
759,300
123.64% of 50 DAV
50 DAV is 614,100
|
$134.80
-11.13%
|
2/15/2018
|
$132.35
|
PP = $129.61
|
|
MB = $136.09
|
 Most Recent Note - 2/26/2018 5:49:12 PM
G - A rebound above the 50 DMA line ($120.43) would help its outlook improve, however its Relative Strength rating has slumped to 63, below the 80+ minimum guideline for buy candidates. Found support recently at its 200 DMA line and posted volume-driven gains.
>>> FEATURED STOCK ARTICLE : Technical Breakout Came Ahead of Earnings News - 2/15/2018 |
View all notes |
Set NEW NOTE alert |
Company Profile |
SEC
News |
Chart |
Request a new note
C
A
S
I |
HTHT
-
NASDAQ
China Lodging Group Ads
LEISURE - Lodging
|
$154.12
|
-5.79
-3.62% |
$160.90
|
399,129
67.31% of 50 DAV
50 DAV is 593,000
|
$166.19
-7.26%
|
12/22/2017
|
$138.07
|
PP = $142.90
|
|
MB = $150.05
|
Most Recent Note - 2/23/2018 5:20:45 PM
G - Posted a 4th consecutive gain with below average volume, wedging toward prior highs. Still consolidating above its 50 DMA line ($145.40), but it has not formed a sound base of sufficient length. See the latest FSU analysis for more details and a new annotated graph.
>>> FEATURED STOCK ARTICLE : Repaired Recent Technical Damage But Has Not Formed a New Base - 2/23/2018 |
View all notes |
Set NEW NOTE alert |
Company Profile |
SEC
News |
Chart |
Request a new note
C
A
S
I |
PETS
-
NASDAQ
Petmed Express Inc
RETAIL - Drug Stores
|
$47.16
|
-0.04
-0.08% |
$47.73
|
544,192
75.16% of 50 DAV
50 DAV is 724,000
|
$57.80
-18.41%
|
1/19/2018
|
$53.59
|
PP = $51.00
|
|
MB = $53.55
|
Most Recent Note - 2/23/2018 5:22:37 PM
G - Quietly rebounded and closed above the 50 DMA line ($46.69) helping its outlook improve. Faces resistance due to overhead supply up to the $57 level. Recently reported earnings +83% on +14% sales revenues, continuing its strong earnings track record.
>>> FEATURED STOCK ARTICLE : Sputtering Below 50-Day Average After Negative Reversal - 2/14/2018 |
View all notes |
Set NEW NOTE alert |
Company Profile |
SEC
News |
Chart |
Request a new note
C
A
S
I |
Symbol/Exchange
Company Name
Industry Group |
PRICE |
CHANGE
(%Change) |
Day High |
Volume
(% DAV)
(% 50 day avg vol) |
52 Wk Hi
% From Hi |
Featured
Date |
Price
Featured |
Pivot Featured |
|
Max Buy |
DPZ
-
NYSE
Dominos Pizza Inc
WHOLESALE - Food Wholesale
|
$228.02
|
-0.83
-0.36% |
$231.04
|
980,790
86.49% of 50 DAV
50 DAV is 1,134,000
|
$236.00
-3.38%
|
2/20/2018
|
$224.86
|
PP = $222.01
|
|
MB = $233.11
|
Most Recent Note - 2/21/2018 11:57:53 AM
Y - Hitting another new high today. Finished the prior session below the pivot point after highlighted in the mid-day report in yellow with pivot point cited based on its 1/25/18 high plus 10 cents. See the latest FSU analysis for more details and an annotated graph.
>>> FEATURED STOCK ARTICLE : Popular Pizza Firm Met Resistance Near Prior High - 2/20/2018 |
View all notes |
Set NEW NOTE alert |
Company Profile |
SEC
News |
Chart |
Request a new note
C
A
S
I |
ESNT
-
NYSE
Essent Group Ltd
Finance-MrtgandRel Svc
|
$46.86
|
-0.22
-0.47% |
$47.64
|
260,428
38.93% of 50 DAV
50 DAV is 669,000
|
$50.08
-6.43%
|
10/9/2017
|
$39.75
|
PP = $41.54
|
|
MB = $43.62
|
Most Recent Note - 2/21/2018 5:29:28 PM
G - Quietly consolidating above its 50 DMA line ($46.22) after a "positive reversal" when testing support near its 200 DMA line. More damaging losses would raise greater concerns. Reported earnings +16% on +27% sales revenues for the Dec '17 quarter, below the +25% minimum earnings guideline (C criteria), raising fundamental concerns.
>>> FEATURED STOCK ARTICLE : Slumped Below 50-Day Average With Earnings News Due Friday - 2/6/2018 |
View all notes |
Set NEW NOTE alert |
Company Profile |
SEC
News |
Chart |
Request a new note
C
A
S
I |
FIVE
-
NASDAQ
Five Below Inc
Retail-DiscountandVariety
|
$66.80
|
-0.70
-1.04% |
$67.76
|
974,393
92.10% of 50 DAV
50 DAV is 1,058,000
|
$73.55
-9.18%
|
1/2/2018
|
$69.16
|
PP = $68.99
|
|
MB = $72.44
|
Most Recent Note - 2/21/2018 5:32:34 PM
G - It has not formed a sound new base and is sputtering near its 50 DMA line ($66.41). The recent low ($60.00 on 2/06/18) defines important near-term support to watch on pullbacks.
>>> FEATURED STOCK ARTICLE : Rebound Above 50-day Moving Average is Needed to Help Outlook - 2/12/2018 |
View all notes |
Set NEW NOTE alert |
Company Profile |
SEC
News |
Chart |
Request a new note
C
A
S
I |
SPLK
-
NASDAQ
Splunk Inc
Computer Sftwr-Database
|
$94.69
|
-0.43
-0.45% |
$96.36
|
1,475,354
101.54% of 50 DAV
50 DAV is 1,453,000
|
$97.27
-2.65%
|
2/15/2018
|
$96.06
|
PP = $93.68
|
|
MB = $98.36
|
Most Recent Note - 2/22/2018 4:10:20 PM
Y - Hovering near multi-year highs. Its 50 DMA line defines near term support to watch on pullbacks. A valid secondary buy point exists up to +5% above the prior high since finding support at the 10 WMA after the prior breakout.
>>> FEATURED STOCK ARTICLE : Pulled Back to 10-Week Moving Average After Technical Breakout - 2/16/2018 |
View all notes |
Set NEW NOTE alert |
Company Profile |
SEC
News |
Chart |
Request a new note
C
A
S
I |
PAYC
-
NYSE
Paycom Software Inc
COMPUTER SOFTWARE and SERVICES - Application Software
|
$99.49
|
+1.07
1.09% |
$99.95
|
528,353
76.02% of 50 DAV
50 DAV is 695,000
|
$98.43
1.08%
|
2/15/2018
|
$95.01
|
PP = $93.61
|
|
MB = $98.29
|
Most Recent Note - 2/22/2018 4:02:52 PM
Y - Quietly hovering near its all-time high. A valid "secondary buy point" exists up to +5% above the latest high since it found support at its 10-week moving average line following the prior breakout. Fundamentals remain strong.
>>> FEATURED STOCK ARTICLE : Fell Below 50 Day Average With Losses on Above Average Volume - 2/8/2018 |
View all notes |
Set NEW NOTE alert |
Company Profile |
SEC
News |
Chart |
Request a new note
C
A
S
I |
Symbol/Exchange
Company Name
Industry Group |
PRICE |
CHANGE
(%Change) |
Day High |
Volume
(% DAV)
(% 50 day avg vol) |
52 Wk Hi
% From Hi |
Featured
Date |
Price
Featured |
Pivot Featured |
|
Max Buy |
GRUB
-
NYSE
Grubhub Inc
COMPUTER SOFTWARE and SERVICES - Technical and System Software
|
$99.13
|
+2.40
2.48% |
$99.46
|
1,402,462
77.19% of 50 DAV
50 DAV is 1,817,000
|
$99.81
-0.68%
|
6/21/2017
|
$47.33
|
PP = $46.94
|
|
MB = $49.29
|
Most Recent Note - 2/21/2018 5:33:28 PM
G - Wedged higher recently, getting more extended from any sound base. Recently reported earnings +61% on +49% sales revenues for the Dec '17 quarter.
>>> FEATURED STOCK ARTICLE : Slumped Below 50-Day Average With Earnings News Due - 2/7/2018 |
View all notes |
Set NEW NOTE alert |
Company Profile |
SEC
News |
Chart |
Request a new note
C
A
S
I |
HQY
-
NASDAQ
"HealthEquity, Inc"
COMPUTER SOFTWARE and SERVICES - Healthcare Information Service
|
$54.99
|
+2.49
4.73% |
$55.04
|
869,169
143.88% of 50 DAV
50 DAV is 604,100
|
$57.72
-4.73%
|
2/20/2018
|
$56.37
|
PP = $55.41
|
|
MB = $58.18
|
Most Recent Note - 2/26/2018 5:54:41 PM
Y - Finished strong today with another big volume-driven gain. Managed a "positive reversal" on the prior session after early lows undercut both its 50 and 200 DMA lines. Highlighted in the 2/20/18 mid-day report (read here). Fundamentals remain strong, with earnings +70% on +31% sales revenues for the Oct '17 quarter.
>>> FEATURED STOCK ARTICLE : Fundamentals Remained Favorable and Strength Returned - 2/21/2018 |
View all notes |
Set NEW NOTE alert |
Company Profile |
SEC
News |
Chart |
Request a new note
C
A
S
I |
PYPL
-
NASDAQ
Paypal Holdings Inc
Finance-CrdtCard/PmtPr
|
$79.35
|
-0.34
-0.43% |
$80.05
|
7,117,855
73.73% of 50 DAV
50 DAV is 9,654,000
|
$86.32
-8.07%
|
2/1/2018
|
$80.35
|
PP = $79.49
|
|
MB = $83.46
|
Most Recent Note - 2/26/2018 5:52:16 PM
G - Consolidating above its 50 DMA line ($78.07). Subsequent losses below the recent low ($71.63 on 2/09/18) would raise concerns and trigger a more worrisome technical sell signal. See the latest FSU analysis for more details and a new annotated graph.
>>> FEATURED STOCK ARTICLE : Quietly Consolidating Back Above 50-Day Moving Average - 2/26/2018 |
View all notes |
Set NEW NOTE alert |
Company Profile |
SEC
News |
Chart |
Request a new note
C
A
S
I |
OLLI
-
NASDAQ
Ollie's Bargain Outlet
Retail-DiscountandVariety
|
$60.30
|
+1.05
1.77% |
$60.49
|
462,032
82.07% of 50 DAV
50 DAV is 563,000
|
$59.30
1.69%
|
11/21/2017
|
$46.78
|
PP = $47.00
|
|
MB = $49.35
|
Most Recent Note - 2/26/2018 5:50:36 PM
G - Hit another new all-time high with light volume behind today's 4th consecutive gain. Found support near its 50 DMA line. Prior low ($50.15 on 1/04/18) defines the next important near-term support.
>>> FEATURED STOCK ARTICLE : Consolidating Above 50-Day Moving Average Line - 2/13/2018 |
View all notes |
Set NEW NOTE alert |
Company Profile |
SEC
News |
Chart |
Request a new note
C
A
S
I |
WB
-
NASDAQ
Weibo Corp Cl A Ads
INTERNET - Content
|
$132.77
|
-6.97
-4.99% |
$140.58
|
2,829,071
157.52% of 50 DAV
50 DAV is 1,796,000
|
$142.12
-6.58%
|
1/16/2018
|
$126.33
|
PP = $122.21
|
|
MB = $128.32
|
Most Recent Note - 2/26/2018 12:59:01 PM
G - Pulling back today with higher volume indicative of distributional pressure after getting extended from the prior base. Recently reported earnings +88% on +77% sales revenues for the Dec '17 quarter, continuing its strong earnings track record.
>>> FEATURED STOCK ARTICLE : Consolidating Near 50-Day Average With Earnings News Due - 2/9/2018 |
View all notes |
Set NEW NOTE alert |
Company Profile |
SEC
News |
Chart |
Request a new note
C
A
S
I |
Symbol/Exchange
Company Name
Industry Group |
PRICE |
CHANGE
(%Change) |
Day High |
Volume
(% DAV)
(% 50 day avg vol) |
52 Wk Hi
% From Hi |
Featured
Date |
Price
Featured |
Pivot Featured |
|
Max Buy |
HLI
-
NYSE
Houlihan Lokey Inc Cl A
Finance-Invest Bnk/Bkrs
|
$47.36
|
+0.77
1.65% |
$47.84
|
193,668
83.48% of 50 DAV
50 DAV is 232,000
|
$52.81
-10.32%
|
1/3/2018
|
$45.88
|
PP = $47.09
|
|
MB = $49.44
|
Most Recent Note - 2/21/2018 5:34:23 PM
G - Quietly consolidating just below its 50 DMA line ($47.32). The recent low ($43.73 on 2/06/18) defines near term support where a violation would raise greater concerns. Recently reported earnings +21% on +5% sales revenues for the Dec '17 quarter, below the +25% minimum earnings guideline (C criteria), raising fundamental concerns. On 10/26/17 it completed a Secondary Offering.
>>> FEATURED STOCK ARTICLE : Damaging Violation of 50-Day Moving Average Line - 2/5/2018 |
View all notes |
Set NEW NOTE alert |
Company Profile |
SEC
News |
Chart |
Request a new note
C
A
S
I |
|
|
|
THESE ARE NOT BUY RECOMMENDATIONS!
Comments contained in the body of this report are technical
opinions only. The material herein has been obtained
from sources believed to be reliable and accurate, however,
its accuracy and completeness cannot be guaranteed.
This site is not an investment advisor, hence it does
not endorse or recommend any securities or other investments.
Any recommendation contained in this report may not
be suitable for all investors and it is not to be deemed
an offer or solicitation on our part with respect to
the purchase or sale of any securities. All trademarks,
service marks and trade names appearing in this report
are the property of their respective owners, and are
likewise used for identification purposes only.
This report is a service available
only to active Paid Premium Members.
You may opt-out of receiving report notifications
at any time. Questions or comments may be submitted
by writing to Premium Membership Services 665 S.E. 10 Street, Suite 201 Deerfield Beach, FL 33441-5634 or by calling 1-800-965-8307
or 954-785-1121.
|
|
|

