You are not logged in.
This means you
CAN ONLY VIEW reports that were published prior to Thursday, March 20, 2025.
You
MUST UPGRADE YOUR MEMBERSHIP if you want to see any current reports.
AFTER MARKET UPDATE - THURSDAY, MARCH 8TH, 2018
Previous After Market Report Next After Market Report >>>
|
|
|
|
DOW |
+93.85 |
24,895.21 |
+0.38% |
|
Volume |
765,094,300 |
-9% |
|
Volume |
2,255,699,530 |
+4% |
|
NASDAQ |
+31.30 |
7,427.95 |
+0.42% |
|
Advancers |
1,703 |
58% |
|
Advancers |
1,557 |
53% |
|
S&P 500 |
+12.17 |
2,738.97 |
+0.45% |
|
Decliners |
1,235 |
42% |
|
Decliners |
1,355 |
47% |
|
Russell 2000 |
-2.57 |
1,571.97 |
-0.16% |
|
52 Wk Highs |
103 |
|
|
52 Wk Highs |
184 |
|
|
S&P 600 |
-1.11 |
955.38 |
-0.12% |
|
52 Wk Lows |
40 |
|
|
52 Wk Lows |
25 |
|
|
 |
Healthy Leadership Underpins Major Indices' Gains
Kenneth J. Gruneisen - Passed the CAN SLIM® Master's Exam
Stocks finished higher Thursday. The Dow climbed 93 points to 24895 while the S&P 500 added 12 points to 2738. The Nasdaq Composite gained 31 points to 7427. The volume totals reported were mixed, lighter than the prior session total on the NYSE and slightly higher on the Nasdaq exchange. Advancers led decliners by almost a 3-2 margin on the NYSE and by an 8-7 margin on the Nasdaq exchange. Leadership improved as rising new 52-week high totals outnumbered new 52-week lows totals on both the Nasdaq exchange and the NYSE. There were 74 high-ranked companies from the Leaders List that made new 52-week highs and were listed on the BreakOuts Page, versus the total of 75 on the prior session. Charts used courtesy of www.stockcharts.com
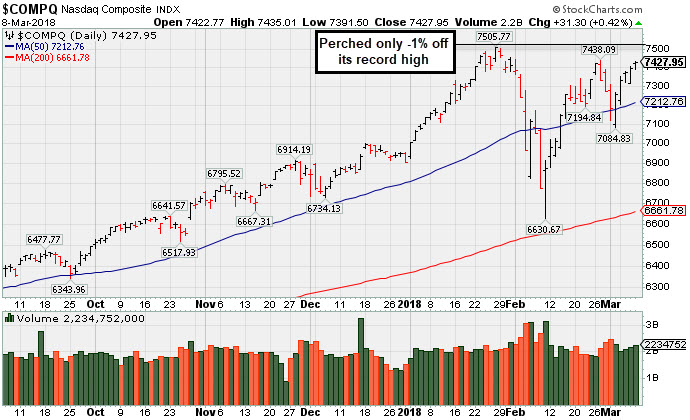 PICTURED: The Nasdaq Composite Index is consolidating only -1% off its record high. The major indices (M criteria) have seen the latest uptrend come under pressure as several distribution days were noted. New buying efforts may be justified under the fact-based investment system, however, only when all key criteria of the fact-based investment system are satisfied. The Featured Stocks Page provides the latest analysis on noteworthy high-ranked leaders.
U.S. equities advanced following President Trump’s announcement that he will implement a 25% tariff on imported steel and a 10% levy on imported aluminum in 15 days. Though Mexico and Canada are excluded from these charges at this time, the door remains open for other countries to negotiate exemptions. On the data front, initial jobless claims increased to 231,000 from 210,000 in the prior week. Investor attention remains on tomorrow’s jobs report, in which the Labor Department is expected to reveal nonfarm payrolls grew by 205,000 in February while the unemployment rate edged down to 4.0%.
Ten of 11 sectors in the S&P 500 finished in positive territory, with Energy the sole laggard. Consumer Staples paced gains. Health Care was also a notable outperformer, led by Express Scripts (ESRX +8.57%) after agreeing to be acquired by Cigna (CI -11.45%) for $67 billion. In earnings news, Costco (COST -0.89%) fell after quarterly results came in below consensus estimates.
Treasuries strengthened along the curve with the yield on the benchmark 10-year note dipping two basis points to 2.86%. In commodities, NYMEX WTI crude fell 1.4% to $60.27/barrel. COMEX gold lost 0.4% to $1322.50/ounce amid a stronger dollar. |
 Kenneth J. Gruneisen started out as a licensed stockbroker in August 1987, a couple of months prior to the historic stock market crash that took the Dow Jones Industrial Average down -22.6% in a single day. He has published daily fact-based fundamental and technical analysis on high-ranked stocks online for two decades. Through FACTBASEDINVESTING.COM, Kenneth provides educational articles, news, market commentary, and other information regarding proven investment systems that work in good times and bad.
Comments contained in the body of this report are technical opinions only and are not necessarily those of Gruneisen Growth Corp. The material herein has been obtained from sources believed to be reliable and accurate, however, its accuracy and completeness cannot be guaranteed. Our firm, employees, and customers may effect transactions, including transactions contrary to any recommendation herein, or have positions in the securities mentioned herein or options with respect thereto. Any recommendation contained in this report may not be suitable for all investors and it is not to be deemed an offer or solicitation on our part with respect to the purchase or sale of any securities. |
|
 |
Broker/Dealer and Biotech Indexes Led Group Gainers
Kenneth J. Gruneisen - Passed the CAN SLIM® Master's Exam
On Thursday the Retail Index ($RLX -0.10%) and the Bank Index ($BKX -0.14%) both pulled back slightly while the Broker/Dealer Index ($XBD +0.61%) finished the session modestly higher. The tech sector had a positive bias as the Networking Index ($NWX +0.34%) and the Semiconductor Index ($SOX +0.11%) both were outpaced by the Biotechnology Index ($BTK +0.81%) again. Commodity-linked groups had a slightly positive bias as the Gold & Silver Index ($XAU +0.23%), Integrated Oil Index ($XOI +0.05%) and the Oil Services Index ($OSX +0.32%) edged higher. Charts courtesy wwwstockcharts.com
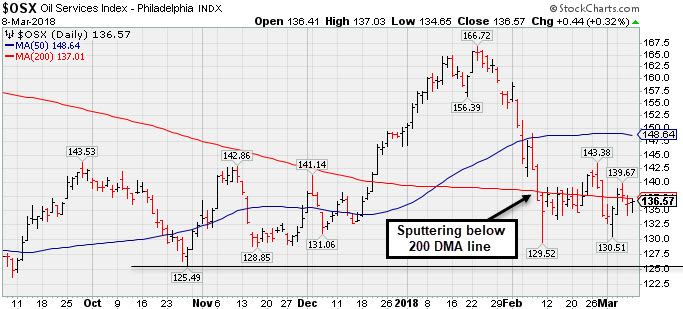 PICTURED: The Oil Services Index ($OSX +0.32%) is sputtering below its 200-day moving average (DMA) line after recently slumping near its late 2017 lows.
| Oil Services |
$OSX |
136.57 |
+0.44 |
+0.32% |
-8.68% |
| Integrated Oil |
$XOI |
1,286.78 |
+0.61 |
+0.05% |
-3.65% |
| Semiconductor |
$SOX |
1,402.05 |
+1.58 |
+0.11% |
+11.89% |
| Networking |
$NWX |
546.41 |
+1.88 |
+0.34% |
+11.39% |
| Broker/Dealer |
$XBD |
294.15 |
+1.78 |
+0.61% |
+10.90% |
| Retail |
$RLX |
1,998.73 |
-2.10 |
-0.10% |
+15.28% |
| Gold & Silver |
$XAU |
78.97 |
+0.18 |
+0.23% |
-7.39% |
| Bank |
$BKX |
113.60 |
-0.17 |
-0.15% |
+6.46% |
| Biotech |
$BTK |
4,800.90 |
+38.49 |
+0.81% |
+13.71% |
|
|
|
 |
Recent Consolidation is Not a New Base of Sufficient Length
Kenneth J. Gruneisen - Passed the CAN SLIM® Master's Exam
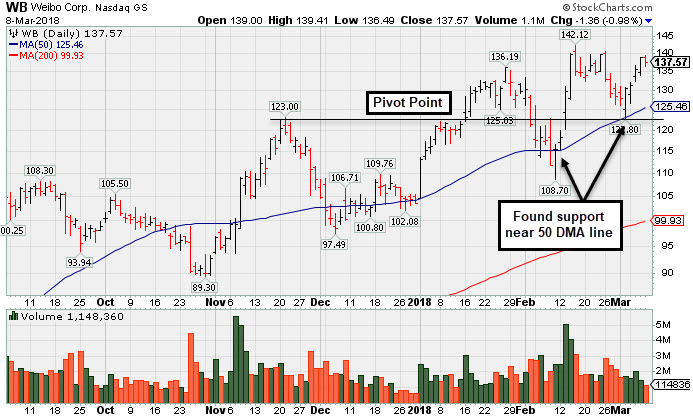
Weibo Corp Cl (WB -$1.36 or -0.98% to $137.57) recently rose back above its "max buy" level, but it has not formed a sound new base of sufficient length. It was last shown in this FSU section on 2/09/18 with an annotated graph under the headline, "Consolidating Near 50-Day Average With Earnings News Due".
Recently reported earnings +88% on +77% sales revenues for the Dec '17 quarter, continuing its strong earnings track record. It reported earnings +113% on +81% sales revenues for the Sep '17 quarter. Its strong quarterly earnings track record was marked by sales revenues acceleration. Sales revenues rose from the year ago periods by +24%, +36%, +42%, +43%, +67%, +72%, and +81% in the Mar, Jun, Sep, Dec '16, Mar, Jun, and Sep '17 quarters, respectively. The limited annual earnings (A criteria) history for this China-based Internet - Content firm remains a concern. Weibo completed its $17 IPO in April 2014, and in FY '14 and prior years it reported losses.
The number of top-rated funds owning its shares rose from 312 in Mar '17 to 555 in Dec '17, a reassuring sign concerning the I criteria. Its current Up/Down Volume Ratio of 1.4 is an unbiased indication its shares have been under accumulation over the past 50 days. It has a Timeliness rating of A but a Sponsorship rating of E.
WB was highlighted in yellow in the 1/16/18 mid-day report (read here) with pivot point cited based on its 1/08/18 high after an 8-week cup-with-handle base. Limited annual earnings (A criteria) history for this China-based Internet - Content firm remains a concern. Charts courtesy wwwstockcharts.com
 |
|
|
Color Codes Explained :
Y - Better candidates highlighted by our
staff of experts.
G - Previously featured
in past reports as yellow but may no longer be buyable under the
guidelines.
***Last / Change / Volume data in this table is the closing quote data***
Symbol/Exchange
Company Name
Industry Group |
PRICE |
CHANGE
(%Change) |
Day High |
Volume
(% DAV)
(% 50 day avg vol) |
52 Wk Hi
% From Hi |
Featured
Date |
Price
Featured |
Pivot Featured |
|
Max Buy |
TPL
-
NYSE
Texas Pacific Land Trust
FINANCIAL SERVICES - Diversified Investments
|
$523.87
|
+0.65
0.12% |
$531.96
|
8,670
48.17% of 50 DAV
50 DAV is 18,000
|
$569.99
-8.09%
|
2/20/2018
|
$517.00
|
PP = $569.99
|
|
MB = $598.49
|
Most Recent Note - 3/5/2018 7:06:06 PM
Y -Posted a small gain today while consolidating in an orderly fashion above its 50 DMA line ($503.41). A valid secondary buy point exists up to +5% above the latest high after it successfully tested the 10 week moving average (WMA) line following an earlier technical breakout. Reported earnings +29% on +118% sales revenues for the Dec '17 quarter.
>>> FEATURED STOCK ARTICLE : Finding Support Above 50-Day Moving Average Line - 2/22/2018 |
View all notes |
Set NEW NOTE alert |
Company Profile |
SEC
News |
Chart |
Request a new note
C
A
S
I |
YY
-
NASDAQ
YY Inc
INTERNET - Internet Service Providers
|
$119.99
|
-6.34
-5.02% |
$135.99
|
5,708,723
414.28% of 50 DAV
50 DAV is 1,378,000
|
$142.97
-16.07%
|
12/29/2017
|
$113.06
|
PP = $123.58
|
|
MB = $129.76
|
 Most Recent Note - 3/8/2018 1:00:58 PM
G - Gapped up today but quickly erased early gains and slumped back below its 50 DMA line ($127.85) again. Wider than usual intra-day price swings are a sign of uncertainty. Faces resistance due to overhead supply up to the $142 level. Reported earnings +55% on +56% sales revenues for the Dec '17 quarter, continuing its strong earnings track record.
>>> FEATURED STOCK ARTICLE : Earnings News Due Next Week for Chinese Social Platform - 2/27/2018 |
View all notes |
Set NEW NOTE alert |
Company Profile |
SEC
News |
Chart |
Request a new note
C
A
S
I |
LOGM
-
NASDAQ
Logmein Inc
INTERNET - Internet Software andamp; Services
|
$122.80
|
-0.30
-0.24% |
$123.75
|
247,258
43.13% of 50 DAV
50 DAV is 573,300
|
$134.80
-8.90%
|
2/15/2018
|
$132.35
|
PP = $129.61
|
|
MB = $136.09
|
Most Recent Note - 3/5/2018 7:09:41 PM
G - Rebounded and closed above the 50 DMA line ($120.37) today helping its outlook improve. Its Relative Strength rating is 74, still below the 80+ minimum guideline for buy candidates. Found support recently at its 200 DMA line.
>>> FEATURED STOCK ARTICLE : Technical Breakout Came Ahead of Earnings News - 2/15/2018 |
View all notes |
Set NEW NOTE alert |
Company Profile |
SEC
News |
Chart |
Request a new note
C
A
S
I |
HTHT
-
NASDAQ
China Lodging Group Ads
LEISURE - Lodging
|
$155.80
|
+1.13
0.73% |
$157.67
|
295,789
55.70% of 50 DAV
50 DAV is 531,000
|
$166.19
-6.25%
|
12/22/2017
|
$138.07
|
PP = $142.90
|
|
MB = $150.05
|
Most Recent Note - 3/7/2018 5:39:42 PM
G - While consolidating above its 50 DMA line ($149) its outlook has improved. Subsequent losses below the recent low ($141.01 on 3/02/18) would raise greater concerns and trigger a technical sell signal.
>>> FEATURED STOCK ARTICLE : Repaired Recent Technical Damage But Has Not Formed a New Base - 2/23/2018 |
View all notes |
Set NEW NOTE alert |
Company Profile |
SEC
News |
Chart |
Request a new note
C
A
S
I |
PETS
-
NASDAQ
Petmed Express Inc
RETAIL - Drug Stores
|
$47.37
|
+1.19
2.58% |
$48.32
|
481,630
69.80% of 50 DAV
50 DAV is 690,000
|
$57.80
-18.04%
|
1/19/2018
|
$53.59
|
PP = $51.00
|
|
MB = $53.55
|
Most Recent Note - 3/7/2018 5:34:51 PM
G - Tallied 3 consecutive small gains with light volume, but still sputtering below its 50 DMA line ($46.71). Faces near-term resistance due to overhead supply up to the $57 level. Recently reported earnings +83% on +14% sales revenues, continuing its strong earnings track record.
>>> FEATURED STOCK ARTICLE : Sputtering Below 50-Day Average After Negative Reversal - 2/14/2018 |
View all notes |
Set NEW NOTE alert |
Company Profile |
SEC
News |
Chart |
Request a new note
C
A
S
I |
Symbol/Exchange
Company Name
Industry Group |
PRICE |
CHANGE
(%Change) |
Day High |
Volume
(% DAV)
(% 50 day avg vol) |
52 Wk Hi
% From Hi |
Featured
Date |
Price
Featured |
Pivot Featured |
|
Max Buy |
DPZ
-
NYSE
Dominos Pizza Inc
WHOLESALE - Food Wholesale
|
$222.78
|
-0.18
-0.08% |
$226.63
|
558,255
50.16% of 50 DAV
50 DAV is 1,113,000
|
$236.00
-5.60%
|
2/20/2018
|
$224.86
|
PP = $222.01
|
|
MB = $233.11
|
Most Recent Note - 3/5/2018 6:58:52 PM
Y - Quietly sputtering below its pivot point raising concerns. Tallied big gains then stalled after highlighted in the 2/20/18 mid-day report with pivot point cited based on its 1/25/18 high plus 10 cents.
>>> FEATURED STOCK ARTICLE : Popular Pizza Firm Met Resistance Near Prior High - 2/20/2018 |
View all notes |
Set NEW NOTE alert |
Company Profile |
SEC
News |
Chart |
Request a new note
C
A
S
I |
ESNT
-
NYSE
Essent Group Ltd
Finance-MrtgandRel Svc
|
$46.54
|
-0.14
-0.30% |
$46.85
|
337,459
53.65% of 50 DAV
50 DAV is 629,000
|
$50.08
-7.07%
|
10/9/2017
|
$39.75
|
PP = $41.54
|
|
MB = $43.62
|
Most Recent Note - 3/5/2018 6:59:58 PM
G - Quietly sputtering below its 50 DMA line ($46.23). Tested support near its 200 DMA line recently. More damaging losses would raise greater concerns. Reported earnings +16% on +27% sales revenues for the Dec '17 quarter, below the +25% minimum earnings guideline (C criteria), raising fundamental concerns.
>>> FEATURED STOCK ARTICLE : Sputtering ESNBelow 50-Day Moving Average Line - 3/2/2018 |
View all notes |
Set NEW NOTE alert |
Company Profile |
SEC
News |
Chart |
Request a new note
C
A
S
I |
FIVE
-
NASDAQ
Five Below Inc
Retail-DiscountandVariety
|
$68.02
|
-0.95
-1.38% |
$69.40
|
961,062
93.13% of 50 DAV
50 DAV is 1,032,000
|
$73.55
-7.52%
|
1/2/2018
|
$69.16
|
PP = $68.99
|
|
MB = $72.44
|
Most Recent Note - 3/7/2018 5:41:31 PM
Y - Suffered a loss today with higher volume indicative of distributional pressure. Consolidating above its 50 DMA line ($66.74) and the recent low ($60.00 on 2/06/18) defining important near-term support to watch on pullbacks.
>>> FEATURED STOCK ARTICLE : Rebound Above 50-day Moving Average is Needed to Help Outlook - 2/12/2018 |
View all notes |
Set NEW NOTE alert |
Company Profile |
SEC
News |
Chart |
Request a new note
C
A
S
I |
SPLK
-
NASDAQ
Splunk Inc
Computer Sftwr-Database
|
$106.46
|
+0.81
0.77% |
$107.89
|
1,990,448
118.76% of 50 DAV
50 DAV is 1,676,000
|
$106.39
0.07%
|
2/15/2018
|
$96.06
|
PP = $93.68
|
|
MB = $98.36
|
Most Recent Note - 3/7/2018 12:37:23 PM
G - Hitting yet another new all-time high today, getting more extended from any sound base. Disciplined investors avoid chasing extended stocks. Bullish action came after it reported earnings +76% on +37% sales revenues for the quarter ended January 31, 2018 versus the year ago period.
>>> FEATURED STOCK ARTICLE : Pulled Back to 10-Week Moving Average After Technical Breakout - 2/16/2018 |
View all notes |
Set NEW NOTE alert |
Company Profile |
SEC
News |
Chart |
Request a new note
C
A
S
I |
PAYC
-
NYSE
Paycom Software Inc
COMPUTER SOFTWARE and SERVICES - Application Software
|
$109.34
|
+1.84
1.71% |
$109.73
|
489,427
67.23% of 50 DAV
50 DAV is 728,000
|
$108.17
1.08%
|
2/15/2018
|
$95.01
|
PP = $93.61
|
|
MB = $98.29
|
Most Recent Note - 3/7/2018 5:20:25 PM
G - Stubbornly holding its ground and it hit yet another new all-time high with today's 4th consecutive gain, getting very extended from any sound base. Prior highs in the $93 area define initial support above its 50 DMA line ($90.13). Fundamentals remain strong. See the latest FSU analysis for more details and a new annotated graph.
>>> FEATURED STOCK ARTICLE : Extended From Prior Base After Streak of Gains - 3/7/2018 |
View all notes |
Set NEW NOTE alert |
Company Profile |
SEC
News |
Chart |
Request a new note
C
A
S
I |
Symbol/Exchange
Company Name
Industry Group |
PRICE |
CHANGE
(%Change) |
Day High |
Volume
(% DAV)
(% 50 day avg vol) |
52 Wk Hi
% From Hi |
Featured
Date |
Price
Featured |
Pivot Featured |
|
Max Buy |
GRUB
-
NYSE
Grubhub Inc
COMPUTER SOFTWARE and SERVICES - Technical and System Software
|
$106.39
|
+2.23
2.14% |
$106.53
|
1,112,580
61.50% of 50 DAV
50 DAV is 1,809,000
|
$104.67
1.64%
|
6/21/2017
|
$47.33
|
PP = $46.94
|
|
MB = $49.29
|
Most Recent Note - 3/6/2018 10:45:04 AM
G - Gapped down today retreating from its all-time high after getting very extended from any sound base. Well above its 50 DMA line ($80) and prior highs defining near-term support. Recently reported earnings +61% on +49% sales revenues for the Dec '17 quarter.
>>> FEATURED STOCK ARTICLE : Bullish Action Followed Last Earnings Report - 3/1/2018 |
View all notes |
Set NEW NOTE alert |
Company Profile |
SEC
News |
Chart |
Request a new note
C
A
S
I |
HQY
-
NASDAQ
Healthequity Inc
COMPUTER SOFTWARE and SERVICES - Healthcare Information Service
|
$59.02
|
+0.47
0.80% |
$59.19
|
369,179
61.33% of 50 DAV
50 DAV is 602,000
|
$58.57
0.77%
|
2/20/2018
|
$56.37
|
PP = $55.41
|
|
MB = $58.18
|
Most Recent Note - 3/5/2018 7:08:02 PM
Y - Posted a big gain with average volume today for a best-ever close. Wider than usual intra-day price swings were noted as indicative of uncertainty since highlighted in the 2/20/18 mid-day report (read here). Fundamentals remain strong.
>>> FEATURED STOCK ARTICLE : Fundamentals Remained Favorable and Strength Returned - 2/21/2018 |
View all notes |
Set NEW NOTE alert |
Company Profile |
SEC
News |
Chart |
Request a new note
C
A
S
I |
PYPL
-
NASDAQ
Paypal Holdings Inc
Finance-CrdtCard/PmtPr
|
$79.87
|
+0.35
0.44% |
$80.49
|
6,429,449
66.12% of 50 DAV
50 DAV is 9,724,000
|
$86.32
-7.47%
|
2/1/2018
|
$80.35
|
PP = $79.49
|
|
MB = $83.46
|
Most Recent Note - 3/7/2018 5:36:09 PM
G - Quietly consolidating above its 50 DMA line ($78.72). Subsequent losses below the recent low ($71.63 on 2/09/18) would raise concerns and trigger a more worrisome technical sell signal. Fundamentals remain strong.
>>> FEATURED STOCK ARTICLE : Quietly Consolidating Back Above 50-Day Moving Average - 2/26/2018 |
View all notes |
Set NEW NOTE alert |
Company Profile |
SEC
News |
Chart |
Request a new note
C
A
S
I |
OLLI
-
NASDAQ
Ollie's Bargain Outlet
Retail-DiscountandVariety
|
$58.70
|
-1.40
-2.33% |
$60.83
|
464,264
87.27% of 50 DAV
50 DAV is 532,000
|
$62.05
-5.40%
|
11/21/2017
|
$46.78
|
PP = $47.00
|
|
MB = $49.35
|
Most Recent Note - 3/7/2018 5:43:56 PM
G - Gapped down for a loss on higher volume indicative of distributional pressure, retreating from its all-time high after getting extended from any sound base. Support is defined by its 50 DMA line ($55.74) and prior low ($50.15 on 1/04/18).
>>> FEATURED STOCK ARTICLE : Consolidating Above 50-Day Moving Average Line - 2/13/2018 |
View all notes |
Set NEW NOTE alert |
Company Profile |
SEC
News |
Chart |
Request a new note
C
A
S
I |
WB
-
NASDAQ
Weibo Corp Cl A Ads
INTERNET - Content
|
$137.57
|
-1.36
-0.98% |
$139.41
|
1,135,173
59.94% of 50 DAV
50 DAV is 1,894,000
|
$142.12
-3.20%
|
1/16/2018
|
$126.33
|
PP = $122.21
|
|
MB = $128.32
|
Most Recent Note - 3/8/2018 5:11:44 PM
G - Found support recently at 50 DMA line ($125), but it is extended from any sound base. Recently reported earnings +88% on +77% sales revenues for the Dec '17 quarter, continuing its strong earnings track record. See the latest FSU analysis for more details and a new annotated graph.
>>> FEATURED STOCK ARTICLE : Recent Consolidation is Not a New Base of Sufficient Length - 3/8/2018 |
View all notes |
Set NEW NOTE alert |
Company Profile |
SEC
News |
Chart |
Request a new note
C
A
S
I |
Symbol/Exchange
Company Name
Industry Group |
PRICE |
CHANGE
(%Change) |
Day High |
Volume
(% DAV)
(% 50 day avg vol) |
52 Wk Hi
% From Hi |
Featured
Date |
Price
Featured |
Pivot Featured |
|
Max Buy |
HLI
-
NYSE
Houlihan Lokey Inc Cl A
Finance-Invest Bnk/Bkrs
|
$46.30
|
+0.28
0.61% |
$46.44
|
148,429
66.56% of 50 DAV
50 DAV is 223,000
|
$52.81
-12.33%
|
1/3/2018
|
$45.88
|
PP = $47.09
|
|
MB = $49.44
|
Most Recent Note - 3/5/2018 7:04:34 PM
G - Met resistance recently and it remains below its 50 DMA line ($47.45). The recent low ($43.73 on 2/06/18) defines near term support where a violation would raise greater concerns. Earnings +21% for the Dec '17 quarter were below the +25% minimum earnings guideline (C criteria) raising fundamental concerns.
>>> FEATURED STOCK ARTICLE : Recently Met Resistance at 50-Day Moving Average - 2/28/2018 |
View all notes |
Set NEW NOTE alert |
Company Profile |
SEC
News |
Chart |
Request a new note
C
A
S
I |
SQ
-
NYSE
Square Inc Cl A
Finance-CrdtCard/PmtPr
|
$52.25
|
+1.53
3.02% |
$52.97
|
16,928,589
110.09% of 50 DAV
50 DAV is 15,377,000
|
$51.89
0.69%
|
3/5/2018
|
$49.70
|
PP = $49.66
|
|
MB = $52.14
|
Most Recent Note - 3/8/2018 11:53:51 AM
G - Color code is changed to green after hitting a new all-time high and rising above its "max buy" level. Prior highs in the $49-47 area define initial support to watch on pullbacks. Recent quarterly comparisons through Dec '17 showed strong sales revenues growth acceleration and solid earnings increases versus the year-ago periods. Limited annual earnings (A criteria) history remains a concern, yet it had a profitable FY '16 following its $9 IPO in Nov '15.
>>> FEATURED STOCK ARTICLE : New High & Considerable Gain Backed By Twice Average Volume - 3/5/2018 |
View all notes |
Set NEW NOTE alert |
Company Profile |
SEC
News |
Chart |
Request a new note
C
A
S
I |
SEND
-
NYSE
Sendgrid Inc
INTERNET - Content
|
$30.53
|
+0.51
1.70% |
$31.08
|
226,279
96.70% of 50 DAV
50 DAV is 234,000
|
$30.13
1.33%
|
3/6/2018
|
$28.00
|
PP = $28.37
|
|
MB = $29.79
|
Most Recent Note - 3/6/2018 5:50:16 PM
Y - Hit a new high with +80% above average volume behind its gain, triggering a technical buy signal while rising from a 9-week cup-with-high-handle pattern. Finished strong after highlighted in yellow in the earlier mid-day report (read here) with pivot point cited based on its 2/27/18 high. Showed strong sales revenues and earnings increases in quarterly comparisons through Dec '17. Had a profitable FY '17 after years of shrinking losses. Concerns remain due to its limited annual earnings (A criteria) history since its $16 IPO on 11/15/17. See the latest FSU analysis for more details and a new annotated graph.
>>> FEATURED STOCK ARTICLE : Recently Profitable Internet - Content Firm Rallied to New High - 3/6/2018 |
View all notes |
Set NEW NOTE alert |
Company Profile |
SEC
News |
Chart |
Request a new note
C
A
S
I |
|
|
|
THESE ARE NOT BUY RECOMMENDATIONS!
Comments contained in the body of this report are technical
opinions only. The material herein has been obtained
from sources believed to be reliable and accurate, however,
its accuracy and completeness cannot be guaranteed.
This site is not an investment advisor, hence it does
not endorse or recommend any securities or other investments.
Any recommendation contained in this report may not
be suitable for all investors and it is not to be deemed
an offer or solicitation on our part with respect to
the purchase or sale of any securities. All trademarks,
service marks and trade names appearing in this report
are the property of their respective owners, and are
likewise used for identification purposes only.
This report is a service available
only to active Paid Premium Members.
You may opt-out of receiving report notifications
at any time. Questions or comments may be submitted
by writing to Premium Membership Services 665 S.E. 10 Street, Suite 201 Deerfield Beach, FL 33441-5634 or by calling 1-800-965-8307
or 954-785-1121.
|
|
|

