***Last / Change / Volume data in this table is the closing quote data***
Symbol/Exchange
Company Name
Industry Group |
PRICE |
CHANGE
(%Change) |
Day High |
Volume
(% DAV)
(% 50 day avg vol) |
52 Wk Hi
% From Hi |
Featured
Date |
Price
Featured |
Pivot Featured |
|
Max Buy |
TPL
-
NYSE
Texas Pacific Land Trust
FINANCIAL SERVICES - Diversified Investments
|
$507.73
|
+1.99
0.39% |
$533.69
|
21,393
118.85% of 50 DAV
50 DAV is 18,000
|
$569.99
-10.92%
|
2/20/2018
|
$517.00
|
PP = $569.99
|
|
MB = $598.49
|
 Most Recent Note - 2/20/2018 2:50:47 PM
Y - Color code is changed to yellow as a valid secondary buy point exists up to +5% above the latest high after it successfully tested the 10 week moving average (WMA) line following an earlier technical breakout. Reported earnings +29% on +118% sales revenues for the Dec '17 quarter.
>>> FEATURED STOCK ARTICLE : Considerable Gains in First 2-3 Weeks After Recent Breakout - 1/23/2018 |
View all notes |
Set NEW NOTE alert |
Company Profile |
SEC
News |
Chart |
Request a new note
C
A
S
I |
YY
-
NASDAQ
YY Inc
INTERNET - Internet Service Providers
|
$130.77
|
+1.84
1.43% |
$133.66
|
1,111,485
95.57% of 50 DAV
50 DAV is 1,163,000
|
$142.97
-8.53%
|
12/29/2017
|
$113.06
|
PP = $123.58
|
|
MB = $129.76
|
Most Recent Note - 2/20/2018 2:51:51 PM
G - Consolidating above its 50 DMA line ($123.34), but it has not formed a sound new base of sufficient length.
>>> FEATURED STOCK ARTICLE : Retreating After +78% Rally in 5 Months - 2/2/2018 |
View all notes |
Set NEW NOTE alert |
Company Profile |
SEC
News |
Chart |
Request a new note
C
A
S
I |
LOGM
-
NASDAQ
Logmein Inc
INTERNET - Internet Software andamp; Services
|
$117.40
|
-5.05
-4.12% |
$122.58
|
1,495,157
284.90% of 50 DAV
50 DAV is 524,800
|
$134.80
-12.91%
|
2/15/2018
|
$132.35
|
PP = $129.61
|
|
MB = $136.09
|
Most Recent Note - 2/20/2018 2:18:55 PM
G - Color code is changed to green while slumping below its 50 DMA line ($120.34) with above average volume behind another loss today raising greater concerns. Only a prompt rebound above the 50 DMA line would help its outlook improve.
>>> FEATURED STOCK ARTICLE : Technical Breakout Came Ahead of Earnings News - 2/15/2018 |
View all notes |
Set NEW NOTE alert |
Company Profile |
SEC
News |
Chart |
Request a new note
C
A
S
I |
HTHT
-
NASDAQ
China Lodging Group Ads
LEISURE - Lodging
|
$153.52
|
+6.53
4.44% |
$158.68
|
495,996
77.86% of 50 DAV
50 DAV is 637,000
|
$166.19
-7.62%
|
12/22/2017
|
$138.07
|
PP = $142.90
|
|
MB = $150.05
|
Most Recent Note - 2/20/2018 2:45:11 PM
G - Still consolidating above its 50 DMA line ($143.28), but it has not formed a sound base of sufficient length. More damaging losses below the prior low ($128.60 on 2/09/18) the would raise greater concerns.
>>> FEATURED STOCK ARTICLE : Found Support Above Prior High After Latest Breakout - 1/24/2018 |
View all notes |
Set NEW NOTE alert |
Company Profile |
SEC
News |
Chart |
Request a new note
C
A
S
I |
PETS
-
NASDAQ
Petmed Express Inc
RETAIL - Drug Stores
|
$45.69
|
+1.52
3.44% |
$46.80
|
648,171
90.40% of 50 DAV
50 DAV is 717,000
|
$57.80
-20.95%
|
1/19/2018
|
$53.59
|
PP = $51.00
|
|
MB = $53.55
|
Most Recent Note - 2/20/2018 2:46:52 PM
G - Rebounding near its 50 DMA ($46.48) line. A rebound above the 50 DMA line is needed to help its outlook improve. Recently reported earnings +83% on +14% sales revenues, continuing its strong earnings track record.
>>> FEATURED STOCK ARTICLE : Sputtering Below 50-Day Average After Negative Reversal - 2/14/2018 |
View all notes |
Set NEW NOTE alert |
Company Profile |
SEC
News |
Chart |
Request a new note
C
A
S
I |
Symbol/Exchange
Company Name
Industry Group |
PRICE |
CHANGE
(%Change) |
Day High |
Volume
(% DAV)
(% 50 day avg vol) |
52 Wk Hi
% From Hi |
Featured
Date |
Price
Featured |
Pivot Featured |
|
Max Buy |
DPZ
-
NYSE
Dominos Pizza Inc
WHOLESALE - Food Wholesale
|
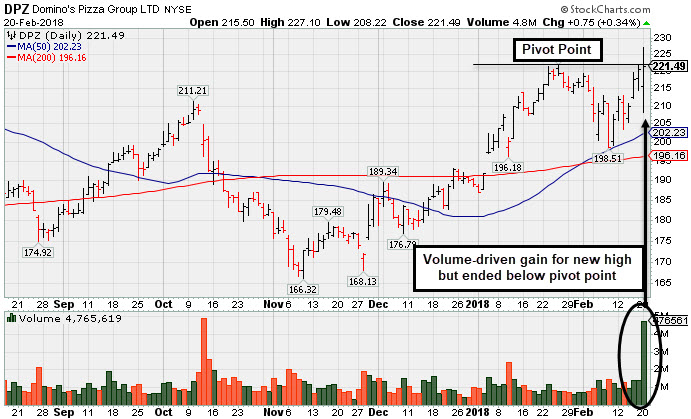
$221.49
|
+0.75
0.34% |
$227.10
|
4,765,619
478.48% of 50 DAV
50 DAV is 996,000
|
$221.92
-0.19%
|
2/20/2018
|
$224.86
|
PP = $222.01
|
|
MB = $233.11
|
Most Recent Note - 2/20/2018 5:41:38 PM
Y - Finished the session below the pivot point after highlighted in the earlier mid-day report in yellow with pivot point cited based on its 1/25/18 high plus 10 cents. Hit a new all-time high with heavy volume behind today's 4th consecutive gain. Reported Dec '17 earnings +31% on +9% sales revenues. That marked its 6th consecutive quarterly comparison above the +25% minimum earnings guideline (C criteria). Annual earnings (A criteria) growth has been good. See the latest FSU analysis for more details and a new annotated graph.
>>> FEATURED STOCK ARTICLE : Popular Pizza Firm Met Resistance Near Prior High - 2/20/2018 |
View all notes |
Set NEW NOTE alert |
Company Profile |
SEC
News |
Chart |
Request a new note
C
A
S
I |
ESNT
-
NYSE
Essent Group Ltd
Finance-MrtgandRel Svc
|
$46.84
|
-0.39
-0.83% |
$47.39
|
455,529
66.21% of 50 DAV
50 DAV is 688,000
|
$50.08
-6.47%
|
10/9/2017
|
$39.75
|
PP = $41.54
|
|
MB = $43.62
|
Most Recent Note - 2/14/2018 7:57:44 PM
G - Rebounded above its 50 DMA line ($46.11) with today's 4th consecutive volume-driven gain since slumping near its 200 DMA line ($40.94). More damaging losses would raise greater concerns. Reported earnings +16% on +27% sales revenues for the Dec '17 quarter, below the +25% minimum earnings guideline (C criteria), raising fundamental concerns.
>>> FEATURED STOCK ARTICLE : Slumped Below 50-Day Average With Earnings News Due Friday - 2/6/2018 |
View all notes |
Set NEW NOTE alert |
Company Profile |
SEC
News |
Chart |
Request a new note
C
A
S
I |
FIVE
-
NASDAQ
Five Below Inc
Retail-DiscountandVariety
|
$65.41
|
-1.51
-2.26% |
$66.89
|
1,124,669
103.37% of 50 DAV
50 DAV is 1,088,000
|
$73.55
-11.07%
|
1/2/2018
|
$69.16
|
PP = $68.99
|
|
MB = $72.44
|
Most Recent Note - 2/14/2018 8:00:50 PM
G - Posted a gain today with light volume. A rebound above the 50 DMA line ($66.38) is needed for its outlook to improve. See the latest FSU analysis for more details and an annotated graph.
>>> FEATURED STOCK ARTICLE : Rebound Above 50-day Moving Average is Needed to Help Outlook - 2/12/2018 |
View all notes |
Set NEW NOTE alert |
Company Profile |
SEC
News |
Chart |
Request a new note
C
A
S
I |
MDXG
-
NASDAQ
MiMedx Group Inc
Medical-Products
|
$8.75
|
-5.72
-39.53% |
$10.43
|
21,782,268
1,141.03% of 50 DAV
50 DAV is 1,909,000
|
$18.25
-52.05%
|
1/29/2018
|
$17.43
|
PP = $17.57
|
|
MB = $18.45
|
Most Recent Note - 2/20/2018 5:42:44 PM
It will be dropped from the Featured Stocks list tonight. Gapped down for a considerable loss today undercutting the prior low. Concerns were raised after it negated the recent breakout and slumped into the prior base. Disciplined investors always limit losses by selling any stock that falls more than -7% from their purchase price.
>>> FEATURED STOCK ARTICLE : Hit a New High With it 6th Consecutive Gain - 1/29/2018 |
View all notes |
Set NEW NOTE alert |
Company Profile |
SEC
News |
Chart |
Request a new note
C
A
S
I |
SPLK
-
NASDAQ
Splunk Inc
Computer Sftwr-Database
|
$93.68
|
+1.04
1.12% |
$94.90
|
1,431,511
94.80% of 50 DAV
50 DAV is 1,510,000
|
$97.27
-3.69%
|
2/15/2018
|
$96.06
|
PP = $93.68
|
|
MB = $98.36
|
Most Recent Note - 2/16/2018 7:08:16 PM
Y - Pulled back today after hitting new multi-year highs with 2 consecutive volume-driven gains. A valid secondary buy point exists up to +5% above the prior high since finding support at the 10 WMA after the prior breakout. Reported earnings +70% on +34% sales revenues for the Oct '17 quarter. Three of the past 4 quarterly comparisons showed strong earnings above the +25% minimum guideline (C criteria) and its annual earnings (A criteria) history has been strong since reaching profitability in FY '15. See the latest FSU analysis for more details and an annotated graph.
>>> FEATURED STOCK ARTICLE : Pulled Back to 10-Week Moving Average After Technical Breakout - 2/16/2018 |
View all notes |
Set NEW NOTE alert |
Company Profile |
SEC
News |
Chart |
Request a new note
C
A
S
I |
Symbol/Exchange
Company Name
Industry Group |
PRICE |
CHANGE
(%Change) |
Day High |
Volume
(% DAV)
(% 50 day avg vol) |
52 Wk Hi
% From Hi |
Featured
Date |
Price
Featured |
Pivot Featured |
|
Max Buy |
ANET
-
NYSE
Arista Networks Inc
TELECOMMUNICATIONS - Communication Equipment
|
$249.65
|
+0.16
0.06% |
$253.28
|
2,251,272
220.50% of 50 DAV
50 DAV is 1,021,000
|
$311.67
-19.90%
|
1/8/2018
|
$248.88
|
PP = $245.75
|
|
MB = $258.04
|
Most Recent Note - 2/16/2018 11:36:27 AM
G - Gapped down today for a considerable volume-driven loss undercutting its 50 DMA line ($254.54) and raising concerns. Prior highs in the $245 area define the next important support. Reported earnings +64% on +43% sales revenues for the Dec '17 quarter. Volume and volatility often increase near earnings news.
>>> FEATURED STOCK ARTICLE : Consolidating After Getting Extended From its Prior High - 1/31/2018 |
View all notes |
Set NEW NOTE alert |
Company Profile |
SEC
News |
Chart |
Request a new note
C
A
S
I |
PAYC
-
NYSE
Paycom Software Inc
COMPUTER SOFTWARE and SERVICES - Application Software
|
$95.76
|
+0.86
0.91% |
$97.11
|
722,615
103.68% of 50 DAV
50 DAV is 697,000
|
$96.59
-0.86%
|
2/15/2018
|
$95.01
|
PP = $93.61
|
|
MB = $98.29
|
Most Recent Note - 2/15/2018 5:58:32 PM
Y - Color code is changed to yellow while a valid "secondary buy point" exists up to +5% above the latest high. Found prompt support at its 10-week moving average following the prior breakout. Recently reported Dec '17 quarterly earnings +61% on +30% sales revenues after the close, continuing its strong earnings track record.
>>> FEATURED STOCK ARTICLE : Fell Below 50 Day Average With Losses on Above Average Volume - 2/8/2018 |
View all notes |
Set NEW NOTE alert |
Company Profile |
SEC
News |
Chart |
Request a new note
C
A
S
I |
GRUB
-
NYSE
Grubhub Inc
COMPUTER SOFTWARE and SERVICES - Technical and System Software
|
$97.05
|
+1.12
1.17% |
$99.32
|
1,601,225
91.24% of 50 DAV
50 DAV is 1,755,000
|
$96.58
0.49%
|
6/21/2017
|
$47.33
|
PP = $46.94
|
|
MB = $49.29
|
Most Recent Note - 2/14/2018 7:52:11 PM
G - Rallied for a new high close with today's big volume-driven gain, getting more extended from any sound base. Recently reported earnings +61% on +49% sales revenues for the Dec '17 quarter.
>>> FEATURED STOCK ARTICLE : Slumped Below 50-Day Average With Earnings News Due - 2/7/2018 |
View all notes |
Set NEW NOTE alert |
Company Profile |
SEC
News |
Chart |
Request a new note
C
A
S
I |
HQY
-
NASDAQ
Healthequity Inc
COMPUTER SOFTWARE and SERVICES - Healthcare Information Service
|
$55.92
|
+1.06
1.93% |
$56.81
|
1,099,888
186.74% of 50 DAV
50 DAV is 589,000
|
$55.34
1.05%
|
2/20/2018
|
$56.37
|
PP = $55.41
|
|
MB = $58.18
|
Most Recent Note - 2/20/2018 2:16:15 PM
Y - Color code is changed to yellow with new pivot point cited based on its 11/06/17 high plus 10 cents. Hitting a new all-time high with today's 8th consecutive gain backed by above average volume. Fundamentals remain strong, with earnings +70% on +31% sales revenues for the Oct '17 quarter. Rebounded gradually since dropped from the Featured Stocks list on 12/08/17.
>>> FEATURED STOCK ARTICLE : Sank Below 50-Day Moving Average With Loss on Higher Volume - 12/4/2017 |
View all notes |
Set NEW NOTE alert |
Company Profile |
SEC
News |
Chart |
Request a new note
C
A
S
I |
PYPL
-
NASDAQ
Paypal Holdings Inc
Finance-CrdtCard/PmtPr
|
$77.06
|
-1.31
-1.67% |
$78.54
|
6,839,591
70.45% of 50 DAV
50 DAV is 9,709,000
|
$86.32
-10.73%
|
2/1/2018
|
$80.35
|
PP = $79.49
|
|
MB = $83.46
|
Most Recent Note - 2/14/2018 7:37:53 PM
G - Posted a gain today and closed near its 50 DMA line ($77.31) helping its outlook improve. More damaging losses below the recent low ($71.63 on 2/09/18) would raise concerns and trigger a more worrisome technical sell signal.
>>> FEATURED STOCK ARTICLE : Gap Down Following Earnings News Tests Important Support Level - 2/1/2018 |
View all notes |
Set NEW NOTE alert |
Company Profile |
SEC
News |
Chart |
Request a new note
C
A
S
I |
Symbol/Exchange
Company Name
Industry Group |
PRICE |
CHANGE
(%Change) |
Day High |
Volume
(% DAV)
(% 50 day avg vol) |
52 Wk Hi
% From Hi |
Featured
Date |
Price
Featured |
Pivot Featured |
|
Max Buy |
OLLI
-
NASDAQ
Ollie's Bargain Outlet
Retail-DiscountandVariety
|
$55.00
|
-1.55
-2.74% |
$56.55
|
380,885
63.80% of 50 DAV
50 DAV is 597,000
|
$58.50
-5.98%
|
11/21/2017
|
$46.78
|
PP = $47.00
|
|
MB = $49.35
|
Most Recent Note - 2/20/2018 2:43:02 PM
G - Still quietly consolidating above its 50 DMA line ($53.73). Prior low ($50.15 on 1/04/18) defines the next important near-term support.
>>> FEATURED STOCK ARTICLE : Consolidating Above 50-Day Moving Average Line - 2/13/2018 |
View all notes |
Set NEW NOTE alert |
Company Profile |
SEC
News |
Chart |
Request a new note
C
A
S
I |
WB
-
NASDAQ
Weibo Corp Cl A Ads
INTERNET - Content
|
$133.90
|
-0.84
-0.62% |
$136.50
|
1,841,511
101.24% of 50 DAV
50 DAV is 1,819,000
|
$142.12
-5.78%
|
1/16/2018
|
$126.33
|
PP = $122.21
|
|
MB = $128.32
|
Most Recent Note - 2/15/2018 2:27:58 PM
G - Hit new all-time highs with 4 consecutive gains backed by above average volume, rallying further above its "max buy" level. Recently reported earnings +88% on +77% sales revenues for the Dec '17 quarter, continuing its strong earnings track record.
>>> FEATURED STOCK ARTICLE : Consolidating Near 50-Day Average With Earnings News Due - 2/9/2018 |
View all notes |
Set NEW NOTE alert |
Company Profile |
SEC
News |
Chart |
Request a new note
C
A
S
I |
HLI
-
NYSE
Houlihan Lokey Inc Cl A
Finance-Invest Bnk/Bkrs
|
$46.48
|
+0.32
0.69% |
$47.07
|
214,919
94.68% of 50 DAV
50 DAV is 227,000
|
$52.81
-11.99%
|
1/3/2018
|
$45.88
|
PP = $47.09
|
|
MB = $49.44
|
Most Recent Note - 2/14/2018 7:44:41 PM
G - Consolidating near its 50 DMA line ($47.16). The recent low ($43.73 on 2/06/18) defines near term support where a violation would raise greater concerns. Recently reported earnings +21% on +5% sales revenues for the Dec '17 quarter, below the +25% minimum earnings guideline (C criteria), raising fundamental concerns. On 10/26/17 it completed a Secondary Offering.
>>> FEATURED STOCK ARTICLE : Damaging Violation of 50-Day Moving Average Line - 2/5/2018 |
View all notes |
Set NEW NOTE alert |
Company Profile |
SEC
News |
Chart |
Request a new note
C
A
S
I |