You are not logged in.
This means you
CAN ONLY VIEW reports that were published prior to Sunday, April 6, 2025.
You
MUST UPGRADE YOUR MEMBERSHIP if you want to see any current reports.
AFTER MARKET UPDATE - MONDAY, MARCH 5TH, 2018
Previous After Market Report Next After Market Report >>>
|
|
|
|
DOW |
+336.70 |
24,874.76 |
+1.37% |
|
Volume |
893,921,400 |
-3% |
|
Volume |
2,080,626,690 |
-9% |
|
NASDAQ |
+72.83 |
7,330.70 |
+1.00% |
|
Advancers |
2,159 |
74% |
|
Advancers |
2,018 |
69% |
|
S&P 500 |
+29.69 |
2,720.94 |
+1.10% |
|
Decliners |
770 |
26% |
|
Decliners |
921 |
31% |
|
Russell 2000 |
+12.88 |
1,546.05 |
+0.84% |
|
52 Wk Highs |
47 |
|
|
52 Wk Highs |
119 |
|
|
S&P 600 |
+6.78 |
939.46 |
+0.73% |
|
52 Wk Lows |
41 |
|
|
52 Wk Lows |
28 |
|
|
 |
Leadership Improved as Indices Rose With Less Volume Conviction
Kenneth J. Gruneisen - Passed the CAN SLIM® Master's Exam
Stocks finished higher Monday. The Dow climbed 336 points to 24874. The S&P 500 added 29 points to 2720 while the Nasdaq Composite advanced 72 points to 7330. The volume totals reported were lighter than the prior session totals on the NYSE and on the Nasdaq exchange. Advancers led decliners by near a 3-1 margin on the NYSE and by more than 2-1 on the Nasdaq exchange. Leadership improved as new 52-week highs outnumbered new 52-week lows totals on both the Nasdaq exchange and the NYSE. There were 39 high-ranked companies from the Leaders List that made new 52-week highs and were listed on the BreakOuts Page, versus the total of 19 on the prior session. Charts used courtesy of www.stockcharts.com
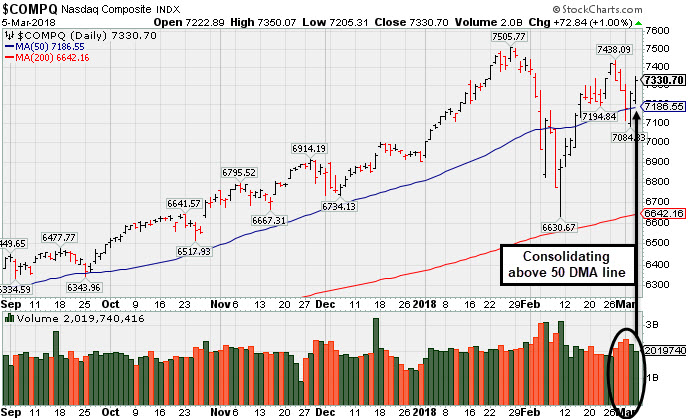 PICTURED: The Nasdaq Composite Index is consolidating above its 50-day moving average (DMA) line. The major indices (M criteria) have seen the latest uptrend come under pressure as several distribution days were noted. New buying efforts may be justified under the fact-based investment system, however, only when all key criteria of the fact-based investment system are satisfied. The Featured Stocks Pageprovides the latest analysis on noteworthy high-ranked leaders.
U.S. equities rebounded from early session losses as investor worries surrounding protectionist trade rhetoric subsided. Stocks sold off last week following the announcement of tariffs on steel and aluminum, but this morning President Trump opened the door for a removal of the levies on Mexico and Canada if a new NAFTA agreement can be reached. On the data front, the ISM’s Non-Manufacturing Composite showed that services sector activity came in at 59.5 in February, above consensus expectations of 59.0.
All 11 sectors in the S&P 500 finished higher. Financials paced gains with Goldman Sachs (GS +1.94%) and JP Morgan Chase & Co (JPM +1.54%) both rising. Industrials also outperformed with General Electric (GE +2.12%) up while Caterpillar (CAT +3.24%) erased earlier losses to finish higher. In M&A news, insurer XL Group (XL +29.15%) gapped up after agreeing to be acquired by France’s AXA (AXAHY -9.64%) for $15.3 billion.
Treasuries weakened with the yield on the 10-year note rising two basis points to 2.88%. In commodities, NYMEX WTI crude jumped 2.2% to $62.59/barrel following reports that stockpiles in Cushing, Oklahoma have reached the lowest level since 2014. COMEX gold was off 0.3% to $1320.10/ounce amid a stronger dollar. |
 Kenneth J. Gruneisen started out as a licensed stockbroker in August 1987, a couple of months prior to the historic stock market crash that took the Dow Jones Industrial Average down -22.6% in a single day. He has published daily fact-based fundamental and technical analysis on high-ranked stocks online for two decades. Through FACTBASEDINVESTING.COM, Kenneth provides educational articles, news, market commentary, and other information regarding proven investment systems that work in good times and bad.
Comments contained in the body of this report are technical opinions only and are not necessarily those of Gruneisen Growth Corp. The material herein has been obtained from sources believed to be reliable and accurate, however, its accuracy and completeness cannot be guaranteed. Our firm, employees, and customers may effect transactions, including transactions contrary to any recommendation herein, or have positions in the securities mentioned herein or options with respect thereto. Any recommendation contained in this report may not be suitable for all investors and it is not to be deemed an offer or solicitation on our part with respect to the purchase or sale of any securities. |
|
 |
Financial, Retail, Tech and Commodity-Linked Groups Rose
Kenneth J. Gruneisen - Passed the CAN SLIM® Master's Exam
On Monday the Retail Index ($RLX +1.57%), Bank Index ($BKX +1.19%) and the Broker/Dealer Index ($XBD +2.18%) finished unanimously higher. The tech sector had a positive bias as the Biotechnology Index ($BTK +1.36%), Networking Index ($NWX +1.04%), and the Semiconductor Index ($SOX +0.89%) also posted unanimous gains. The Oil Services Index ($OSX +1.80%), Integrated Oil Index ($XOI +0.96%), and the Gold & Silver Index ($XAU +0.44%) rose. Charts courtesy wwwstockcharts.com
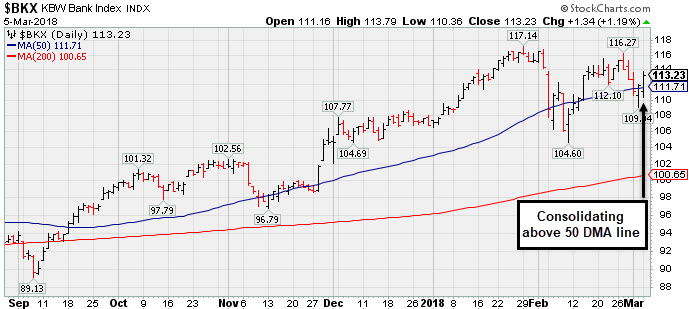 PICTURED: The Bank Index ($BKX +1.19%) is consolidating above support at its 50-day moving average (DMA) line.
| Oil Services |
$OSX |
137.72 |
+2.44 |
+1.80% |
-7.91% |
| Integrated Oil |
$XOI |
1,292.22 |
+12.23 |
+0.96% |
-3.24% |
| Semiconductor |
$SOX |
1,375.86 |
+12.08 |
+0.89% |
+9.80% |
| Networking |
$NWX |
531.91 |
+5.48 |
+1.04% |
+8.44% |
| Broker/Dealer |
$XBD |
288.52 |
+6.15 |
+2.18% |
+8.78% |
| Retail |
$RLX |
1,999.64 |
+30.91 |
+1.57% |
+15.33% |
| Gold & Silver |
$XAU |
79.10 |
+0.35 |
+0.44% |
-7.24% |
| Bank |
$BKX |
113.23 |
+1.33 |
+1.19% |
+6.11% |
| Biotech |
$BTK |
4,720.34 |
+63.56 |
+1.36% |
+11.80% |
|
|
|
 |
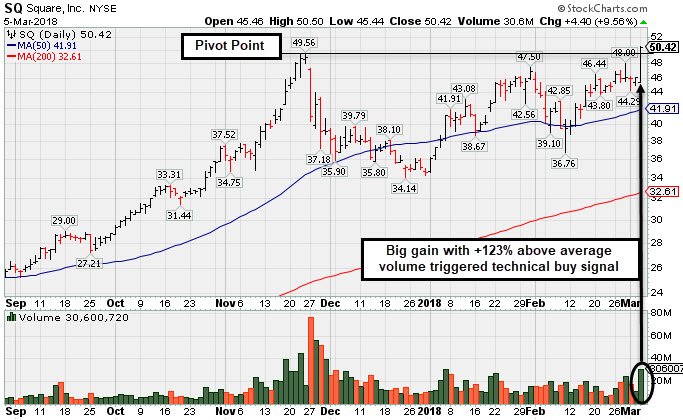
New High & Considerable Gain Backed By Twice Average Volume
Kenneth J. Gruneisen - Passed the CAN SLIM® Master's Exam
Square Inc Cl A (SQ +$4.40 or +9.56% to $50.42) finished strong after highlighted in yellow with pivot point cited based on its 11/24/17 high plus 10 cents in the earlier mid-day report (read here). It hit a new all-time high today and triggered a technical buy signal with +108% above average volume while rising from a choppy "late-stage" base.
Recent quarterly comparisons through Dec '17 showed strong sales revenues growth acceleration and solid earnings increases versus the year-ago periods. Sales revenues rose by +21%, +22%, +26%, +33%, and +36% in the Dec 16, Mar, Jun, Sep and Dec '17 quarterly comparisons versus the year ago periods, respectively. Its limited annual earnings (A criteria) history remains a concern, yet it had a profitable FY '16 and bigger FY '17 following its $9 IPO in Nov '15.
The number of top-rated funds owning its shares rose from 314 in Mar '17 to 609 in Dec '17, a reassuring sign concerning the I criteria. Its current Up/Down Volume Ratio of 1.3 is also an unbiased indication its shares have been under accumulation over the past 50 days. It has a Timeliness Rating of A and Sponsorship rating of B.
|
|
|
Color Codes Explained :
Y - Better candidates highlighted by our
staff of experts.
G - Previously featured
in past reports as yellow but may no longer be buyable under the
guidelines.
***Last / Change / Volume data in this table is the closing quote data***
Symbol/Exchange
Company Name
Industry Group |
PRICE |
CHANGE
(%Change) |
Day High |
Volume
(% DAV)
(% 50 day avg vol) |
52 Wk Hi
% From Hi |
Featured
Date |
Price
Featured |
Pivot Featured |
|
Max Buy |
TPL
-
NYSE
Texas Pacific Land Trust
FINANCIAL SERVICES - Diversified Investments
|
$524.63
|
+4.57
0.88% |
$543.45
|
14,537
76.51% of 50 DAV
50 DAV is 19,000
|
$569.99
-7.96%
|
2/20/2018
|
$517.00
|
PP = $569.99
|
|
MB = $598.49
|
 Most Recent Note - 3/5/2018 7:06:06 PM
Y -Posted a small gain today while consolidating in an orderly fashion above its 50 DMA line ($503.41). A valid secondary buy point exists up to +5% above the latest high after it successfully tested the 10 week moving average (WMA) line following an earlier technical breakout. Reported earnings +29% on +118% sales revenues for the Dec '17 quarter.
>>> FEATURED STOCK ARTICLE : Finding Support Above 50-Day Moving Average Line - 2/22/2018 |
View all notes |
Set NEW NOTE alert |
Company Profile |
SEC
News |
Chart |
Request a new note
C
A
S
I |
YY
-
NASDAQ
YY Inc
INTERNET - Internet Service Providers
|
$135.42
|
+1.64
1.23% |
$136.84
|
2,202,482
195.26% of 50 DAV
50 DAV is 1,128,000
|
$142.97
-5.28%
|
12/29/2017
|
$113.06
|
PP = $123.58
|
|
MB = $129.76
|
Most Recent Note - 3/5/2018 12:52:10 PM
G - Due to report earnings news after the close today, and volume and volatility often increase near earnings news. Found support when recently consolidating near its 50 DMA line ($127.38), however it has not formed a sound base pattern. See the latest FSU analysis for more details and a new annotated graph.
>>> FEATURED STOCK ARTICLE : Earnings News Due Next Week for Chinese Social Platform - 2/27/2018 |
View all notes |
Set NEW NOTE alert |
Company Profile |
SEC
News |
Chart |
Request a new note
C
A
S
I |
LOGM
-
NASDAQ
Logmein Inc
INTERNET - Internet Software andamp; Services
|
$122.25
|
+2.80
2.34% |
$122.95
|
540,769
88.26% of 50 DAV
50 DAV is 612,700
|
$134.80
-9.31%
|
2/15/2018
|
$132.35
|
PP = $129.61
|
|
MB = $136.09
|
Most Recent Note - 3/5/2018 7:09:41 PM
G - Rebounded and closed above the 50 DMA line ($120.37) today helping its outlook improve. Its Relative Strength rating is 74, still below the 80+ minimum guideline for buy candidates. Found support recently at its 200 DMA line.
>>> FEATURED STOCK ARTICLE : Technical Breakout Came Ahead of Earnings News - 2/15/2018 |
View all notes |
Set NEW NOTE alert |
Company Profile |
SEC
News |
Chart |
Request a new note
C
A
S
I |
HTHT
-
NASDAQ
China Lodging Group Ads
LEISURE - Lodging
|
$148.16
|
-3.90
-2.56% |
$151.07
|
392,265
71.32% of 50 DAV
50 DAV is 550,000
|
$166.19
-10.85%
|
12/22/2017
|
$138.07
|
PP = $142.90
|
|
MB = $150.05
|
Most Recent Note - 3/2/2018 10:15:37 AM
G - It has not formed a sound base and it gapped down today undercutting its 50 DMA line ($148), raising concerns. A rebound above that short-term average is needed for its outlook to improve.
>>> FEATURED STOCK ARTICLE : Repaired Recent Technical Damage But Has Not Formed a New Base - 2/23/2018 |
View all notes |
Set NEW NOTE alert |
Company Profile |
SEC
News |
Chart |
Request a new note
C
A
S
I |
PETS
-
NASDAQ
Petmed Express Inc
RETAIL - Drug Stores
|
$44.87
|
+0.19
0.43% |
$45.07
|
291,555
41.12% of 50 DAV
50 DAV is 709,000
|
$57.80
-22.37%
|
1/19/2018
|
$53.59
|
PP = $51.00
|
|
MB = $53.55
|
Most Recent Note - 3/1/2018 5:31:41 PM
G - Slumped further below its 50 DMA line ($46.83) today. Faces resistance due to overhead supply up to the $57 level. Recently reported earnings +83% on +14% sales revenues, continuing its strong earnings track record.
>>> FEATURED STOCK ARTICLE : Sputtering Below 50-Day Average After Negative Reversal - 2/14/2018 |
View all notes |
Set NEW NOTE alert |
Company Profile |
SEC
News |
Chart |
Request a new note
C
A
S
I |
Symbol/Exchange
Company Name
Industry Group |
PRICE |
CHANGE
(%Change) |
Day High |
Volume
(% DAV)
(% 50 day avg vol) |
52 Wk Hi
% From Hi |
Featured
Date |
Price
Featured |
Pivot Featured |
|
Max Buy |
DPZ
-
NYSE
Dominos Pizza Inc
WHOLESALE - Food Wholesale
|
$219.61
|
-3.49
-1.56% |
$222.36
|
929,564
83.90% of 50 DAV
50 DAV is 1,108,000
|
$236.00
-6.94%
|
2/20/2018
|
$224.86
|
PP = $222.01
|
|
MB = $233.11
|
Most Recent Note - 3/5/2018 6:58:52 PM
Y - Quietly sputtering below its pivot point raising concerns. Tallied big gains then stalled after highlighted in the 2/20/18 mid-day report with pivot point cited based on its 1/25/18 high plus 10 cents.
>>> FEATURED STOCK ARTICLE : Popular Pizza Firm Met Resistance Near Prior High - 2/20/2018 |
View all notes |
Set NEW NOTE alert |
Company Profile |
SEC
News |
Chart |
Request a new note
C
A
S
I |
ESNT
-
NYSE
Essent Group Ltd
Finance-MrtgandRel Svc
|
$45.40
|
-0.06
-0.13% |
$45.76
|
425,776
67.02% of 50 DAV
50 DAV is 635,300
|
$50.08
-9.35%
|
10/9/2017
|
$39.75
|
PP = $41.54
|
|
MB = $43.62
|
Most Recent Note - 3/5/2018 6:59:58 PM
G - Quietly sputtering below its 50 DMA line ($46.23). Tested support near its 200 DMA line recently. More damaging losses would raise greater concerns. Reported earnings +16% on +27% sales revenues for the Dec '17 quarter, below the +25% minimum earnings guideline (C criteria), raising fundamental concerns.
>>> FEATURED STOCK ARTICLE : Sputtering ESNBelow 50-Day Moving Average Line - 3/2/2018 |
View all notes |
Set NEW NOTE alert |
Company Profile |
SEC
News |
Chart |
Request a new note
C
A
S
I |
FIVE
-
NASDAQ
Five Below Inc
Retail-DiscountandVariety
|
$69.70
|
+1.04
1.51% |
$69.87
|
808,142
79.15% of 50 DAV
50 DAV is 1,021,000
|
$73.55
-5.23%
|
1/2/2018
|
$69.16
|
PP = $68.99
|
|
MB = $72.44
|
Most Recent Note - 3/5/2018 7:02:30 PM
Y - Color code is changed to yellow as it posted a 4th consecutive gain with below average volume, and its outlook has improved while consolidating above its 50 DMA line ($66.57). The recent low ($60.00 on 2/06/18) defines important near-term support to watch on pullbacks.
>>> FEATURED STOCK ARTICLE : Rebound Above 50-day Moving Average is Needed to Help Outlook - 2/12/2018 |
View all notes |
Set NEW NOTE alert |
Company Profile |
SEC
News |
Chart |
Request a new note
C
A
S
I |
SPLK
-
NASDAQ
Splunk Inc
Computer Sftwr-Database
|
$101.37
|
-0.95
-0.93% |
$102.80
|
3,849,191
249.95% of 50 DAV
50 DAV is 1,540,000
|
$102.61
-1.21%
|
2/15/2018
|
$96.06
|
PP = $93.68
|
|
MB = $98.36
|
Most Recent Note - 3/5/2018 12:33:59 PM
G - Hovering near its all-time high today. Gapped up hitting a new all-time high with a big volume-driven gain on the prior session and its color code was changed to green after rising above the "max buy" level. Bullish action came after it reported earnings +76% on +37% sales revenues for the quarter ended January 31, 2018 versus the year ago period.
>>> FEATURED STOCK ARTICLE : Pulled Back to 10-Week Moving Average After Technical Breakout - 2/16/2018 |
View all notes |
Set NEW NOTE alert |
Company Profile |
SEC
News |
Chart |
Request a new note
C
A
S
I |
PAYC
-
NYSE
Paycom Software Inc
COMPUTER SOFTWARE and SERVICES - Application Software
|
$104.32
|
+1.81
1.77% |
$105.05
|
772,142
108.60% of 50 DAV
50 DAV is 711,000
|
$102.71
1.57%
|
2/15/2018
|
$95.01
|
PP = $93.61
|
|
MB = $98.29
|
Most Recent Note - 3/1/2018 5:30:42 PM
G - Stubbornly holding its ground near its all-time high extended from any sound base. Prior highs in the $93 area define initial support above its 50 DMA line ($88.31). Fundamentals remain strong.
>>> FEATURED STOCK ARTICLE : Fell Below 50 Day Average With Losses on Above Average Volume - 2/8/2018 |
View all notes |
Set NEW NOTE alert |
Company Profile |
SEC
News |
Chart |
Request a new note
C
A
S
I |
Symbol/Exchange
Company Name
Industry Group |
PRICE |
CHANGE
(%Change) |
Day High |
Volume
(% DAV)
(% 50 day avg vol) |
52 Wk Hi
% From Hi |
Featured
Date |
Price
Featured |
Pivot Featured |
|
Max Buy |
GRUB
-
NYSE
Grubhub Inc
COMPUTER SOFTWARE and SERVICES - Technical and System Software
|
$101.98
|
+2.27
2.28% |
$102.65
|
1,195,856
66.77% of 50 DAV
50 DAV is 1,791,000
|
$101.03
0.94%
|
6/21/2017
|
$47.33
|
PP = $46.94
|
|
MB = $49.29
|
Most Recent Note - 3/5/2018 7:03:26 PM
G - Hit another new all-time high with today's quiet gain, getting very extended from any sound base. Recently reported earnings +61% on +49% sales revenues for the Dec '17 quarter. See the latest FSU analysis for more details and anannotated graph.
>>> FEATURED STOCK ARTICLE : Bullish Action Followed Last Earnings Report - 3/1/2018 |
View all notes |
Set NEW NOTE alert |
Company Profile |
SEC
News |
Chart |
Request a new note
C
A
S
I |
HQY
-
NASDAQ
Healthequity Inc
COMPUTER SOFTWARE and SERVICES - Healthcare Information Service
|
$57.71
|
+2.36
4.26% |
$58.19
|
640,275
104.11% of 50 DAV
50 DAV is 615,000
|
$58.28
-0.98%
|
2/20/2018
|
$56.37
|
PP = $55.41
|
|
MB = $58.18
|
Most Recent Note - 3/5/2018 7:08:02 PM
Y - Posted a big gain with average volume today for a best-ever close. Wider than usual intra-day price swings were noted as indicative of uncertainty since highlighted in the 2/20/18 mid-day report (read here). Fundamentals remain strong.
>>> FEATURED STOCK ARTICLE : Fundamentals Remained Favorable and Strength Returned - 2/21/2018 |
View all notes |
Set NEW NOTE alert |
Company Profile |
SEC
News |
Chart |
Request a new note
C
A
S
I |
PYPL
-
NASDAQ
Paypal Holdings Inc
Finance-CrdtCard/PmtPr
|
$79.07
|
+0.20
0.25% |
$79.42
|
6,652,646
68.56% of 50 DAV
50 DAV is 9,704,000
|
$86.32
-8.40%
|
2/1/2018
|
$80.35
|
PP = $79.49
|
|
MB = $83.46
|
Most Recent Note - 3/1/2018 5:32:45 PM
G - Consolidating near its 50 DMA line ($78.34). Subsequent losses below the recent low ($71.63 on 2/09/18) would raise concerns and trigger a more worrisome technical sell signal. Fundamentals remain strong.
>>> FEATURED STOCK ARTICLE : Quietly Consolidating Back Above 50-Day Moving Average - 2/26/2018 |
View all notes |
Set NEW NOTE alert |
Company Profile |
SEC
News |
Chart |
Request a new note
C
A
S
I |
OLLI
-
NASDAQ
Ollie's Bargain Outlet
Retail-DiscountandVariety
|
$59.60
|
-1.45
-2.38% |
$61.03
|
503,760
95.05% of 50 DAV
50 DAV is 530,000
|
$61.28
-2.73%
|
11/21/2017
|
$46.78
|
PP = $47.00
|
|
MB = $49.35
|
Most Recent Note - 3/1/2018 5:28:55 PM
G - Holding its ground stubbornly near its all-time high with volume totals cooling. Found prompt support near its 50 DMA line. Prior low ($50.15 on 1/04/18) defines the next important near-term support.
>>> FEATURED STOCK ARTICLE : Consolidating Above 50-Day Moving Average Line - 2/13/2018 |
View all notes |
Set NEW NOTE alert |
Company Profile |
SEC
News |
Chart |
Request a new note
C
A
S
I |
WB
-
NASDAQ
Weibo Corp Cl A Ads
INTERNET - Content
|
$131.28
|
+0.73
0.56% |
$132.18
|
1,555,905
83.07% of 50 DAV
50 DAV is 1,873,000
|
$142.12
-7.63%
|
1/16/2018
|
$126.33
|
PP = $122.21
|
|
MB = $128.32
|
Most Recent Note - 3/1/2018 5:34:34 PM
Y - Color code is changed to yellow after pulling back below its "max buy" level with light volume behind today's 4th consecutive loss. Recently reported earnings +88% on +77% sales revenues for the Dec '17 quarter, continuing its strong earnings track record.
>>> FEATURED STOCK ARTICLE : Consolidating Near 50-Day Average With Earnings News Due - 2/9/2018 |
View all notes |
Set NEW NOTE alert |
Company Profile |
SEC
News |
Chart |
Request a new note
C
A
S
I |
Symbol/Exchange
Company Name
Industry Group |
PRICE |
CHANGE
(%Change) |
Day High |
Volume
(% DAV)
(% 50 day avg vol) |
52 Wk Hi
% From Hi |
Featured
Date |
Price
Featured |
Pivot Featured |
|
Max Buy |
HLI
-
NYSE
Houlihan Lokey Inc Cl A
Finance-Invest Bnk/Bkrs
|
$45.70
|
+0.30
0.66% |
$45.98
|
181,944
83.08% of 50 DAV
50 DAV is 219,000
|
$52.81
-13.46%
|
1/3/2018
|
$45.88
|
PP = $47.09
|
|
MB = $49.44
|
Most Recent Note - 3/5/2018 7:04:34 PM
G - Met resistance recently and it remains below its 50 DMA line ($47.45). The recent low ($43.73 on 2/06/18) defines near term support where a violation would raise greater concerns. Earnings +21% for the Dec '17 quarter were below the +25% minimum earnings guideline (C criteria) raising fundamental concerns.
>>> FEATURED STOCK ARTICLE : Recently Met Resistance at 50-Day Moving Average - 2/28/2018 |
View all notes |
Set NEW NOTE alert |
Company Profile |
SEC
News |
Chart |
Request a new note
C
A
S
I |
SQ
-
NYSE
Square Inc Cl A
Finance-CrdtCard/PmtPr
|
$50.42
|
+4.40
9.56% |
$50.50
|
30,603,951
208.25% of 50 DAV
50 DAV is 14,696,000
|
$49.56
1.74%
|
3/5/2018
|
$49.70
|
PP = $49.66
|
|
MB = $52.14
|
Most Recent Note - 3/5/2018 6:56:29 PM
Y - Finished strong after highlighted in yellow with pivot point cited based on its 11/24/17 high plus 10 cents. Hit a new all-time high triggering a technical buy signal with today's big gain backed by more than twice average volume while rising from a choppy "late-stage" base. Recent quarterly comparisons through Dec '17 showed strong sales revenues growth acceleration and solid earnings increases versus the year-ago periods. Limited annual earnings (A criteria) history remains a concern, yet it had a profitable FY '16 following its $9 IPO in Nov '15. See the latest FSU analysis for more details and a new annotated graph.
>>> FEATURED STOCK ARTICLE : New High & Considerable Gain Backed By Twice Average Volume - 3/5/2018 |
View all notes |
Set NEW NOTE alert |
Company Profile |
SEC
News |
Chart |
Request a new note
C
A
S
I |
|
|
|
THESE ARE NOT BUY RECOMMENDATIONS!
Comments contained in the body of this report are technical
opinions only. The material herein has been obtained
from sources believed to be reliable and accurate, however,
its accuracy and completeness cannot be guaranteed.
This site is not an investment advisor, hence it does
not endorse or recommend any securities or other investments.
Any recommendation contained in this report may not
be suitable for all investors and it is not to be deemed
an offer or solicitation on our part with respect to
the purchase or sale of any securities. All trademarks,
service marks and trade names appearing in this report
are the property of their respective owners, and are
likewise used for identification purposes only.
This report is a service available
only to active Paid Premium Members.
You may opt-out of receiving report notifications
at any time. Questions or comments may be submitted
by writing to Premium Membership Services 665 S.E. 10 Street, Suite 201 Deerfield Beach, FL 33441-5634 or by calling 1-800-965-8307
or 954-785-1121.
|
|
|