You are not logged in.
This means you
CAN ONLY VIEW reports that were published prior to Thursday, March 20, 2025.
You
MUST UPGRADE YOUR MEMBERSHIP if you want to see any current reports.
AFTER MARKET UPDATE - WEDNESDAY, FEBRUARY 28TH, 2018
Previous After Market Report Next After Market Report >>>
|
|
|
|
DOW |
-380.83 |
25,029.20 |
-1.50% |
|
Volume |
1,102,346,940 |
+23% |
|
Volume |
2,372,653,900 |
+10% |
|
NASDAQ |
-57.34 |
7,273.01 |
-0.78% |
|
Advancers |
846 |
29% |
|
Advancers |
811 |
27% |
|
S&P 500 |
-30.45 |
2,713.83 |
-1.11% |
|
Decliners |
2,117 |
71% |
|
Decliners |
2,153 |
73% |
|
Russell 2000 |
-24.03 |
1,512.45 |
-1.56% |
|
52 Wk Highs |
41 |
|
|
52 Wk Highs |
62 |
|
|
S&P 600 |
-16.49 |
921.34 |
-1.76% |
|
52 Wk Lows |
124 |
|
|
52 Wk Lows |
74 |
|
|
 |
Breadth Negative and Volume Up as Indices Endure Distribution
Kenneth J. Gruneisen - Passed the CAN SLIM® Master's Exam
For the month of February, the Dow fell 4.3%, the S&P 500 lost 3.9% and the Nasdaq Composite declined 1.9%.Stocks fell sharply Wednesday. The Dow declined 381 points to 25029. The S&P 500 lost 30 points to 2713 and the Nasdaq Composite dropped 57 points to 7273. The volume totals reported were higher than the prior session totals on the NYSE and on the Nasdaq exchange, action indicative of greater distributional pressure. Decliners led advancers by more than a 2-1 margin on the NYSE and on the Nasdaq exchange. New 52-week highs totals contracted and were again outnumbered by rising new 52-week lows totals on both the Nasdaq exchange and the NYSE. There were 27 high-ranked companies from the Leaders List that made new 52-week highs and were listed on the BreakOuts Page, versus the total of 49 on the prior session. Charts used courtesy of www.stockcharts.com
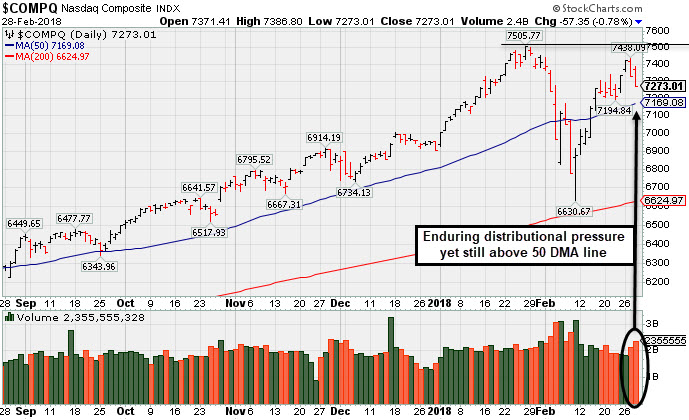 PICTURED: The Nasdaq Composite Index is consolidating above its 50-day moving average (DMA) line. The major indices (M criteria) have seen the latest uptrend come under pressure as several distribution days were noted. New buying efforts may be justified under the fact-based investment system, however, only when all key criteria of the fact-based investment system are satisfied. The Featured Stocks Pageprovides the latest analysis on noteworthy high-ranked leaders.
The major averages ended a volatile month on a down note attributed to concerns surrounding monetary policy. Yesterday during his testimony to lawmakers, Fed Chair Jerome Powell indicated the central bank could raise rates four times this year versus projections for three increases. On the data front, the Commerce Department revised fourth-quarter GDP to a 2.5% annualized rate from the prior 2.6% reading. Pending home sales unexpectedly declined 4.7% in January versus projections to edge up 0.5%.
All 11 S&P 500 sectors were down on the session led by Energy. Exxon (XOM -2.27%) and Chevron (CVX -1.49%) both fell amid a decline in oil prices. In earnings news, TJX Companies (TJX +6.95%) and Bookings Holdings (BKNG +6.77%) , formerly known as Priceline, climbed after both posted positive quarterly results. Lowe’s (LOW -6.47%) as profits missed consensus estimates.
Treasury yields were lower with the 10-year note down three basis points to 2.87%. In commodities, NYMEX WTI crude retreated 2.4% to $61.52/barrel after a report showed weekly U.S. inventories rose more-than-expected. COMEX gold gained 0.2% to $1318.80/ounce. |
 Kenneth J. Gruneisen started out as a licensed stockbroker in August 1987, a couple of months prior to the historic stock market crash that took the Dow Jones Industrial Average down -22.6% in a single day. He has published daily fact-based fundamental and technical analysis on high-ranked stocks online for two decades. Through FACTBASEDINVESTING.COM, Kenneth provides educational articles, news, market commentary, and other information regarding proven investment systems that work in good times and bad.
Comments contained in the body of this report are technical opinions only and are not necessarily those of Gruneisen Growth Corp. The material herein has been obtained from sources believed to be reliable and accurate, however, its accuracy and completeness cannot be guaranteed. Our firm, employees, and customers may effect transactions, including transactions contrary to any recommendation herein, or have positions in the securities mentioned herein or options with respect thereto. Any recommendation contained in this report may not be suitable for all investors and it is not to be deemed an offer or solicitation on our part with respect to the purchase or sale of any securities. |
|
 |
Retail Index Rose; Energy and Biotech Groups Led Decliners
Kenneth J. Gruneisen - Passed the CAN SLIM® Master's Exam
On Wednesday the Retail Index ($RLX +0.23%) edged higher but the Bank Index ($BKX -1.15%) and the Broker/Dealer Index ($XBD -0.93%) finished lower. The tech sector had a negative bias as the Semiconductor Index ($SOX -0.92%), Networking Index ($NWX -0.60%), and the Biotechnology Index ($BTK -2.06%) posted unanimous losses. Commodity-linked groups also fell as the Oil Services Index ($OSX -3.57%) and the Integrated Oil Index ($XOI -2.29%) outpaced the Gold & Silver Index ($XAU -0.89%) to the downside. Charts courtesy wwwstockcharts.com
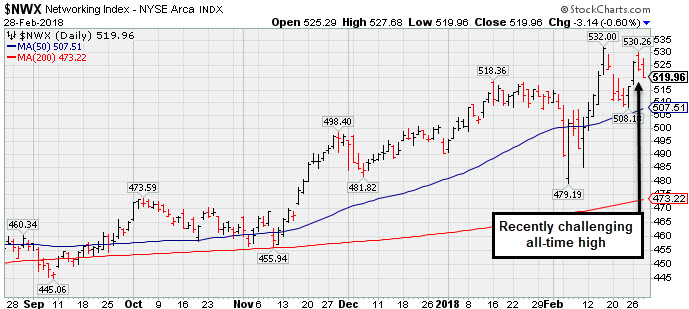 PICTURED: The Networking Index ($NWX -0.60%) recently challenged its all-time high after finding support above its 50-day moving average (DMA) line.
| Oil Services |
$OSX |
134.02 |
-4.96 |
-3.57% |
-10.38% |
| Integrated Oil |
$XOI |
1,275.25 |
-29.86 |
-2.29% |
-4.51% |
| Semiconductor |
$SOX |
1,362.02 |
-12.70 |
-0.92% |
+8.70% |
| Networking |
$NWX |
519.96 |
-3.14 |
-0.60% |
+6.00% |
| Broker/Dealer |
$XBD |
283.33 |
-2.66 |
-0.93% |
+6.82% |
| Retail |
$RLX |
1,982.19 |
+4.61 |
+0.23% |
+14.33% |
| Gold & Silver |
$XAU |
78.27 |
-0.70 |
-0.89% |
-8.21% |
| Bank |
$BKX |
112.70 |
-1.31 |
-1.15% |
+5.61% |
| Biotech |
$BTK |
4,576.21 |
-96.05 |
-2.06% |
+8.38% |
|
|
|
 |
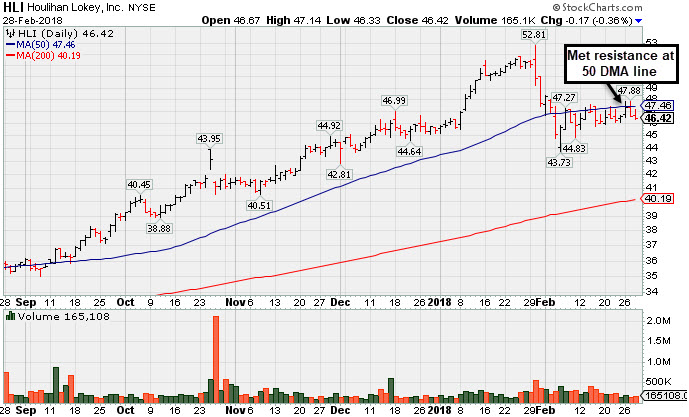
Recently Met Resistance at 50-Day Moving Average
Kenneth J. Gruneisen - Passed the CAN SLIM® Master's Exam
Houlihan Lokey Inc (HLI -$0.17 or -0.36% to $46.42) has recently been meeting resistance while consolidating near its 50-day moving average (DMA) line ($47.46). The recent low ($43.73 on 2/06/18) defines near term support where a violation would raise greater concerns.
Recently it reported earnings +21% on +5% sales revenues for the Dec '17 quarter, below the +25% minimum earnings guideline (C criteria), raising fundamental concerns. On 10/26/17 it completed a Secondary Offering. The Finance - Invest Bank/Broker firm was last shown in this FSU section on 2/05/18 with an annotated graph under the headline,"Damaging Violation of 50-Day Moving Average Line". Annual earnings growth (A criteria) history is a good match with the fact-based investment system's guidelines. It has an Earnings Per share rating of 96.
Its current Up/Down Volume Ratio of 1.1 is an unbiased indication its shares have been under only slight accumulation over the past 50 days.It has a current Timeliness rating of B and a Sponsorship rating of C. The number of top-rated funds owning its shares rose from 165 in Jun '16 to 319 in Dec '17, also a reassuring sign concerning the I criteria. Its small supply of only 26.3 million shares (S criteria) in the public float can contribute to greater price volatility in the event of institutional buying or selling. HLI traded up as much as +39.6% since first highlighted in yellow at $35.85 in the 5/11/17 mid-day report (read here) with pivot point cited based on its 3/31/17 high plus 10 cents after an orderly flat base.
|
|
|
Color Codes Explained :
Y - Better candidates highlighted by our
staff of experts.
G - Previously featured
in past reports as yellow but may no longer be buyable under the
guidelines.
***Last / Change / Volume data in this table is the closing quote data***
Symbol/Exchange
Company Name
Industry Group |
PRICE |
CHANGE
(%Change) |
Day High |
Volume
(% DAV)
(% 50 day avg vol) |
52 Wk Hi
% From Hi |
Featured
Date |
Price
Featured |
Pivot Featured |
|
Max Buy |
TPL
-
NYSE
Texas Pacific Land Trust
FINANCIAL SERVICES - Diversified Investments
|
$539.08
|
+0.42
0.08% |
$552.00
|
13,246
69.72% of 50 DAV
50 DAV is 19,000
|
$569.99
-5.42%
|
2/20/2018
|
$517.00
|
PP = $569.99
|
|
MB = $598.49
|
Most Recent Note - 2/27/2018 1:59:32 PM
Y - Still consolidating in an orderly fashion above its 50 DMA line ($493.23). A valid secondary buy point exists up to +5% above the latest high after it successfully tested the 10 week moving average (WMA) line following an earlier technical breakout. Reported earnings +29% on +118% sales revenues for the Dec '17 quarter.
>>> FEATURED STOCK ARTICLE : Finding Support Above 50-Day Moving Average Line - 2/22/2018 |
View all notes |
Set NEW NOTE alert |
Company Profile |
SEC
News |
Chart |
Request a new note
C
A
S
I |
YY
-
NASDAQ
YY Inc
INTERNET - Internet Service Providers
|
$129.33
|
+0.24
0.19% |
$131.17
|
889,880
79.24% of 50 DAV
50 DAV is 1,123,000
|
$142.97
-9.54%
|
12/29/2017
|
$113.06
|
PP = $123.58
|
|
MB = $129.76
|
Most Recent Note - 2/27/2018 6:04:05 PM
G - Consolidating above its 50 DMA line ($125.72). It has not formed a sound new base. Due to report earnings news on Monday. See the latest FSU analysis for more details and a new annotated graph.
>>> FEATURED STOCK ARTICLE : Earnings News Due Next Week for Chinese Social Platform - 2/27/2018 |
View all notes |
Set NEW NOTE alert |
Company Profile |
SEC
News |
Chart |
Request a new note
C
A
S
I |
LOGM
-
NASDAQ
Logmein Inc
INTERNET - Internet Software andamp; Services
|
$115.55
|
-1.15
-0.99% |
$118.05
|
458,907
73.09% of 50 DAV
50 DAV is 627,900
|
$134.80
-14.28%
|
2/15/2018
|
$132.35
|
PP = $129.61
|
|
MB = $136.09
|
Most Recent Note - 2/26/2018 5:49:12 PM
G - A rebound above the 50 DMA line ($120.43) would help its outlook improve, however its Relative Strength rating has slumped to 63, below the 80+ minimum guideline for buy candidates. Found support recently at its 200 DMA line and posted volume-driven gains.
>>> FEATURED STOCK ARTICLE : Technical Breakout Came Ahead of Earnings News - 2/15/2018 |
View all notes |
Set NEW NOTE alert |
Company Profile |
SEC
News |
Chart |
Request a new note
C
A
S
I |
HTHT
-
NASDAQ
China Lodging Group Ads
LEISURE - Lodging
|
$151.90
|
+0.72
0.48% |
$155.78
|
269,843
46.13% of 50 DAV
50 DAV is 585,000
|
$166.19
-8.60%
|
12/22/2017
|
$138.07
|
PP = $142.90
|
|
MB = $150.05
|
Most Recent Note - 2/27/2018 2:04:50 PM
G - Consolidating just above its 50 DMA line ($146.70). It has not formed a sound base.
>>> FEATURED STOCK ARTICLE : Repaired Recent Technical Damage But Has Not Formed a New Base - 2/23/2018 |
View all notes |
Set NEW NOTE alert |
Company Profile |
SEC
News |
Chart |
Request a new note
C
A
S
I |
PETS
-
NASDAQ
Petmed Express Inc
RETAIL - Drug Stores
|
$45.19
|
-2.31
-4.86% |
$47.69
|
643,468
88.51% of 50 DAV
50 DAV is 727,000
|
$57.80
-21.82%
|
1/19/2018
|
$53.59
|
PP = $51.00
|
|
MB = $53.55
|
 Most Recent Note - 2/28/2018 6:05:37 PM
G - Slumped back below its 50 DMA line ($46.84) and ended near the session low with a big loss today on higher (near average) volume. Faces resistance due to overhead supply up to the $57 level. Recently reported earnings +83% on +14% sales revenues, continuing its strong earnings track record.
>>> FEATURED STOCK ARTICLE : Sputtering Below 50-Day Average After Negative Reversal - 2/14/2018 |
View all notes |
Set NEW NOTE alert |
Company Profile |
SEC
News |
Chart |
Request a new note
C
A
S
I |
Symbol/Exchange
Company Name
Industry Group |
PRICE |
CHANGE
(%Change) |
Day High |
Volume
(% DAV)
(% 50 day avg vol) |
52 Wk Hi
% From Hi |
Featured
Date |
Price
Featured |
Pivot Featured |
|
Max Buy |
DPZ
-
NYSE
Dominos Pizza Inc
WHOLESALE - Food Wholesale
|
$222.41
|
-4.06
-1.79% |
$228.24
|
917,947
80.52% of 50 DAV
50 DAV is 1,140,000
|
$236.00
-5.76%
|
2/20/2018
|
$224.86
|
PP = $222.01
|
|
MB = $233.11
|
Most Recent Note - 2/27/2018 1:46:28 PM
Y - Hovering near its all-time high after rallying above the pivot point cited with big volume-driven gains. Highlighted in the 2/20/18 mid-day report with pivot point cited based on its 1/25/18 high plus 10 cents.
>>> FEATURED STOCK ARTICLE : Popular Pizza Firm Met Resistance Near Prior High - 2/20/2018 |
View all notes |
Set NEW NOTE alert |
Company Profile |
SEC
News |
Chart |
Request a new note
C
A
S
I |
ESNT
-
NYSE
Essent Group Ltd
Finance-MrtgandRel Svc
|
$45.09
|
-0.64
-1.40% |
$46.21
|
508,587
76.81% of 50 DAV
50 DAV is 662,100
|
$50.08
-9.96%
|
10/9/2017
|
$39.75
|
PP = $41.54
|
|
MB = $43.62
|
Most Recent Note - 2/27/2018 1:48:26 PM
G - Quietly consolidating near its 50 DMA line ($46.24). Tested support near its 200 DMA line recently. More damaging losses would raise greater concerns. Reported earnings +16% on +27% sales revenues for the Dec '17 quarter, below the +25% minimum earnings guideline (C criteria), raising fundamental concerns.
>>> FEATURED STOCK ARTICLE : Slumped Below 50-Day Average With Earnings News Due Friday - 2/6/2018 |
View all notes |
Set NEW NOTE alert |
Company Profile |
SEC
News |
Chart |
Request a new note
C
A
S
I |
FIVE
-
NASDAQ
Five Below Inc
Retail-DiscountandVariety
|
$66.85
|
+0.30
0.45% |
$68.05
|
543,899
52.05% of 50 DAV
50 DAV is 1,045,000
|
$73.55
-9.11%
|
1/2/2018
|
$69.16
|
PP = $68.99
|
|
MB = $72.44
|
Most Recent Note - 2/27/2018 1:49:24 PM
G - Still sputtering near its 50 DMA line ($66.48). The recent low ($60.00 on 2/06/18) defines important near-term support to watch on pullbacks.
>>> FEATURED STOCK ARTICLE : Rebound Above 50-day Moving Average is Needed to Help Outlook - 2/12/2018 |
View all notes |
Set NEW NOTE alert |
Company Profile |
SEC
News |
Chart |
Request a new note
C
A
S
I |
SPLK
-
NASDAQ
Splunk Inc
Computer Sftwr-Database
|
$93.20
|
-0.54
-0.58% |
$95.51
|
1,646,702
113.10% of 50 DAV
50 DAV is 1,456,000
|
$97.27
-4.18%
|
2/15/2018
|
$96.06
|
PP = $93.68
|
|
MB = $98.36
|
Most Recent Note - 2/27/2018 1:58:16 PM
Y - Due to report results for its fiscal fourth quarter and fiscal year ended January 31, 2018 on Thursday, March 1, 2018. Volume totals have been cooling while hovering at multi-year highs. Its 50 DMA line ($89.00) defines near term support to watch on pullbacks. A valid secondary buy point exists up to +5% above the prior high since finding support at the 10 WMA after the prior breakout.
>>> FEATURED STOCK ARTICLE : Pulled Back to 10-Week Moving Average After Technical Breakout - 2/16/2018 |
View all notes |
Set NEW NOTE alert |
Company Profile |
SEC
News |
Chart |
Request a new note
C
A
S
I |
PAYC
-
NYSE
Paycom Software Inc
COMPUTER SOFTWARE and SERVICES - Application Software
|
$98.92
|
-0.70
-0.70% |
$101.43
|
457,017
65.10% of 50 DAV
50 DAV is 702,000
|
$101.19
-2.24%
|
2/15/2018
|
$95.01
|
PP = $93.61
|
|
MB = $98.29
|
Most Recent Note - 2/27/2018 1:55:05 PM
G - Hitting another new all-time high and its color code is changed to green while rising more than +5% above the prior high. Fundamentals remain strong.
>>> FEATURED STOCK ARTICLE : Fell Below 50 Day Average With Losses on Above Average Volume - 2/8/2018 |
View all notes |
Set NEW NOTE alert |
Company Profile |
SEC
News |
Chart |
Request a new note
C
A
S
I |
Symbol/Exchange
Company Name
Industry Group |
PRICE |
CHANGE
(%Change) |
Day High |
Volume
(% DAV)
(% 50 day avg vol) |
52 Wk Hi
% From Hi |
Featured
Date |
Price
Featured |
Pivot Featured |
|
Max Buy |
GRUB
-
NYSE
Grubhub Inc
COMPUTER SOFTWARE and SERVICES - Technical and System Software
|
$99.41
|
+0.49
0.50% |
$99.77
|
1,156,761
63.00% of 50 DAV
50 DAV is 1,836,000
|
$101.03
-1.60%
|
6/21/2017
|
$47.33
|
PP = $46.94
|
|
MB = $49.29
|
Most Recent Note - 2/27/2018 1:50:36 PM
G - Perched near its all-time high, very extended from any sound base. Recently reported earnings +61% on +49% sales revenues for the Dec '17 quarter.
>>> FEATURED STOCK ARTICLE : Slumped Below 50-Day Average With Earnings News Due - 2/7/2018 |
View all notes |
Set NEW NOTE alert |
Company Profile |
SEC
News |
Chart |
Request a new note
C
A
S
I |
HQY
-
NASDAQ
Healthequity Inc
COMPUTER SOFTWARE and SERVICES - Healthcare Information Service
|
$57.58
|
+1.33
2.36% |
$58.28
|
1,211,182
197.58% of 50 DAV
50 DAV is 613,000
|
$57.72
-0.24%
|
2/20/2018
|
$56.37
|
PP = $55.41
|
|
MB = $58.18
|
Most Recent Note - 2/28/2018 6:07:31 PM
Y - Finished at a best-ever close today with a 4th consecutive volume-driven gain. A "positive reversal" was noted on 2/23/18 after early lows undercut both its 50 and 200 DMA lines. Highlighted in the 2/20/18 mid-day report (read here). Fundamentals remain strong, with earnings +70% on +31% sales revenues for the Oct '17 quarter.
>>> FEATURED STOCK ARTICLE : Fundamentals Remained Favorable and Strength Returned - 2/21/2018 |
View all notes |
Set NEW NOTE alert |
Company Profile |
SEC
News |
Chart |
Request a new note
C
A
S
I |
PYPL
-
NASDAQ
Paypal Holdings Inc
Finance-CrdtCard/PmtPr
|
$79.41
|
-0.05
-0.06% |
$82.17
|
10,780,503
111.15% of 50 DAV
50 DAV is 9,699,000
|
$86.32
-8.01%
|
2/1/2018
|
$80.35
|
PP = $79.49
|
|
MB = $83.46
|
Most Recent Note - 2/26/2018 5:52:16 PM
G - Consolidating above its 50 DMA line ($78.07). Subsequent losses below the recent low ($71.63 on 2/09/18) would raise concerns and trigger a more worrisome technical sell signal. See the latest FSU analysis for more details and a new annotated graph.
>>> FEATURED STOCK ARTICLE : Quietly Consolidating Back Above 50-Day Moving Average - 2/26/2018 |
View all notes |
Set NEW NOTE alert |
Company Profile |
SEC
News |
Chart |
Request a new note
C
A
S
I |
OLLI
-
NASDAQ
Ollie's Bargain Outlet
Retail-DiscountandVariety
|
$59.35
|
-0.15
-0.25% |
$60.58
|
362,211
64.68% of 50 DAV
50 DAV is 560,000
|
$61.25
-3.10%
|
11/21/2017
|
$46.78
|
PP = $47.00
|
|
MB = $49.35
|
Most Recent Note - 2/26/2018 5:50:36 PM
G - Hit another new all-time high with light volume behind today's 4th consecutive gain. Found support near its 50 DMA line. Prior low ($50.15 on 1/04/18) defines the next important near-term support.
>>> FEATURED STOCK ARTICLE : Consolidating Above 50-Day Moving Average Line - 2/13/2018 |
View all notes |
Set NEW NOTE alert |
Company Profile |
SEC
News |
Chart |
Request a new note
C
A
S
I |
WB
-
NASDAQ
Weibo Corp Cl A Ads
INTERNET - Content
|
$128.52
|
-0.61
-0.47% |
$131.82
|
2,149,722
116.77% of 50 DAV
50 DAV is 1,841,000
|
$142.12
-9.57%
|
1/16/2018
|
$126.33
|
PP = $122.21
|
|
MB = $128.32
|
Most Recent Note - 2/26/2018 12:59:01 PM
G - Pulling back today with higher volume indicative of distributional pressure after getting extended from the prior base. Recently reported earnings +88% on +77% sales revenues for the Dec '17 quarter, continuing its strong earnings track record.
>>> FEATURED STOCK ARTICLE : Consolidating Near 50-Day Average With Earnings News Due - 2/9/2018 |
View all notes |
Set NEW NOTE alert |
Company Profile |
SEC
News |
Chart |
Request a new note
C
A
S
I |
Symbol/Exchange
Company Name
Industry Group |
PRICE |
CHANGE
(%Change) |
Day High |
Volume
(% DAV)
(% 50 day avg vol) |
52 Wk Hi
% From Hi |
Featured
Date |
Price
Featured |
Pivot Featured |
|
Max Buy |
HLI
-
NYSE
Houlihan Lokey Inc Cl A
Finance-Invest Bnk/Bkrs
|
$46.42
|
-0.17
-0.36% |
$47.14
|
165,108
72.42% of 50 DAV
50 DAV is 228,000
|
$52.81
-12.10%
|
1/3/2018
|
$45.88
|
PP = $47.09
|
|
MB = $49.44
|
Most Recent Note - 2/28/2018 6:04:10 PM
G - Meeting resistance while recently consolidating below its 50 DMA line ($47.45). The recent low ($43.73 on 2/06/18) defines near term support where a violation would raise greater concerns. Earnings +21% for the Dec '17 quarter were below the +25% minimum earnings guideline (C criteria) raising fundamental concerns. See the latest FSU analysis for more details and a new annotated graph.
>>> FEATURED STOCK ARTICLE : Recently Met Resistance at 50-Day Moving Average - 2/28/2018 |
View all notes |
Set NEW NOTE alert |
Company Profile |
SEC
News |
Chart |
Request a new note
C
A
S
I |
|
|
|
THESE ARE NOT BUY RECOMMENDATIONS!
Comments contained in the body of this report are technical
opinions only. The material herein has been obtained
from sources believed to be reliable and accurate, however,
its accuracy and completeness cannot be guaranteed.
This site is not an investment advisor, hence it does
not endorse or recommend any securities or other investments.
Any recommendation contained in this report may not
be suitable for all investors and it is not to be deemed
an offer or solicitation on our part with respect to
the purchase or sale of any securities. All trademarks,
service marks and trade names appearing in this report
are the property of their respective owners, and are
likewise used for identification purposes only.
This report is a service available
only to active Paid Premium Members.
You may opt-out of receiving report notifications
at any time. Questions or comments may be submitted
by writing to Premium Membership Services 665 S.E. 10 Street, Suite 201 Deerfield Beach, FL 33441-5634 or by calling 1-800-965-8307
or 954-785-1121.
|
|
|