You are not logged in.
This means you
CAN ONLY VIEW reports that were published prior to Thursday, March 20, 2025.
You
MUST UPGRADE YOUR MEMBERSHIP if you want to see any current reports.
AFTER MARKET UPDATE - WEDNESDAY, MARCH 7TH, 2018
Previous After Market Report Next After Market Report >>>
|
|
|
|
DOW |
-82.76 |
24,801.36 |
-0.33% |
|
Volume |
839,636,950 |
+1% |
|
Volume |
2,175,711,100 |
+3% |
|
NASDAQ |
+24.64 |
7,396.65 |
+0.33% |
|
Advancers |
1,542 |
53% |
|
Advancers |
1,822 |
63% |
|
S&P 500 |
-1.32 |
2,726.80 |
-0.05% |
|
Decliners |
1,356 |
47% |
|
Decliners |
1,082 |
37% |
|
Russell 2000 |
+12.33 |
1,574.53 |
+0.79% |
|
52 Wk Highs |
95 |
|
|
52 Wk Highs |
157 |
|
|
S&P 600 |
+6.66 |
956.49 |
+0.70% |
|
52 Wk Lows |
45 |
|
|
52 Wk Lows |
26 |
|
|
 |
Leadership Improved But Major Indices Ended Mixed
Kenneth J. Gruneisen - Passed the CAN SLIM® Master's Exam
Stocks finished mixed Wednesday. The Dow recovered from a 349 point decline to close down 83 at 24801. The S&P 500 lost a point to 2726 while the Nasdaq Composite added 25 points to 7396. The volume totals reported were higher than the prior session totals on the NYSE and on the Nasdaq exchange. Advancers led decliners by an 8-7 margin on the NYSE and by a 9-5 margin on the Nasdaq exchange. Leadership improved as rising new 52-week high totals outnumbered new 52-week lows totals on both the Nasdaq exchange and the NYSE. There were 75 high-ranked companies from the Leaders List that made new 52-week highs and were listed on the BreakOuts Page, versus the total of 57 on the prior session. Charts used courtesy of www.stockcharts.com
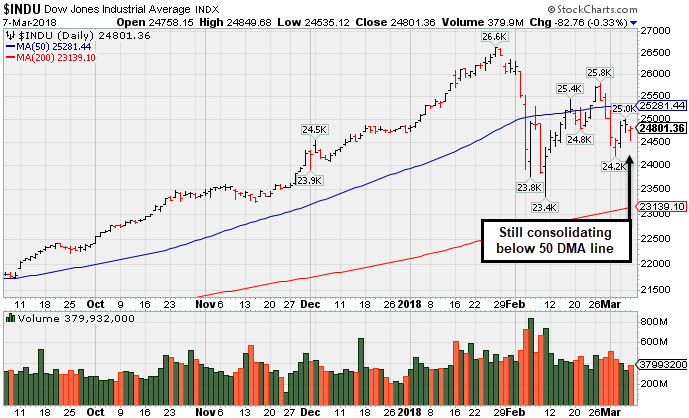 PICTURED: The Dow Jones Industrial Average is consolidating below its 50-day moving average (DMA) line. The major indices (M criteria) have seen the latest uptrend come under pressure as several distribution days were noted. New buying efforts may be justified under the fact-based investment system, however, only when all key criteria of the fact-based investment system are satisfied. The Featured Stocks Pageprovides the latest analysis on noteworthy high-ranked leaders.
U.S. equities experienced another volatile session amid persistent concerns surrounding global trade after White House chief economist Gary Cohn resigned Tuesday. As a vocal proponent of free trade, Cohn stepped down in the wake of President Trump’s proposed tariffs. The major averages pared losses following reports the final policy may exclude Canada and Mexico from the price increases.
On the data front, private payrolls rose 235,000 in February, above a forecasted 200,000 gain. The trade deficit widened to $56.6 billion - its highest level in more than nine years. The release of the Fed’s Beige Book showed the economy and inflation grew at a moderate pace through late February.
Six of 11 S&P 500 sectors were down led by Energy and Consumer related stocks. Exxon (XOM -2.51%) fell in sympathy with falling oil prices. Shares of discount retailer Dollar Tree (DLTR -14.49%) fell after posting earnings below consensus estimates. Technology was the best performing group with software maker Autodesk (ADSK +14.87%) rose as results topped analyst projections.
Treasury yields were little changed with the benchmark 10-year note flat at 2.88%. In commodities, NYMEX WTI crude fell 2.0% to $61.36/barrel. COMEX gold declined 0.7% to $1325.80/ounce. |
 Kenneth J. Gruneisen started out as a licensed stockbroker in August 1987, a couple of months prior to the historic stock market crash that took the Dow Jones Industrial Average down -22.6% in a single day. He has published daily fact-based fundamental and technical analysis on high-ranked stocks online for two decades. Through FACTBASEDINVESTING.COM, Kenneth provides educational articles, news, market commentary, and other information regarding proven investment systems that work in good times and bad.
Comments contained in the body of this report are technical opinions only and are not necessarily those of Gruneisen Growth Corp. The material herein has been obtained from sources believed to be reliable and accurate, however, its accuracy and completeness cannot be guaranteed. Our firm, employees, and customers may effect transactions, including transactions contrary to any recommendation herein, or have positions in the securities mentioned herein or options with respect thereto. Any recommendation contained in this report may not be suitable for all investors and it is not to be deemed an offer or solicitation on our part with respect to the purchase or sale of any securities. |
|
 |
Gains for Tech Sector and Broker/Dealer Index
Kenneth J. Gruneisen - Passed the CAN SLIM® Master's Exam
On Wednesday the Retail Index ($RLX -0.84%) pulled back while the Bank Index ($BKX +0.00%) was unchanged and the Broker/Dealer Index ($XBD +0.21%) finished the session slightly higher. The tech sector had a positive bias as the Networking Index ($NWX +0.47%) and the Semiconductor Index ($SOX +0.29%) both were outpaced by the Biotechnology Index ($BTK +0.81%). The Gold & Silver Index ($XAU -2.48%) was a standout decliner while the Integrated Oil Index ($XOI -0.73%) and the Oil Services Index ($OSX -1.10%) also finished lower. Charts courtesy wwwstockcharts.com
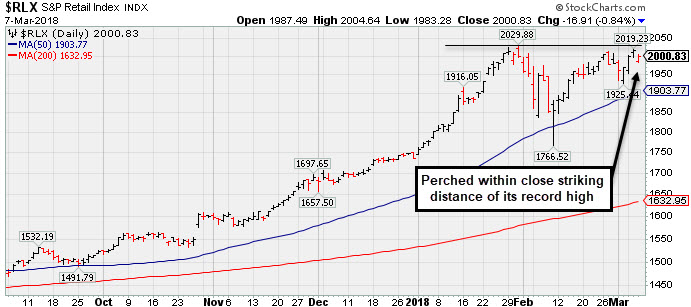 PICTURED: The Retail Index ($RLX -0.84%) is perched within close striking distance of its record high after recently consolidating above support at its 50-day moving average (DMA) line.
| Oil Services |
$OSX |
136.13 |
-1.52 |
-1.10% |
-8.97% |
| Integrated Oil |
$XOI |
1,286.18 |
-9.43 |
-0.73% |
-3.70% |
| Semiconductor |
$SOX |
1,400.47 |
+4.00 |
+0.29% |
+11.76% |
| Networking |
$NWX |
544.53 |
+2.57 |
+0.47% |
+11.01% |
| Broker/Dealer |
$XBD |
292.37 |
+0.61 |
+0.21% |
+10.23% |
| Retail |
$RLX |
2,000.83 |
-16.91 |
-0.84% |
+15.40% |
| Gold & Silver |
$XAU |
78.79 |
-2.01 |
-2.49% |
-7.60% |
| Bank |
$BKX |
113.77 |
+0.00 |
+0.00% |
+6.62% |
| Biotech |
$BTK |
4,762.41 |
+38.03 |
+0.81% |
+12.79% |
|
|
|
 |
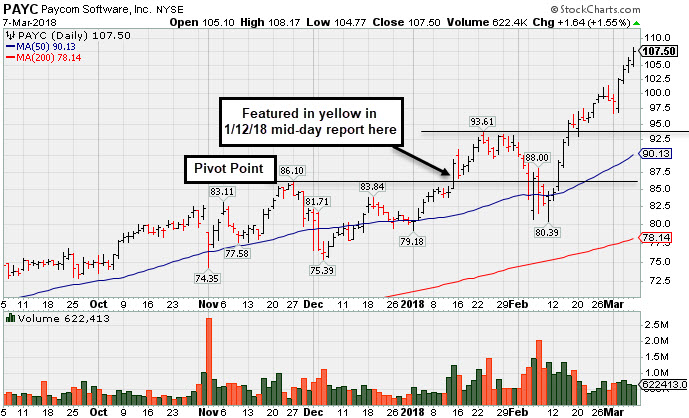
Extended From Prior Base After Streak of Gains
Kenneth J. Gruneisen - Passed the CAN SLIM® Master's Exam
Paycom Software Inc (PAYC +$1.64 or +1.55% to $107.50) has been stubbornly holding its ground and hit yet another new all-time high with today's 4th consecutive gain, getting very extended from any sound base. Prior highs in the $93 area define initial support above its 50-day moving average (DMA) line ($90.13). Disciplined investors avoid chasing stocks more than +5% above prior highs and always limit losses by selling any stock that falls more than -7% from their purchase price.
Fundamentals remain strong. Recently it reported Dec '17 quarterly earnings +61% on +30% sales revenues, continuing its strong earnings track record. It has earned a 99 Earnings Per Share Rating, the highest possible rank.
It has made steady progress since last shown in this FSU section on 2/08/18 with an annotated graph under the headline, "Fell Below 50 Day Average With Losses on Above Average Volume". The high-ranked Computer Software - Enterprise firm's current Up/Down Volume ratio of 1.4 is an unbiased indication its shares have been under slight distributional pressure over the past 50 days. The number of top-rated funds owning its shares rose from 286 in Mar '16 to 405 in Dec '17, a reassuring sign concerning the I criteria. It has a Timeliness rating of A and Sponsorship rating of B. It completed Secondary Offerings on on 11/13/15, 9/16/15, 5/15/15 and 1/14/15 since its $15 IPO on 4/15/14. |
|
|
Color Codes Explained :
Y - Better candidates highlighted by our
staff of experts.
G - Previously featured
in past reports as yellow but may no longer be buyable under the
guidelines.
***Last / Change / Volume data in this table is the closing quote data***
Symbol/Exchange
Company Name
Industry Group |
PRICE |
CHANGE
(%Change) |
Day High |
Volume
(% DAV)
(% 50 day avg vol) |
52 Wk Hi
% From Hi |
Featured
Date |
Price
Featured |
Pivot Featured |
|
Max Buy |
TPL
-
NYSE
Texas Pacific Land Trust
FINANCIAL SERVICES - Diversified Investments
|
$527.27
|
-0.61
-0.12% |
$532.58
|
9,383
52.13% of 50 DAV
50 DAV is 18,000
|
$569.99
-7.49%
|
2/20/2018
|
$517.00
|
PP = $569.99
|
|
MB = $598.49
|
Most Recent Note - 3/5/2018 7:06:06 PM
Y -Posted a small gain today while consolidating in an orderly fashion above its 50 DMA line ($503.41). A valid secondary buy point exists up to +5% above the latest high after it successfully tested the 10 week moving average (WMA) line following an earlier technical breakout. Reported earnings +29% on +118% sales revenues for the Dec '17 quarter.
>>> FEATURED STOCK ARTICLE : Finding Support Above 50-Day Moving Average Line - 2/22/2018 |
View all notes |
Set NEW NOTE alert |
Company Profile |
SEC
News |
Chart |
Request a new note
C
A
S
I |
YY
-
NASDAQ
YY Inc
INTERNET - Internet Service Providers
|
$126.33
|
+7.57
6.37% |
$127.00
|
3,373,186
252.67% of 50 DAV
50 DAV is 1,335,000
|
$142.97
-11.64%
|
12/29/2017
|
$113.06
|
PP = $123.58
|
|
MB = $129.76
|
 Most Recent Note - 3/7/2018 12:39:17 PM
G - Erased early gains and violated its 50 DMA line ($127.65) with a damaging volume-driven loss on the prior session. As previously noted, it had not formed a sound base pattern. A rebound above the 50 DMA line is needed for its outlook to improve. Reported earnings +55% on +56% sales revenues for the Dec '17 quarter, continuing its strong earnings track record. Members were reminded that volume and volatility often increase near earnings news.
>>> FEATURED STOCK ARTICLE : Earnings News Due Next Week for Chinese Social Platform - 2/27/2018 |
View all notes |
Set NEW NOTE alert |
Company Profile |
SEC
News |
Chart |
Request a new note
C
A
S
I |
LOGM
-
NASDAQ
Logmein Inc
INTERNET - Internet Software andamp; Services
|
$123.10
|
+3.00
2.50% |
$123.90
|
527,889
91.02% of 50 DAV
50 DAV is 580,000
|
$134.80
-8.68%
|
2/15/2018
|
$132.35
|
PP = $129.61
|
|
MB = $136.09
|
Most Recent Note - 3/5/2018 7:09:41 PM
G - Rebounded and closed above the 50 DMA line ($120.37) today helping its outlook improve. Its Relative Strength rating is 74, still below the 80+ minimum guideline for buy candidates. Found support recently at its 200 DMA line.
>>> FEATURED STOCK ARTICLE : Technical Breakout Came Ahead of Earnings News - 2/15/2018 |
View all notes |
Set NEW NOTE alert |
Company Profile |
SEC
News |
Chart |
Request a new note
C
A
S
I |
HTHT
-
NASDAQ
China Lodging Group Ads
LEISURE - Lodging
|
$154.67
|
+2.52
1.66% |
$156.59
|
392,432
72.81% of 50 DAV
50 DAV is 539,000
|
$166.19
-6.93%
|
12/22/2017
|
$138.07
|
PP = $142.90
|
|
MB = $150.05
|
Most Recent Note - 3/7/2018 5:39:42 PM
G - While consolidating above its 50 DMA line ($149) its outlook has improved. Subsequent losses below the recent low ($141.01 on 3/02/18) would raise greater concerns and trigger a technical sell signal.
>>> FEATURED STOCK ARTICLE : Repaired Recent Technical Damage But Has Not Formed a New Base - 2/23/2018 |
View all notes |
Set NEW NOTE alert |
Company Profile |
SEC
News |
Chart |
Request a new note
C
A
S
I |
PETS
-
NASDAQ
Petmed Express Inc
RETAIL - Drug Stores
|
$46.18
|
+0.45
0.98% |
$46.23
|
271,542
39.18% of 50 DAV
50 DAV is 693,000
|
$57.80
-20.10%
|
1/19/2018
|
$53.59
|
PP = $51.00
|
|
MB = $53.55
|
Most Recent Note - 3/7/2018 5:34:51 PM
G - Tallied 3 consecutive small gains with light volume, but still sputtering below its 50 DMA line ($46.71). Faces near-term resistance due to overhead supply up to the $57 level. Recently reported earnings +83% on +14% sales revenues, continuing its strong earnings track record.
>>> FEATURED STOCK ARTICLE : Sputtering Below 50-Day Average After Negative Reversal - 2/14/2018 |
View all notes |
Set NEW NOTE alert |
Company Profile |
SEC
News |
Chart |
Request a new note
C
A
S
I |
Symbol/Exchange
Company Name
Industry Group |
PRICE |
CHANGE
(%Change) |
Day High |
Volume
(% DAV)
(% 50 day avg vol) |
52 Wk Hi
% From Hi |
Featured
Date |
Price
Featured |
Pivot Featured |
|
Max Buy |
DPZ
-
NYSE
Dominos Pizza Inc
WHOLESALE - Food Wholesale
|
$222.96
|
+1.52
0.69% |
$223.73
|
734,620
65.80% of 50 DAV
50 DAV is 1,116,400
|
$236.00
-5.53%
|
2/20/2018
|
$224.86
|
PP = $222.01
|
|
MB = $233.11
|
Most Recent Note - 3/5/2018 6:58:52 PM
Y - Quietly sputtering below its pivot point raising concerns. Tallied big gains then stalled after highlighted in the 2/20/18 mid-day report with pivot point cited based on its 1/25/18 high plus 10 cents.
>>> FEATURED STOCK ARTICLE : Popular Pizza Firm Met Resistance Near Prior High - 2/20/2018 |
View all notes |
Set NEW NOTE alert |
Company Profile |
SEC
News |
Chart |
Request a new note
C
A
S
I |
ESNT
-
NYSE
Essent Group Ltd
Finance-MrtgandRel Svc
|
$46.68
|
+1.24
2.73% |
$46.90
|
419,162
66.54% of 50 DAV
50 DAV is 629,900
|
$50.08
-6.79%
|
10/9/2017
|
$39.75
|
PP = $41.54
|
|
MB = $43.62
|
Most Recent Note - 3/5/2018 6:59:58 PM
G - Quietly sputtering below its 50 DMA line ($46.23). Tested support near its 200 DMA line recently. More damaging losses would raise greater concerns. Reported earnings +16% on +27% sales revenues for the Dec '17 quarter, below the +25% minimum earnings guideline (C criteria), raising fundamental concerns.
>>> FEATURED STOCK ARTICLE : Sputtering ESNBelow 50-Day Moving Average Line - 3/2/2018 |
View all notes |
Set NEW NOTE alert |
Company Profile |
SEC
News |
Chart |
Request a new note
C
A
S
I |
FIVE
-
NASDAQ
Five Below Inc
Retail-DiscountandVariety
|
$68.97
|
-2.58
-3.61% |
$70.68
|
1,154,115
112.82% of 50 DAV
50 DAV is 1,023,000
|
$73.55
-6.23%
|
1/2/2018
|
$69.16
|
PP = $68.99
|
|
MB = $72.44
|
Most Recent Note - 3/7/2018 5:41:31 PM
Y - Suffered a loss today with higher volume indicative of distributional pressure. Consolidating above its 50 DMA line ($66.74) and the recent low ($60.00 on 2/06/18) defining important near-term support to watch on pullbacks.
>>> FEATURED STOCK ARTICLE : Rebound Above 50-day Moving Average is Needed to Help Outlook - 2/12/2018 |
View all notes |
Set NEW NOTE alert |
Company Profile |
SEC
News |
Chart |
Request a new note
C
A
S
I |
SPLK
-
NASDAQ
Splunk Inc
Computer Sftwr-Database
|
$105.65
|
+1.76
1.69% |
$106.39
|
3,374,185
207.26% of 50 DAV
50 DAV is 1,628,000
|
$104.69
0.92%
|
2/15/2018
|
$96.06
|
PP = $93.68
|
|
MB = $98.36
|
Most Recent Note - 3/7/2018 12:37:23 PM
G - Hitting yet another new all-time high today, getting more extended from any sound base. Disciplined investors avoid chasing extended stocks. Bullish action came after it reported earnings +76% on +37% sales revenues for the quarter ended January 31, 2018 versus the year ago period.
>>> FEATURED STOCK ARTICLE : Pulled Back to 10-Week Moving Average After Technical Breakout - 2/16/2018 |
View all notes |
Set NEW NOTE alert |
Company Profile |
SEC
News |
Chart |
Request a new note
C
A
S
I |
PAYC
-
NYSE
Paycom Software Inc
COMPUTER SOFTWARE and SERVICES - Application Software
|
$107.50
|
+1.64
1.55% |
$108.17
|
621,396
86.19% of 50 DAV
50 DAV is 721,000
|
$106.40
1.03%
|
2/15/2018
|
$95.01
|
PP = $93.61
|
|
MB = $98.29
|
Most Recent Note - 3/7/2018 5:20:25 PM
G - Stubbornly holding its ground and it hit yet another new all-time high with today's 4th consecutive gain, getting very extended from any sound base. Prior highs in the $93 area define initial support above its 50 DMA line ($90.13). Fundamentals remain strong. See the latest FSU analysis for more details and a new annotated graph.
>>> FEATURED STOCK ARTICLE : Extended From Prior Base After Streak of Gains - 3/7/2018 |
View all notes |
Set NEW NOTE alert |
Company Profile |
SEC
News |
Chart |
Request a new note
C
A
S
I |
Symbol/Exchange
Company Name
Industry Group |
PRICE |
CHANGE
(%Change) |
Day High |
Volume
(% DAV)
(% 50 day avg vol) |
52 Wk Hi
% From Hi |
Featured
Date |
Price
Featured |
Pivot Featured |
|
Max Buy |
GRUB
-
NYSE
Grubhub Inc
COMPUTER SOFTWARE and SERVICES - Technical and System Software
|
$104.16
|
+2.74
2.70% |
$104.67
|
1,121,615
61.83% of 50 DAV
50 DAV is 1,814,000
|
$102.65
1.47%
|
6/21/2017
|
$47.33
|
PP = $46.94
|
|
MB = $49.29
|
Most Recent Note - 3/6/2018 10:45:04 AM
G - Gapped down today retreating from its all-time high after getting very extended from any sound base. Well above its 50 DMA line ($80) and prior highs defining near-term support. Recently reported earnings +61% on +49% sales revenues for the Dec '17 quarter.
>>> FEATURED STOCK ARTICLE : Bullish Action Followed Last Earnings Report - 3/1/2018 |
View all notes |
Set NEW NOTE alert |
Company Profile |
SEC
News |
Chart |
Request a new note
C
A
S
I |
HQY
-
NASDAQ
Healthequity Inc
COMPUTER SOFTWARE and SERVICES - Healthcare Information Service
|
$58.55
|
+0.54
0.93% |
$58.57
|
414,550
68.41% of 50 DAV
50 DAV is 606,000
|
$58.28
0.46%
|
2/20/2018
|
$56.37
|
PP = $55.41
|
|
MB = $58.18
|
Most Recent Note - 3/5/2018 7:08:02 PM
Y - Posted a big gain with average volume today for a best-ever close. Wider than usual intra-day price swings were noted as indicative of uncertainty since highlighted in the 2/20/18 mid-day report (read here). Fundamentals remain strong.
>>> FEATURED STOCK ARTICLE : Fundamentals Remained Favorable and Strength Returned - 2/21/2018 |
View all notes |
Set NEW NOTE alert |
Company Profile |
SEC
News |
Chart |
Request a new note
C
A
S
I |
PYPL
-
NASDAQ
Paypal Holdings Inc
Finance-CrdtCard/PmtPr
|
$79.52
|
+0.29
0.37% |
$79.56
|
5,513,883
56.79% of 50 DAV
50 DAV is 9,709,000
|
$86.32
-7.88%
|
2/1/2018
|
$80.35
|
PP = $79.49
|
|
MB = $83.46
|
Most Recent Note - 3/7/2018 5:36:09 PM
G - Quietly consolidating above its 50 DMA line ($78.72). Subsequent losses below the recent low ($71.63 on 2/09/18) would raise concerns and trigger a more worrisome technical sell signal. Fundamentals remain strong.
>>> FEATURED STOCK ARTICLE : Quietly Consolidating Back Above 50-Day Moving Average - 2/26/2018 |
View all notes |
Set NEW NOTE alert |
Company Profile |
SEC
News |
Chart |
Request a new note
C
A
S
I |
OLLI
-
NASDAQ
Ollie's Bargain Outlet
Retail-DiscountandVariety
|
$60.10
|
-1.85
-2.99% |
$61.15
|
619,998
117.87% of 50 DAV
50 DAV is 526,000
|
$62.05
-3.14%
|
11/21/2017
|
$46.78
|
PP = $47.00
|
|
MB = $49.35
|
Most Recent Note - 3/7/2018 5:43:56 PM
G - Gapped down for a loss on higher volume indicative of distributional pressure, retreating from its all-time high after getting extended from any sound base. Support is defined by its 50 DMA line ($55.74) and prior low ($50.15 on 1/04/18).
>>> FEATURED STOCK ARTICLE : Consolidating Above 50-Day Moving Average Line - 2/13/2018 |
View all notes |
Set NEW NOTE alert |
Company Profile |
SEC
News |
Chart |
Request a new note
C
A
S
I |
WB
-
NASDAQ
Weibo Corp Cl A Ads
INTERNET - Content
|
$138.93
|
+3.33
2.46% |
$139.00
|
1,412,344
74.73% of 50 DAV
50 DAV is 1,890,000
|
$142.12
-2.24%
|
1/16/2018
|
$126.33
|
PP = $122.21
|
|
MB = $128.32
|
Most Recent Note - 3/6/2018 5:53:50 PM
G - Color code is changed to green after rising back above its "max buy" level with 3 consecutive gains. Recently reported earnings +88% on +77% sales revenues for the Dec '17 quarter, continuing its strong earnings track record.
>>> FEATURED STOCK ARTICLE : Consolidating Near 50-Day Average With Earnings News Due - 2/9/2018 |
View all notes |
Set NEW NOTE alert |
Company Profile |
SEC
News |
Chart |
Request a new note
C
A
S
I |
Symbol/Exchange
Company Name
Industry Group |
PRICE |
CHANGE
(%Change) |
Day High |
Volume
(% DAV)
(% 50 day avg vol) |
52 Wk Hi
% From Hi |
Featured
Date |
Price
Featured |
Pivot Featured |
|
Max Buy |
HLI
-
NYSE
Houlihan Lokey Inc Cl A
Finance-Invest Bnk/Bkrs
|
$46.02
|
+0.02
0.04% |
$46.17
|
191,673
86.73% of 50 DAV
50 DAV is 221,000
|
$52.81
-12.86%
|
1/3/2018
|
$45.88
|
PP = $47.09
|
|
MB = $49.44
|
Most Recent Note - 3/5/2018 7:04:34 PM
G - Met resistance recently and it remains below its 50 DMA line ($47.45). The recent low ($43.73 on 2/06/18) defines near term support where a violation would raise greater concerns. Earnings +21% for the Dec '17 quarter were below the +25% minimum earnings guideline (C criteria) raising fundamental concerns.
>>> FEATURED STOCK ARTICLE : Recently Met Resistance at 50-Day Moving Average - 2/28/2018 |
View all notes |
Set NEW NOTE alert |
Company Profile |
SEC
News |
Chart |
Request a new note
C
A
S
I |
SQ
-
NYSE
Square Inc Cl A
Finance-CrdtCard/PmtPr
|
$50.72
|
+1.12
2.26% |
$51.89
|
18,266,006
120.14% of 50 DAV
50 DAV is 15,204,000
|
$50.50
0.44%
|
3/5/2018
|
$49.70
|
PP = $49.66
|
|
MB = $52.14
|
Most Recent Note - 3/6/2018 1:02:49 PM
Y - Holding its ground today. Finished strong on the prior session after highlighted in yellow with pivot point cited based on its 11/24/17 high plus 10 cents. Hit a new all-time high triggering a technical buy signal with a big gain backed by more than twice average volume while rising from a choppy "late-stage" base. Recent quarterly comparisons through Dec '17 showed strong sales revenues growth acceleration and solid earnings increases versus the year-ago periods. Limited annual earnings (A criteria) history remains a concern, yet it had a profitable FY '16 following its $9 IPO in Nov '15. See the latest FSU analysis for more details and an annotated graph.
>>> FEATURED STOCK ARTICLE : New High & Considerable Gain Backed By Twice Average Volume - 3/5/2018 |
View all notes |
Set NEW NOTE alert |
Company Profile |
SEC
News |
Chart |
Request a new note
C
A
S
I |
SEND
-
NYSE
Sendgrid Inc
INTERNET - Content
|
$30.02
|
+1.38
4.82% |
$30.13
|
234,849
99.94% of 50 DAV
50 DAV is 235,000
|
$29.14
3.02%
|
3/6/2018
|
$28.00
|
PP = $28.37
|
|
MB = $29.79
|
Most Recent Note - 3/6/2018 5:50:16 PM
Y - Hit a new high with +80% above average volume behind its gain, triggering a technical buy signal while rising from a 9-week cup-with-high-handle pattern. Finished strong after highlighted in yellow in the earlier mid-day report (read here) with pivot point cited based on its 2/27/18 high. Showed strong sales revenues and earnings increases in quarterly comparisons through Dec '17. Had a profitable FY '17 after years of shrinking losses. Concerns remain due to its limited annual earnings (A criteria) history since its $16 IPO on 11/15/17. See the latest FSU analysis for more details and a new annotated graph.
>>> FEATURED STOCK ARTICLE : Recently Profitable Internet - Content Firm Rallied to New High - 3/6/2018 |
View all notes |
Set NEW NOTE alert |
Company Profile |
SEC
News |
Chart |
Request a new note
C
A
S
I |
|
|
|
THESE ARE NOT BUY RECOMMENDATIONS!
Comments contained in the body of this report are technical
opinions only. The material herein has been obtained
from sources believed to be reliable and accurate, however,
its accuracy and completeness cannot be guaranteed.
This site is not an investment advisor, hence it does
not endorse or recommend any securities or other investments.
Any recommendation contained in this report may not
be suitable for all investors and it is not to be deemed
an offer or solicitation on our part with respect to
the purchase or sale of any securities. All trademarks,
service marks and trade names appearing in this report
are the property of their respective owners, and are
likewise used for identification purposes only.
This report is a service available
only to active Paid Premium Members.
You may opt-out of receiving report notifications
at any time. Questions or comments may be submitted
by writing to Premium Membership Services 665 S.E. 10 Street, Suite 201 Deerfield Beach, FL 33441-5634 or by calling 1-800-965-8307
or 954-785-1121.
|
|
|