You are not logged in.
This means you
CAN ONLY VIEW reports that were published prior to Wednesday, March 26, 2025.
You
MUST UPGRADE YOUR MEMBERSHIP if you want to see any current reports.
AFTER MARKET UPDATE - THURSDAY, FEBRUARY 22ND, 2018
Previous After Market Report Next After Market Report >>>
|
|
|
|
DOW |
+164.70 |
24,962.48 |
+0.66% |
|
Volume |
835,238,690 |
-6% |
|
Volume |
1,907,770,256 |
-1% |
|
NASDAQ |
-8.14 |
7,210.09 |
-0.11% |
|
Advancers |
1,530 |
52% |
|
Advancers |
1,212 |
41% |
|
S&P 500 |
+2.63 |
2,703.96 |
+0.10% |
|
Decliners |
1,411 |
48% |
|
Decliners |
1,709 |
58% |
|
Russell 2000 |
-1.85 |
1,529.99 |
-0.12% |
|
52 Wk Highs |
32 |
|
|
52 Wk Highs |
62 |
|
|
S&P 600 |
-0.01 |
934.92 |
-0.00% |
|
52 Wk Lows |
71 |
|
|
52 Wk Lows |
54 |
|
|
 |
Major Indices Sputter and End Mixed With Less Leadership
Kenneth J. Gruneisen - Passed the CAN SLIM® Master's Exam
Stocks finished mixed Thursday. The Dow gained 165 points to 24962. The S&P 500 added 3 points to 2703 while the Nasdaq Composite lost 8 points to 7210. The volume totals reported were lighter than the prior session totals on both the NYSE and the Nasdaq exchange. Decliners led advancers by a 3-2 margin on the Nasdaq exchange while advancers narrowly outnumbered decliners on the NYSE. New 52-week highs outnumbered new 52-week lows on the Nasdaq exchange, but new lows outnumbered new highs on the NYSE. Leadership waned as there were 19 high-ranked companies from the Leaders List that made new 52-week highs and were listed on the BreakOuts Page, versus the total of 50 on the prior session. Charts used courtesy of www.stockcharts.com
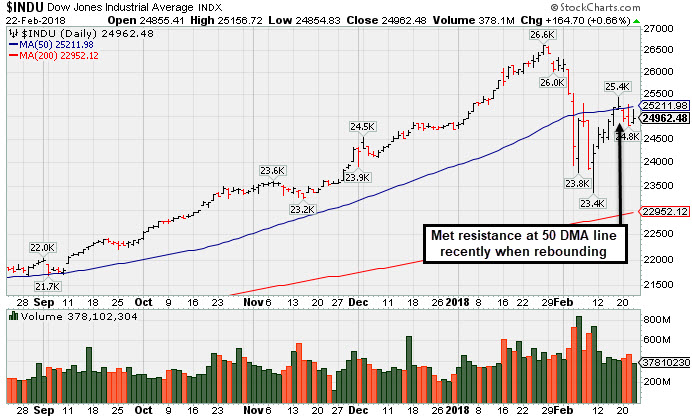 PICTURED: The Dow Jones Industrial Average found support well above its 200-day moving average (DMA) line, but it met resistance near its 50 DMA line recently when rebounding. The major indices (M criteria) are in a confirmed uptrend. New buying efforts may be justified under the fact-based investment system, however, only when all key criteria of the fact-based investment system are satisfied. The Featured Stocks Pageprovides the latest analysis on noteworthy high-ranked leaders.
U.S. equities fluctuated and traded in a wide range amid continued concerns surrounding rising interest rates. Treasury yields settled lower after spiking Wednesday, following the minutes release from the FOMC’s January meeting. Policymakers suggested upticks in inflation and the economy as justification to continue gradually tightening monetary policy. The yield on the 10-year note fell three basis points to 2.92%. On the data front, weekly initial jobless claims fell to 222,000. The index of leading indicators rose 1.0% in January versus a projected 0.7% increase.
Nine of 11 sectors in the S&P 500 finished higher with Financials and Health Care the only laggards. Energy shares paced gains with Exxon Mobil (XOM +1.30%) rising in tandem with higher oil prices. Industrials and Materials were also notable outperformers with Caterpillar (CAT +2.34%) and DowDuPont (DWDP +1.37%). In other news, United Technologies (UTX +3.34%) rose after announcing the possibility of splitting into three separate entities.
In commodities, NYMEX crude surged 1.5% to $62.62/barrel after the EIA revealed U.S. crude inventories unexpectedly declined by 1.6 million barrels in the most recent week, compared to projections for a buildup. COMEX gold added 0.1% to $1330.60/ounce amid a weaker dollar. |
 Kenneth J. Gruneisen started out as a licensed stockbroker in August 1987, a couple of months prior to the historic stock market crash that took the Dow Jones Industrial Average down -22.6% in a single day. He has published daily fact-based fundamental and technical analysis on high-ranked stocks online for two decades. Through FACTBASEDINVESTING.COM, Kenneth provides educational articles, news, market commentary, and other information regarding proven investment systems that work in good times and bad.
Comments contained in the body of this report are technical opinions only and are not necessarily those of Gruneisen Growth Corp. The material herein has been obtained from sources believed to be reliable and accurate, however, its accuracy and completeness cannot be guaranteed. Our firm, employees, and customers may effect transactions, including transactions contrary to any recommendation herein, or have positions in the securities mentioned herein or options with respect thereto. Any recommendation contained in this report may not be suitable for all investors and it is not to be deemed an offer or solicitation on our part with respect to the purchase or sale of any securities. |
|
 |
Retail and Energy-Linked Groups Rose
Kenneth J. Gruneisen - Passed the CAN SLIM® Master's Exam
Financial groups lost ground as the Broker/Dealer Index ($XBD -1.03%) and the Bank Index ($BKX -1.39%) both fell, meanwhile the Retail Index ($RLX +0.40%) finished modestly higher. The tech sector had a slightly negative bias as the Semiconductor Index ($SOX -0.25%), Networking Index ($NWX -0.31%), and the Biotechnology Index ($BTK -0.46) each edged lower. The Gold & Silver Index ($XAU -0.61%) also edged lower. Energy-linked shares were standout gainers as the Oil Services Index ($OSX +1.99%) and Integrated Oil Index ($XOI +1.22%) both rose. Charts courtesy wwwstockcharts.com
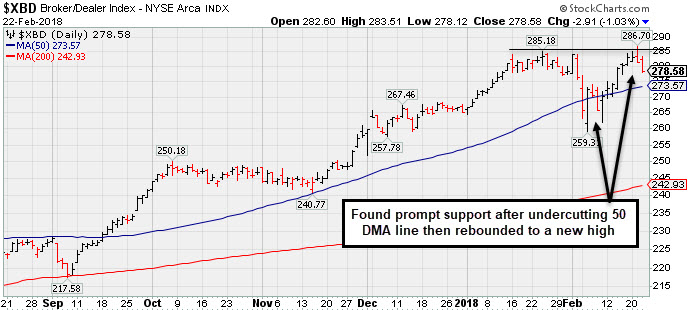 PICTURED: The Broker/Dealer Index ($XBD -1.03%) recently found prompt support after undercutting its 50-day moving average (DMA) line and rebounded to hit a new high.
| Oil Services |
$OSX |
137.38 |
+2.68 |
+1.99% |
-8.14% |
| Integrated Oil |
$XOI |
1,294.80 |
+15.59 |
+1.22% |
-3.05% |
| Semiconductor |
$SOX |
1,322.09 |
-3.26 |
-0.25% |
+5.51% |
| Networking |
$NWX |
509.47 |
-1.60 |
-0.31% |
+3.86% |
| Broker/Dealer |
$XBD |
278.58 |
-2.91 |
-1.03% |
+5.03% |
| Retail |
$RLX |
1,960.25 |
+7.83 |
+0.40% |
+13.06% |
| Gold & Silver |
$XAU |
80.02 |
-0.49 |
-0.61% |
-6.16% |
| Bank |
$BKX |
112.34 |
-1.58 |
-1.39% |
+5.28% |
| Biotech |
$BTK |
4,602.20 |
-21.36 |
-0.46% |
+9.00% |
|
|
|
 |
Finding Support Above 50-Day Moving Average Line
Kenneth J. Gruneisen - Passed the CAN SLIM® Master's Exam
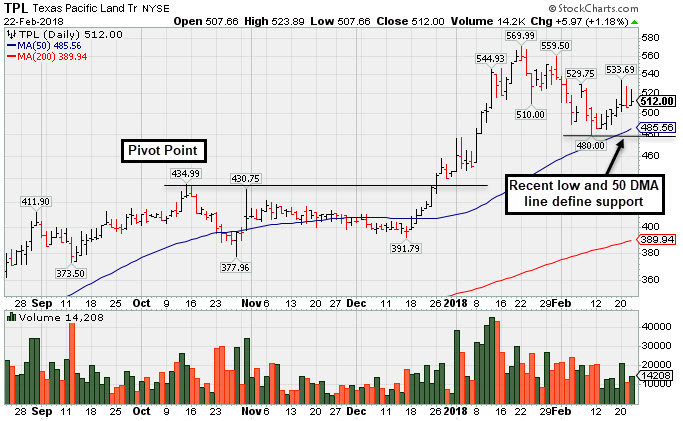
Texas Pacific Land Trust (TPL +$5.97 or +1.18% to $512.00) is consolidating above its 50-day moving average line ($485.56) and recent low ($480 on 2/09/18) defining near-term support. A valid secondary buy point exists up to +5% above the latest high after it successfully tested the 10 week moving average (WMA) line following an earlier technical breakout.
It was highlighted in yellow with pivot point cited based on its 10/13/17 high plus 10 cents in the 12/21/17 mid-day report (read here). Subsequent volume-driven gains above the pivot point triggered a technical buy signal under the fact-based investment system's rules. It was last shown in the FSU on 1/23/18 with an annotated graph under the headline, "Considerable Gains in First 2-3 Weeks After Recent Breakout".
The thinly-traded Texas Real Estate Development firm has only 7.9 million shares outstanding (S criteria). It reported earnings +29% on +118% sales revenues for the Dec '17 quarter, marking its 5th very strong quarterly comparison above the +25% minimum guideline (C criteria). Annual earnings (A criteria) history has been strong.
The number of top-rated funds owning its shares rose from 37 in Dec '16 to 58 in Dec '17, a reassuring sign concerning the I criteria. The current Up/Down Volume ratio of 1.4 is an unbiased indication that institutional accumulation/distribution action has been neutral over the past 50 days. It has earned a Timeliness rating of A and a Sponsorship Rating of C.
|
|
|
Color Codes Explained :
Y - Better candidates highlighted by our
staff of experts.
G - Previously featured
in past reports as yellow but may no longer be buyable under the
guidelines.
***Last / Change / Volume data in this table is the closing quote data***
Symbol/Exchange
Company Name
Industry Group |
PRICE |
CHANGE
(%Change) |
Day High |
Volume
(% DAV)
(% 50 day avg vol) |
52 Wk Hi
% From Hi |
Featured
Date |
Price
Featured |
Pivot Featured |
|
Max Buy |
TPL
-
NYSE
Texas Pacific Land Trust
FINANCIAL SERVICES - Diversified Investments
|
$512.00
|
+5.97
1.18% |
$523.89
|
14,208
78.93% of 50 DAV
50 DAV is 18,000
|
$569.99
-10.17%
|
2/20/2018
|
$517.00
|
PP = $569.99
|
|
MB = $598.49
|
 Most Recent Note - 2/22/2018 5:26:09 PM
Y - Consolidating in an orderly fashion above its 50 DMA line. A valid secondary buy point exists up to +5% above the latest high after it successfully tested the 10 week moving average (WMA) line following an earlier technical breakout. Reported earnings +29% on +118% sales revenues for the Dec '17 quarter. See the latest FSU analysis for more details and a new annotated graph.
>>> FEATURED STOCK ARTICLE : Finding Support Above 50-Day Moving Average Line - 2/22/2018 |
View all notes |
Set NEW NOTE alert |
Company Profile |
SEC
News |
Chart |
Request a new note
C
A
S
I |
YY
-
NASDAQ
YY Inc
INTERNET - Internet Service Providers
|
$129.76
|
-3.48
-2.61% |
$135.22
|
931,515
81.86% of 50 DAV
50 DAV is 1,138,000
|
$142.97
-9.24%
|
12/29/2017
|
$113.06
|
PP = $123.58
|
|
MB = $129.76
|
Most Recent Note - 2/20/2018 2:51:51 PM
G - Consolidating above its 50 DMA line ($123.34), but it has not formed a sound new base of sufficient length.
>>> FEATURED STOCK ARTICLE : Retreating After +78% Rally in 5 Months - 2/2/2018 |
View all notes |
Set NEW NOTE alert |
Company Profile |
SEC
News |
Chart |
Request a new note
C
A
S
I |
LOGM
-
NASDAQ
Logmein Inc
INTERNET - Internet Software andamp; Services
|
$117.90
|
+1.25
1.07% |
$119.00
|
881,704
147.17% of 50 DAV
50 DAV is 599,100
|
$134.80
-12.54%
|
2/15/2018
|
$132.35
|
PP = $129.61
|
|
MB = $136.09
|
Most Recent Note - 2/20/2018 2:18:55 PM
G - Color code is changed to green while slumping below its 50 DMA line ($120.34) with above average volume behind another loss today raising greater concerns. Only a prompt rebound above the 50 DMA line would help its outlook improve.
>>> FEATURED STOCK ARTICLE : Technical Breakout Came Ahead of Earnings News - 2/15/2018 |
View all notes |
Set NEW NOTE alert |
Company Profile |
SEC
News |
Chart |
Request a new note
C
A
S
I |
HTHT
-
NASDAQ
China Lodging Group Ads
LEISURE - Lodging
|
$156.83
|
+2.05
1.32% |
$158.50
|
230,270
36.96% of 50 DAV
50 DAV is 623,000
|
$166.19
-5.63%
|
12/22/2017
|
$138.07
|
PP = $142.90
|
|
MB = $150.05
|
Most Recent Note - 2/20/2018 2:45:11 PM
G - Still consolidating above its 50 DMA line ($143.28), but it has not formed a sound base of sufficient length. More damaging losses below the prior low ($128.60 on 2/09/18) the would raise greater concerns.
>>> FEATURED STOCK ARTICLE : Found Support Above Prior High After Latest Breakout - 1/24/2018 |
View all notes |
Set NEW NOTE alert |
Company Profile |
SEC
News |
Chart |
Request a new note
C
A
S
I |
PETS
-
NASDAQ
Petmed Express Inc
RETAIL - Drug Stores
|
$45.23
|
-1.64
-3.50% |
$47.18
|
748,476
104.24% of 50 DAV
50 DAV is 718,000
|
$57.80
-21.75%
|
1/19/2018
|
$53.59
|
PP = $51.00
|
|
MB = $53.55
|
Most Recent Note - 2/22/2018 3:59:20 PM
G - Met resistance at its 50 DMA ($46.59) line, and a rebound above the 50 DMA line is needed to help its outlook improve. Recently reported earnings +83% on +14% sales revenues, continuing its strong earnings track record.
>>> FEATURED STOCK ARTICLE : Sputtering Below 50-Day Average After Negative Reversal - 2/14/2018 |
View all notes |
Set NEW NOTE alert |
Company Profile |
SEC
News |
Chart |
Request a new note
C
A
S
I |
Symbol/Exchange
Company Name
Industry Group |
PRICE |
CHANGE
(%Change) |
Day High |
Volume
(% DAV)
(% 50 day avg vol) |
52 Wk Hi
% From Hi |
Featured
Date |
Price
Featured |
Pivot Featured |
|
Max Buy |
DPZ
-
NYSE
Dominos Pizza Inc
WHOLESALE - Food Wholesale
|
$227.00
|
-3.53
-1.53% |
$230.25
|
1,791,278
158.80% of 50 DAV
50 DAV is 1,128,000
|
$236.00
-3.81%
|
2/20/2018
|
$224.86
|
PP = $222.01
|
|
MB = $233.11
|
Most Recent Note - 2/21/2018 11:57:53 AM
Y - Hitting another new high today. Finished the prior session below the pivot point after highlighted in the mid-day report in yellow with pivot point cited based on its 1/25/18 high plus 10 cents. See the latest FSU analysis for more details and an annotated graph.
>>> FEATURED STOCK ARTICLE : Popular Pizza Firm Met Resistance Near Prior High - 2/20/2018 |
View all notes |
Set NEW NOTE alert |
Company Profile |
SEC
News |
Chart |
Request a new note
C
A
S
I |
ESNT
-
NYSE
Essent Group Ltd
Finance-MrtgandRel Svc
|
$46.24
|
-0.89
-1.89% |
$47.66
|
567,864
83.76% of 50 DAV
50 DAV is 678,000
|
$50.08
-7.67%
|
10/9/2017
|
$39.75
|
PP = $41.54
|
|
MB = $43.62
|
Most Recent Note - 2/21/2018 5:29:28 PM
G - Quietly consolidating above its 50 DMA line ($46.22) after a "positive reversal" when testing support near its 200 DMA line. More damaging losses would raise greater concerns. Reported earnings +16% on +27% sales revenues for the Dec '17 quarter, below the +25% minimum earnings guideline (C criteria), raising fundamental concerns.
>>> FEATURED STOCK ARTICLE : Slumped Below 50-Day Average With Earnings News Due Friday - 2/6/2018 |
View all notes |
Set NEW NOTE alert |
Company Profile |
SEC
News |
Chart |
Request a new note
C
A
S
I |
FIVE
-
NASDAQ
Five Below Inc
Retail-DiscountandVariety
|
$67.37
|
+0.94
1.42% |
$68.00
|
1,112,486
103.58% of 50 DAV
50 DAV is 1,074,000
|
$73.55
-8.40%
|
1/2/2018
|
$69.16
|
PP = $68.99
|
|
MB = $72.44
|
Most Recent Note - 2/21/2018 5:32:34 PM
G - It has not formed a sound new base and is sputtering near its 50 DMA line ($66.41). The recent low ($60.00 on 2/06/18) defines important near-term support to watch on pullbacks.
>>> FEATURED STOCK ARTICLE : Rebound Above 50-day Moving Average is Needed to Help Outlook - 2/12/2018 |
View all notes |
Set NEW NOTE alert |
Company Profile |
SEC
News |
Chart |
Request a new note
C
A
S
I |
SPLK
-
NASDAQ
Splunk Inc
Computer Sftwr-Database
|
$93.21
|
+0.36
0.39% |
$94.64
|
609,408
40.30% of 50 DAV
50 DAV is 1,512,000
|
$97.27
-4.17%
|
2/15/2018
|
$96.06
|
PP = $93.68
|
|
MB = $98.36
|
Most Recent Note - 2/22/2018 4:10:20 PM
Y - Hovering near multi-year highs. Its 50 DMA line defines near term support to watch on pullbacks. A valid secondary buy point exists up to +5% above the prior high since finding support at the 10 WMA after the prior breakout.
>>> FEATURED STOCK ARTICLE : Pulled Back to 10-Week Moving Average After Technical Breakout - 2/16/2018 |
View all notes |
Set NEW NOTE alert |
Company Profile |
SEC
News |
Chart |
Request a new note
C
A
S
I |
PAYC
-
NYSE
Paycom Software Inc
COMPUTER SOFTWARE and SERVICES - Application Software
|
$96.11
|
+0.49
0.51% |
$96.97
|
362,634
51.66% of 50 DAV
50 DAV is 702,000
|
$97.56
-1.49%
|
2/15/2018
|
$95.01
|
PP = $93.61
|
|
MB = $98.29
|
Most Recent Note - 2/22/2018 4:02:52 PM
Y - Quietly hovering near its all-time high. A valid "secondary buy point" exists up to +5% above the latest high since it found support at its 10-week moving average line following the prior breakout. Fundamentals remain strong.
>>> FEATURED STOCK ARTICLE : Fell Below 50 Day Average With Losses on Above Average Volume - 2/8/2018 |
View all notes |
Set NEW NOTE alert |
Company Profile |
SEC
News |
Chart |
Request a new note
C
A
S
I |
Symbol/Exchange
Company Name
Industry Group |
PRICE |
CHANGE
(%Change) |
Day High |
Volume
(% DAV)
(% 50 day avg vol) |
52 Wk Hi
% From Hi |
Featured
Date |
Price
Featured |
Pivot Featured |
|
Max Buy |
GRUB
-
NYSE
Grubhub Inc
COMPUTER SOFTWARE and SERVICES - Technical and System Software
|
$98.27
|
+0.75
0.77% |
$99.18
|
992,354
54.50% of 50 DAV
50 DAV is 1,821,000
|
$99.81
-1.54%
|
6/21/2017
|
$47.33
|
PP = $46.94
|
|
MB = $49.29
|
Most Recent Note - 2/21/2018 5:33:28 PM
G - Wedged higher recently, getting more extended from any sound base. Recently reported earnings +61% on +49% sales revenues for the Dec '17 quarter.
>>> FEATURED STOCK ARTICLE : Slumped Below 50-Day Average With Earnings News Due - 2/7/2018 |
View all notes |
Set NEW NOTE alert |
Company Profile |
SEC
News |
Chart |
Request a new note
C
A
S
I |
HQY
-
NASDAQ
Healthequity Inc
COMPUTER SOFTWARE and SERVICES - Healthcare Information Service
|
$50.74
|
-5.97
-10.53% |
$57.31
|
1,266,886
219.95% of 50 DAV
50 DAV is 576,000
|
$57.72
-12.09%
|
2/20/2018
|
$56.37
|
PP = $55.41
|
|
MB = $58.18
|
Most Recent Note - 2/22/2018 3:57:43 PM
Y - Down considerably today, raising concerns while abruptly slumping from all-time highs after 9 consecutive gains, falling back into the prior base. Highlighted in the 2/20/18 mid-day report (read here). Fundamentals remain strong, with earnings +70% on +31% sales revenues for the Oct '17 quarter. See the latest FSU analysis for more details and an annotated graph.
>>> FEATURED STOCK ARTICLE : Fundamentals Remained Favorable and Strength Returned - 2/21/2018 |
View all notes |
Set NEW NOTE alert |
Company Profile |
SEC
News |
Chart |
Request a new note
C
A
S
I |
PYPL
-
NASDAQ
Paypal Holdings Inc
Finance-CrdtCard/PmtPr
|
$77.70
|
+1.19
1.56% |
$78.37
|
6,599,257
68.27% of 50 DAV
50 DAV is 9,667,000
|
$86.32
-9.99%
|
2/1/2018
|
$80.35
|
PP = $79.49
|
|
MB = $83.46
|
Most Recent Note - 2/21/2018 5:39:09 PM
G - Sputtering back below its 50 DMA line ($77.73) his week. Subsequent losses below the recent low ($71.63 on 2/09/18) would raise concerns and trigger a more worrisome technical sell signal.
>>> FEATURED STOCK ARTICLE : Gap Down Following Earnings News Tests Important Support Level - 2/1/2018 |
View all notes |
Set NEW NOTE alert |
Company Profile |
SEC
News |
Chart |
Request a new note
C
A
S
I |
OLLI
-
NASDAQ
Ollie's Bargain Outlet
Retail-DiscountandVariety
|
$57.85
|
+1.15
2.03% |
$58.30
|
272,955
47.31% of 50 DAV
50 DAV is 577,000
|
$58.50
-1.11%
|
11/21/2017
|
$46.78
|
PP = $47.00
|
|
MB = $49.35
|
Most Recent Note - 2/20/2018 2:43:02 PM
G - Still quietly consolidating above its 50 DMA line ($53.73). Prior low ($50.15 on 1/04/18) defines the next important near-term support.
>>> FEATURED STOCK ARTICLE : Consolidating Above 50-Day Moving Average Line - 2/13/2018 |
View all notes |
Set NEW NOTE alert |
Company Profile |
SEC
News |
Chart |
Request a new note
C
A
S
I |
WB
-
NASDAQ
Weibo Corp Cl A Ads
INTERNET - Content
|
$134.71
|
-2.04
-1.49% |
$138.00
|
1,349,620
74.24% of 50 DAV
50 DAV is 1,818,000
|
$142.12
-5.21%
|
1/16/2018
|
$126.33
|
PP = $122.21
|
|
MB = $128.32
|
Most Recent Note - 2/22/2018 4:07:55 PM
G - Holding its ground near its all-time high with volume totals cooling. It is extended from the prior base. Recently reported earnings +88% on +77% sales revenues for the Dec '17 quarter, continuing its strong earnings track record.
>>> FEATURED STOCK ARTICLE : Consolidating Near 50-Day Average With Earnings News Due - 2/9/2018 |
View all notes |
Set NEW NOTE alert |
Company Profile |
SEC
News |
Chart |
Request a new note
C
A
S
I |
Symbol/Exchange
Company Name
Industry Group |
PRICE |
CHANGE
(%Change) |
Day High |
Volume
(% DAV)
(% 50 day avg vol) |
52 Wk Hi
% From Hi |
Featured
Date |
Price
Featured |
Pivot Featured |
|
Max Buy |
HLI
-
NYSE
Houlihan Lokey Inc Cl A
Finance-Invest Bnk/Bkrs
|
$46.28
|
-0.13
-0.28% |
$47.12
|
225,399
98.00% of 50 DAV
50 DAV is 230,000
|
$52.81
-12.37%
|
1/3/2018
|
$45.88
|
PP = $47.09
|
|
MB = $49.44
|
Most Recent Note - 2/21/2018 5:34:23 PM
G - Quietly consolidating just below its 50 DMA line ($47.32). The recent low ($43.73 on 2/06/18) defines near term support where a violation would raise greater concerns. Recently reported earnings +21% on +5% sales revenues for the Dec '17 quarter, below the +25% minimum earnings guideline (C criteria), raising fundamental concerns. On 10/26/17 it completed a Secondary Offering.
>>> FEATURED STOCK ARTICLE : Damaging Violation of 50-Day Moving Average Line - 2/5/2018 |
View all notes |
Set NEW NOTE alert |
Company Profile |
SEC
News |
Chart |
Request a new note
C
A
S
I |
|
|
|
THESE ARE NOT BUY RECOMMENDATIONS!
Comments contained in the body of this report are technical
opinions only. The material herein has been obtained
from sources believed to be reliable and accurate, however,
its accuracy and completeness cannot be guaranteed.
This site is not an investment advisor, hence it does
not endorse or recommend any securities or other investments.
Any recommendation contained in this report may not
be suitable for all investors and it is not to be deemed
an offer or solicitation on our part with respect to
the purchase or sale of any securities. All trademarks,
service marks and trade names appearing in this report
are the property of their respective owners, and are
likewise used for identification purposes only.
This report is a service available
only to active Paid Premium Members.
You may opt-out of receiving report notifications
at any time. Questions or comments may be submitted
by writing to Premium Membership Services 665 S.E. 10 Street, Suite 201 Deerfield Beach, FL 33441-5634 or by calling 1-800-965-8307
or 954-785-1121.
|
|
|