You are not logged in.
This means you
CAN ONLY VIEW reports that were published prior to Sunday, April 6, 2025.
You
MUST UPGRADE YOUR MEMBERSHIP if you want to see any current reports.
AFTER MARKET UPDATE - THURSDAY, MARCH 1ST, 2018
Previous After Market Report Next After Market Report >>>
|
|
|
|
DOW |
-420.22 |
24,608.98 |
-1.68% |
|
Volume |
1,035,439,630 |
-6% |
|
Volume |
2,478,012,070 |
+4% |
|
NASDAQ |
-92.45 |
7,180.56 |
-1.27% |
|
Advancers |
1,186 |
40% |
|
Advancers |
1,211 |
41% |
|
S&P 500 |
-36.16 |
2,677.67 |
-1.33% |
|
Decliners |
1,754 |
60% |
|
Decliners |
1,724 |
59% |
|
Russell 2000 |
-5.06 |
1,507.39 |
-0.33% |
|
52 Wk Highs |
15 |
|
|
52 Wk Highs |
32 |
|
|
S&P 600 |
-4.20 |
917.14 |
-0.46% |
|
52 Wk Lows |
166 |
|
|
52 Wk Lows |
100 |
|
|
 |
Leadership Evaporates Again as Major Indices Slump
Kenneth J. Gruneisen - Passed the CAN SLIM® Master's Exam
Stocks finished sharply lower Thursday. The Dow fell 420 points to 24608. The S&P 500 retreated 36 points to 2677 and the Nasdaq Composite dropped 92 points to 7180. The volume totals reported were higher than the prior session totals on the NYSE and on the Nasdaq exchange, action indicative of greater distributional pressure. Decliners led advancers by a 3-2 margin on the NYSE and on the Nasdaq exchange. New 52-week highs totals contracted and were again outnumbered by rising new 52-week lows totals on both the Nasdaq exchange and the NYSE. Leadership quickly evaporated again, and there were only 5 high-ranked companies from the Leaders List that made new 52-week highs and were listed on the BreakOuts Page, versus the total of 27 on the prior session. Charts used courtesy of www.stockcharts.com
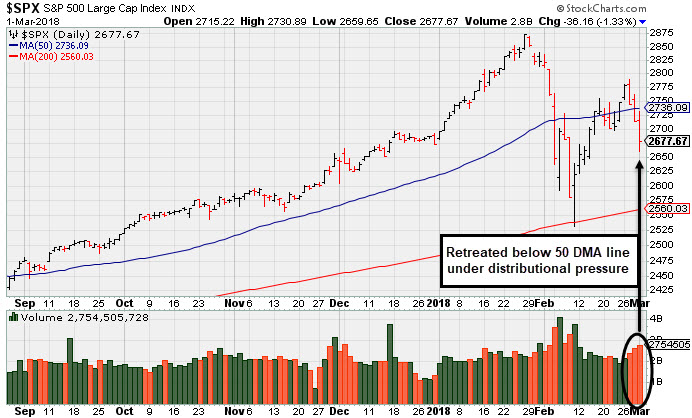 PICTURED: The S&P 500 Index has slumped back below its 50-day moving average (DMA) line with losses on higher volume. The major indices (M criteria) have seen the latest uptrend come under pressure as several distribution days were noted. New buying efforts may be justified under the fact-based investment system, however, only when all key criteria of the fact-based investment system are satisfied. The Featured Stocks Pageprovides the latest analysis on noteworthy high-ranked leaders.
U.S. equities ended a volatile session firmly in negative territory to extend the major averages losing streak into March. Initial gains following commentary by Fed Chair Jerome Powell were erased after President Trump announced new tariffs on steel and aluminum that will begin next week. During testimony to the Senate Banking Committee, Powell said the central bank doesn’t believe the economy is expanding too fast.
On the data front, consumer spending rose 0.2% and personal income increased 0.4% in January. Weekly initial jobless claims unexpectedly fell 10,000 to 210,000 - its lowest level since 1969. The ISM said the pace of manufacturing activity increased in February to a reading of 60.8 vs. a projected decline to 58.7.
All 11 S&P 500 sectors were lower, led by declines of at least 1.7% in Industrials, Financials and Tech. Shares of Monster Beverage (MNST -14.44%) were a notable decliner in the index, falling after posting earnings below forecasts. Retailer Best Buy (BBY +3.95%) rose as its quarterly results topped consensus estimates.
Treasury yields fell with the benchmark 10-year declining five basis points to 2.81%. In commodities, NYMEX WTI crude was down 0.4% to $61.38/barrel. COMEX gold slipped less than 0.1% to $1317.70/ounce.
|
 Kenneth J. Gruneisen started out as a licensed stockbroker in August 1987, a couple of months prior to the historic stock market crash that took the Dow Jones Industrial Average down -22.6% in a single day. He has published daily fact-based fundamental and technical analysis on high-ranked stocks online for two decades. Through FACTBASEDINVESTING.COM, Kenneth provides educational articles, news, market commentary, and other information regarding proven investment systems that work in good times and bad.
Comments contained in the body of this report are technical opinions only and are not necessarily those of Gruneisen Growth Corp. The material herein has been obtained from sources believed to be reliable and accurate, however, its accuracy and completeness cannot be guaranteed. Our firm, employees, and customers may effect transactions, including transactions contrary to any recommendation herein, or have positions in the securities mentioned herein or options with respect thereto. Any recommendation contained in this report may not be suitable for all investors and it is not to be deemed an offer or solicitation on our part with respect to the purchase or sale of any securities. |
|
 |
Gold & Silver Index Rose Amid Broad Based Declines
Kenneth J. Gruneisen - Passed the CAN SLIM® Master's Exam
On Thursday the Retail Index ($RLX -1.02%), Bank Index ($BKX -1.34%) and the Broker/Dealer Index ($XBD -1.12%) finished lower. The tech sector had a negative bias as the Semiconductor Index ($SOX -1.61%), Networking Index ($NWX -0.81%), and the Biotechnology Index ($BTK -1.41%) posted unanimous losses. The Oil Services Index ($OSX -0.13%) and the Integrated Oil Index ($XOI +0.02%) both finished flat. The Gold & Silver Index ($XAU +0.84%) was a standout gainer. Charts courtesy wwwstockcharts.com
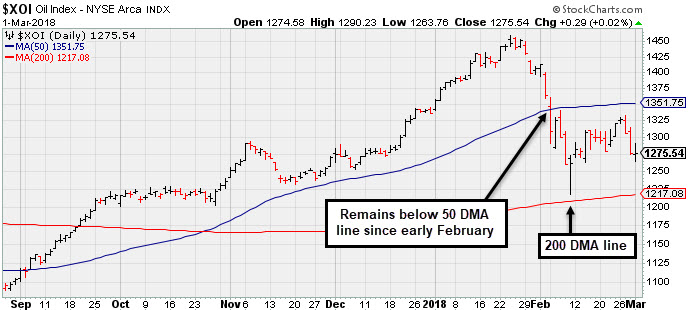 PICTURED: The Oil Services Index ($OSX -0.13%) remains below its 50-day moving average (DMA) line. It halted the recent slide above its longer-term 200 DMA line.
| Oil Services |
$OSX |
133.85 |
-0.17 |
-0.13% |
-10.50% |
| Integrated Oil |
$XOI |
1,275.54 |
+0.29 |
+0.02% |
-4.49% |
| Semiconductor |
$SOX |
1,340.14 |
-21.88 |
-1.61% |
+6.95% |
| Networking |
$NWX |
515.77 |
-4.19 |
-0.81% |
+5.15% |
| Broker/Dealer |
$XBD |
280.17 |
-3.16 |
-1.12% |
+5.63% |
| Retail |
$RLX |
1,962.04 |
-20.15 |
-1.02% |
+13.17% |
| Gold & Silver |
$XAU |
78.93 |
+0.66 |
+0.84% |
-7.44% |
| Bank |
$BKX |
111.19 |
-1.51 |
-1.34% |
+4.20% |
| Biotech |
$BTK |
4,511.48 |
-64.72 |
-1.41% |
+6.85% |
|
|
|
 |
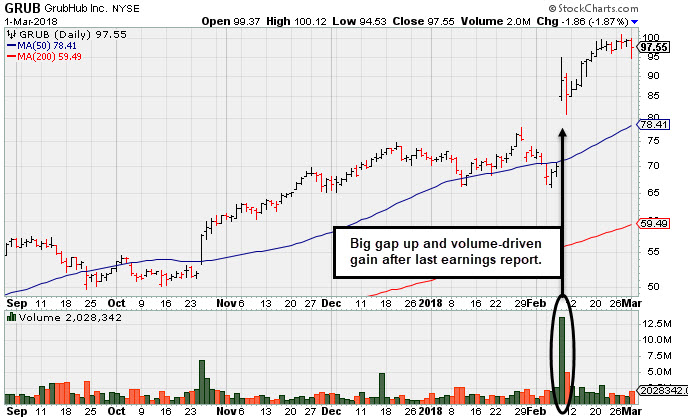
Bullish Action Followed Last Earnings Report
Kenneth J. Gruneisen - Passed the CAN SLIM® Master's Exam
Grubhub Inc (GRUB -$1.86 or -1.87% to $97.55) is perched near its all-time high, very extended from any sound base. Recently it reported earnings +61% on +49% sales revenues for the Dec '17 quarter, followed by bullish action including a big "breakaway gap" on 2/08/18. It was last shown in this FSU section on 2/07/18 with an annotated graph under the headline, "Slumped Below 50-Day Average With Earnings News Due".
Prior to the latest report, Grubhub had reported Sep '17 quarterly earnings +22% on +32% sales revenues, marking a 2nd quarter were below the +25% minimum earnings guideline (C criteria) of the fact-based investment system.
GRUB traded up as much as +128.4% since first highlighted in yellow with pivot point cited based on its 9/29/16 high plus 10 cents in the 4/28/17 mid-day report (read here). Its annual earnings (A criteria) history has been very strong since the high ranked Internet Content firm completed a new Public Offering on 9/03/14.
It has earned a current Timeliness rating of A and a Sponsorship rating of C, and its Accumulation/Distribution rating is B. The number of top-rated funds owning its shares rose from 318 in Jun '16 to 462 in Dec '17, a reassuring sign concerning the I criteria. The current Up/Down Volume Ratio of 1.8 is an unbiased indication its shares have been under accumulation over the past 50 days. It has a fairly small supply of only 86.7 million shares (S criteria) outstanding, which can contribute to greater price volatility in the event of institutional buying or selling.
|
|
|
Color Codes Explained :
Y - Better candidates highlighted by our
staff of experts.
G - Previously featured
in past reports as yellow but may no longer be buyable under the
guidelines.
***Last / Change / Volume data in this table is the closing quote data***
Symbol/Exchange
Company Name
Industry Group |
PRICE |
CHANGE
(%Change) |
Day High |
Volume
(% DAV)
(% 50 day avg vol) |
52 Wk Hi
% From Hi |
Featured
Date |
Price
Featured |
Pivot Featured |
|
Max Buy |
TPL
-
NYSE
Texas Pacific Land Trust
FINANCIAL SERVICES - Diversified Investments
|
$517.00
|
-22.08
-4.10% |
$547.37
|
16,984
89.39% of 50 DAV
50 DAV is 19,000
|
$569.99
-9.30%
|
2/20/2018
|
$517.00
|
PP = $569.99
|
|
MB = $598.49
|
Most Recent Note - 2/27/2018 1:59:32 PM
Y - Still consolidating in an orderly fashion above its 50 DMA line ($493.23). A valid secondary buy point exists up to +5% above the latest high after it successfully tested the 10 week moving average (WMA) line following an earlier technical breakout. Reported earnings +29% on +118% sales revenues for the Dec '17 quarter.
>>> FEATURED STOCK ARTICLE : Finding Support Above 50-Day Moving Average Line - 2/22/2018 |
View all notes |
Set NEW NOTE alert |
Company Profile |
SEC
News |
Chart |
Request a new note
C
A
S
I |
YY
-
NASDAQ
YY Inc
INTERNET - Internet Service Providers
|
$127.47
|
-1.86
-1.44% |
$134.50
|
1,338,658
119.20% of 50 DAV
50 DAV is 1,123,000
|
$142.97
-10.84%
|
12/29/2017
|
$113.06
|
PP = $123.58
|
|
MB = $129.76
|
Most Recent Note - 2/27/2018 6:04:05 PM
G - Consolidating above its 50 DMA line ($125.72). It has not formed a sound new base. Due to report earnings news on Monday. See the latest FSU analysis for more details and a new annotated graph.
>>> FEATURED STOCK ARTICLE : Earnings News Due Next Week for Chinese Social Platform - 2/27/2018 |
View all notes |
Set NEW NOTE alert |
Company Profile |
SEC
News |
Chart |
Request a new note
C
A
S
I |
LOGM
-
NASDAQ
Logmein Inc
INTERNET - Internet Software andamp; Services
|
$117.05
|
+1.50
1.30% |
$117.55
|
452,738
72.00% of 50 DAV
50 DAV is 628,800
|
$134.80
-13.17%
|
2/15/2018
|
$132.35
|
PP = $129.61
|
|
MB = $136.09
|
 Most Recent Note - 3/1/2018 5:27:31 PM
G - A rebound above the 50 DMA line ($120.28) is still needed to help its outlook improve. Its Relative Strength rating is 63, well below the 80+ minimum guideline for buy candidates. Found support recently at its 200 DMA line.
>>> FEATURED STOCK ARTICLE : Technical Breakout Came Ahead of Earnings News - 2/15/2018 |
View all notes |
Set NEW NOTE alert |
Company Profile |
SEC
News |
Chart |
Request a new note
C
A
S
I |
HTHT
-
NASDAQ
China Lodging Group Ads
LEISURE - Lodging
|
$148.49
|
-3.41
-2.24% |
$152.94
|
302,913
52.41% of 50 DAV
50 DAV is 578,000
|
$166.19
-10.65%
|
12/22/2017
|
$138.07
|
PP = $142.90
|
|
MB = $150.05
|
Most Recent Note - 2/27/2018 2:04:50 PM
G - Consolidating just above its 50 DMA line ($146.70). It has not formed a sound base.
>>> FEATURED STOCK ARTICLE : Repaired Recent Technical Damage But Has Not Formed a New Base - 2/23/2018 |
View all notes |
Set NEW NOTE alert |
Company Profile |
SEC
News |
Chart |
Request a new note
C
A
S
I |
PETS
-
NASDAQ
Petmed Express Inc
RETAIL - Drug Stores
|
$44.80
|
-0.39
-0.86% |
$45.57
|
447,584
61.65% of 50 DAV
50 DAV is 726,000
|
$57.80
-22.49%
|
1/19/2018
|
$53.59
|
PP = $51.00
|
|
MB = $53.55
|
Most Recent Note - 3/1/2018 5:31:41 PM
G - Slumped further below its 50 DMA line ($46.83) today. Faces resistance due to overhead supply up to the $57 level. Recently reported earnings +83% on +14% sales revenues, continuing its strong earnings track record.
>>> FEATURED STOCK ARTICLE : Sputtering Below 50-Day Average After Negative Reversal - 2/14/2018 |
View all notes |
Set NEW NOTE alert |
Company Profile |
SEC
News |
Chart |
Request a new note
C
A
S
I |
Symbol/Exchange
Company Name
Industry Group |
PRICE |
CHANGE
(%Change) |
Day High |
Volume
(% DAV)
(% 50 day avg vol) |
52 Wk Hi
% From Hi |
Featured
Date |
Price
Featured |
Pivot Featured |
|
Max Buy |
DPZ
-
NYSE
Dominos Pizza Inc
WHOLESALE - Food Wholesale
|
$222.82
|
+0.41
0.18% |
$225.79
|
867,856
76.80% of 50 DAV
50 DAV is 1,130,000
|
$236.00
-5.58%
|
2/20/2018
|
$224.86
|
PP = $222.01
|
|
MB = $233.11
|
Most Recent Note - 2/27/2018 1:46:28 PM
Y - Hovering near its all-time high after rallying above the pivot point cited with big volume-driven gains. Highlighted in the 2/20/18 mid-day report with pivot point cited based on its 1/25/18 high plus 10 cents.
>>> FEATURED STOCK ARTICLE : Popular Pizza Firm Met Resistance Near Prior High - 2/20/2018 |
View all notes |
Set NEW NOTE alert |
Company Profile |
SEC
News |
Chart |
Request a new note
C
A
S
I |
ESNT
-
NYSE
Essent Group Ltd
Finance-MrtgandRel Svc
|
$44.71
|
-0.38
-0.84% |
$45.17
|
559,333
85.19% of 50 DAV
50 DAV is 656,600
|
$50.08
-10.72%
|
10/9/2017
|
$39.75
|
PP = $41.54
|
|
MB = $43.62
|
Most Recent Note - 2/27/2018 1:48:26 PM
G - Quietly consolidating near its 50 DMA line ($46.24). Tested support near its 200 DMA line recently. More damaging losses would raise greater concerns. Reported earnings +16% on +27% sales revenues for the Dec '17 quarter, below the +25% minimum earnings guideline (C criteria), raising fundamental concerns.
>>> FEATURED STOCK ARTICLE : Slumped Below 50-Day Average With Earnings News Due Friday - 2/6/2018 |
View all notes |
Set NEW NOTE alert |
Company Profile |
SEC
News |
Chart |
Request a new note
C
A
S
I |
FIVE
-
NASDAQ
Five Below Inc
Retail-DiscountandVariety
|
$67.14
|
+0.29
0.43% |
$67.85
|
566,822
54.82% of 50 DAV
50 DAV is 1,034,000
|
$73.55
-8.72%
|
1/2/2018
|
$69.16
|
PP = $68.99
|
|
MB = $72.44
|
Most Recent Note - 2/27/2018 1:49:24 PM
G - Still sputtering near its 50 DMA line ($66.48). The recent low ($60.00 on 2/06/18) defines important near-term support to watch on pullbacks.
>>> FEATURED STOCK ARTICLE : Rebound Above 50-day Moving Average is Needed to Help Outlook - 2/12/2018 |
View all notes |
Set NEW NOTE alert |
Company Profile |
SEC
News |
Chart |
Request a new note
C
A
S
I |
SPLK
-
NASDAQ
Splunk Inc
Computer Sftwr-Database
|
$93.64
|
+0.44
0.47% |
$94.76
|
2,524,741
175.94% of 50 DAV
50 DAV is 1,435,000
|
$97.27
-3.73%
|
2/15/2018
|
$96.06
|
PP = $93.68
|
|
MB = $98.36
|
Most Recent Note - 3/1/2018 5:41:06 PM
Y - After the close today it reported earnings +76% on +37% sales revenues for the quarter ended January 31, 2018 versus the year ago period. Hovered at multi-year highs recently and stayed above its 50 DMA line ($89.46) which defines near term support to watch on pullbacks. Since finding support at the 10 WMA after a prior breakout, a valid "secondary buy point" has been noted up to +5% above the 1/24/18 high.
>>> FEATURED STOCK ARTICLE : Pulled Back to 10-Week Moving Average After Technical Breakout - 2/16/2018 |
View all notes |
Set NEW NOTE alert |
Company Profile |
SEC
News |
Chart |
Request a new note
C
A
S
I |
PAYC
-
NYSE
Paycom Software Inc
COMPUTER SOFTWARE and SERVICES - Application Software
|
$98.76
|
-0.16
-0.16% |
$99.85
|
651,568
92.42% of 50 DAV
50 DAV is 705,000
|
$101.43
-2.63%
|
2/15/2018
|
$95.01
|
PP = $93.61
|
|
MB = $98.29
|
Most Recent Note - 3/1/2018 5:30:42 PM
G - Stubbornly holding its ground near its all-time high extended from any sound base. Prior highs in the $93 area define initial support above its 50 DMA line ($88.31). Fundamentals remain strong.
>>> FEATURED STOCK ARTICLE : Fell Below 50 Day Average With Losses on Above Average Volume - 2/8/2018 |
View all notes |
Set NEW NOTE alert |
Company Profile |
SEC
News |
Chart |
Request a new note
C
A
S
I |
Symbol/Exchange
Company Name
Industry Group |
PRICE |
CHANGE
(%Change) |
Day High |
Volume
(% DAV)
(% 50 day avg vol) |
52 Wk Hi
% From Hi |
Featured
Date |
Price
Featured |
Pivot Featured |
|
Max Buy |
GRUB
-
NYSE
Grubhub Inc
COMPUTER SOFTWARE and SERVICES - Technical and System Software
|
$97.55
|
-1.86
-1.87% |
$100.12
|
2,028,023
110.40% of 50 DAV
50 DAV is 1,837,000
|
$101.03
-3.44%
|
6/21/2017
|
$47.33
|
PP = $46.94
|
|
MB = $49.29
|
Most Recent Note - 3/1/2018 5:21:44 PM
G - Perched near its all-time high, very extended from any sound base. Recently reported earnings +61% on +49% sales revenues for the Dec '17 quarter. See the latest FSU analysis for more details and a new annotated graph.
>>> FEATURED STOCK ARTICLE : Bullish Action Followed Last Earnings Report - 3/1/2018 |
View all notes |
Set NEW NOTE alert |
Company Profile |
SEC
News |
Chart |
Request a new note
C
A
S
I |
HQY
-
NASDAQ
Healthequity Inc
COMPUTER SOFTWARE and SERVICES - Healthcare Information Service
|
$54.00
|
-3.58
-6.22% |
$57.55
|
832,209
133.15% of 50 DAV
50 DAV is 625,000
|
$58.28
-7.34%
|
2/20/2018
|
$56.37
|
PP = $55.41
|
|
MB = $58.18
|
Most Recent Note - 3/1/2018 4:34:29 PM
Y - Ended near the session low with a big volume-driven loss today following 4 consecutive volume-driven gains for a new high. A "positive reversal" was noted on 2/23/18 after early lows undercut both its 50 and 200 DMA lines. Wider than usual intra-day price swings are indicative of uncertainty since highlighted in the 2/20/18 mid-day report (read here). Fundamentals remain strong.
>>> FEATURED STOCK ARTICLE : Fundamentals Remained Favorable and Strength Returned - 2/21/2018 |
View all notes |
Set NEW NOTE alert |
Company Profile |
SEC
News |
Chart |
Request a new note
C
A
S
I |
PYPL
-
NASDAQ
Paypal Holdings Inc
Finance-CrdtCard/PmtPr
|
$78.64
|
-0.77
-0.97% |
$80.44
|
8,366,878
85.69% of 50 DAV
50 DAV is 9,764,000
|
$86.32
-8.90%
|
2/1/2018
|
$80.35
|
PP = $79.49
|
|
MB = $83.46
|
Most Recent Note - 3/1/2018 5:32:45 PM
G - Consolidating near its 50 DMA line ($78.34). Subsequent losses below the recent low ($71.63 on 2/09/18) would raise concerns and trigger a more worrisome technical sell signal. Fundamentals remain strong.
>>> FEATURED STOCK ARTICLE : Quietly Consolidating Back Above 50-Day Moving Average - 2/26/2018 |
View all notes |
Set NEW NOTE alert |
Company Profile |
SEC
News |
Chart |
Request a new note
C
A
S
I |
OLLI
-
NASDAQ
Ollie's Bargain Outlet
Retail-DiscountandVariety
|
$59.40
|
+0.05
0.08% |
$59.80
|
301,934
54.30% of 50 DAV
50 DAV is 556,000
|
$61.25
-3.02%
|
11/21/2017
|
$46.78
|
PP = $47.00
|
|
MB = $49.35
|
Most Recent Note - 3/1/2018 5:28:55 PM
G - Holding its ground stubbornly near its all-time high with volume totals cooling. Found prompt support near its 50 DMA line. Prior low ($50.15 on 1/04/18) defines the next important near-term support.
>>> FEATURED STOCK ARTICLE : Consolidating Above 50-Day Moving Average Line - 2/13/2018 |
View all notes |
Set NEW NOTE alert |
Company Profile |
SEC
News |
Chart |
Request a new note
C
A
S
I |
WB
-
NASDAQ
Weibo Corp Cl A Ads
INTERNET - Content
|
$127.78
|
-0.74
-0.58% |
$131.05
|
1,491,156
80.00% of 50 DAV
50 DAV is 1,864,000
|
$142.12
-10.09%
|
1/16/2018
|
$126.33
|
PP = $122.21
|
|
MB = $128.32
|
Most Recent Note - 3/1/2018 5:34:34 PM
Y - Color code is changed to yellow after pulling back below its "max buy" level with light volume behind today's 4th consecutive loss. Recently reported earnings +88% on +77% sales revenues for the Dec '17 quarter, continuing its strong earnings track record.
>>> FEATURED STOCK ARTICLE : Consolidating Near 50-Day Average With Earnings News Due - 2/9/2018 |
View all notes |
Set NEW NOTE alert |
Company Profile |
SEC
News |
Chart |
Request a new note
C
A
S
I |
Symbol/Exchange
Company Name
Industry Group |
PRICE |
CHANGE
(%Change) |
Day High |
Volume
(% DAV)
(% 50 day avg vol) |
52 Wk Hi
% From Hi |
Featured
Date |
Price
Featured |
Pivot Featured |
|
Max Buy |
HLI
-
NYSE
Houlihan Lokey Inc Cl A
Finance-Invest Bnk/Bkrs
|
$45.39
|
-0.83
-1.80% |
$46.16
|
198,372
87.39% of 50 DAV
50 DAV is 227,000
|
$52.81
-14.05%
|
1/3/2018
|
$45.88
|
PP = $47.09
|
|
MB = $49.44
|
Most Recent Note - 2/28/2018 6:04:10 PM
G - Meeting resistance while recently consolidating below its 50 DMA line ($47.45). The recent low ($43.73 on 2/06/18) defines near term support where a violation would raise greater concerns. Earnings +21% for the Dec '17 quarter were below the +25% minimum earnings guideline (C criteria) raising fundamental concerns. See the latest FSU analysis for more details and a new annotated graph.
>>> FEATURED STOCK ARTICLE : Recently Met Resistance at 50-Day Moving Average - 2/28/2018 |
View all notes |
Set NEW NOTE alert |
Company Profile |
SEC
News |
Chart |
Request a new note
C
A
S
I |
|
|
|
THESE ARE NOT BUY RECOMMENDATIONS!
Comments contained in the body of this report are technical
opinions only. The material herein has been obtained
from sources believed to be reliable and accurate, however,
its accuracy and completeness cannot be guaranteed.
This site is not an investment advisor, hence it does
not endorse or recommend any securities or other investments.
Any recommendation contained in this report may not
be suitable for all investors and it is not to be deemed
an offer or solicitation on our part with respect to
the purchase or sale of any securities. All trademarks,
service marks and trade names appearing in this report
are the property of their respective owners, and are
likewise used for identification purposes only.
This report is a service available
only to active Paid Premium Members.
You may opt-out of receiving report notifications
at any time. Questions or comments may be submitted
by writing to Premium Membership Services 665 S.E. 10 Street, Suite 201 Deerfield Beach, FL 33441-5634 or by calling 1-800-965-8307
or 954-785-1121.
|
|
|