You are not logged in.
This means you
CAN ONLY VIEW reports that were published prior to Wednesday, March 26, 2025.
You
MUST UPGRADE YOUR MEMBERSHIP if you want to see any current reports.
AFTER MARKET UPDATE - WEDNESDAY, FEBRUARY 14TH, 2018
Previous After Market Report Next After Market Report >>>
|
|
|
|
DOW |
+253.04 |
24,893.49 |
+1.03% |
|
Volume |
930,395,210 |
+15% |
|
Volume |
2,208,278,750 |
+22% |
|
NASDAQ |
+130.11 |
7,143.62 |
+1.86% |
|
Advancers |
2,080 |
70% |
|
Advancers |
2,200 |
75% |
|
S&P 500 |
+35.69 |
2,698.63 |
+1.34% |
|
Decliners |
907 |
30% |
|
Decliners |
751 |
25% |
|
Russell 2000 |
+27.15 |
1,522.10 |
+1.82% |
|
52 Wk Highs |
39 |
|
|
52 Wk Highs |
41 |
|
|
S&P 600 |
+16.55 |
929.29 |
+1.81% |
|
52 Wk Lows |
78 |
|
|
52 Wk Lows |
81 |
|
|
 |
Big Gain For Nasdaq Composite Index = New Confirmed Rally
Kenneth J. Gruneisen - Passed the CAN SLIM® Master's Exam
Stocks rebounded from early losses to finish firmly higher on Wednesday, Day 4 of a new rally attempt. Disciplined investors will note that the follow-through-day of gains on higher volume was marked by an expansion in leadership (new highs). The Dow, which fell as many as 150 points, rose 253 to 24893. The S&P 500 was down as much as 14 points before closing up 36 at 2698. The Nasdaq Composite overcame a 36 point deficit to end the session with a 130 point gain at 7143. Volume totals reported were higher than the prior session totals on the NYSE and on the Nasdaq exchange, revealing better buying conviction from the institutional crowd. Advancers led decliners by a 2-1 margin on the NYSE and nearly 3-1 on the Nasdaq exchange. New 52-week lows totals increases and again outnumbered new 52-week highs totals on both the NYSE and the Nasdaq exchange. New leadership improved as there were 22 high-ranked companies from the Leaders List that made new 52-week highs and were listed on the BreakOuts Page, versus the total of 11 on the prior session. Charts used courtesy of www.stockcharts.com
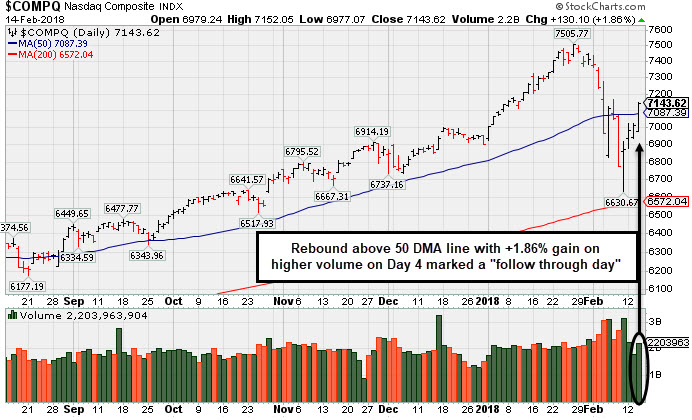 PICTURED: The Nasdaq Composite Index rebounded and closed above its 50-day moving average (DMA) line with a big +1.86% gain on Wednesday marked by higher volume. The meaningful gain came on Day 4 of a new rally attempt. Disciplined investors will note that the follow-through-day of gains on higher volume was marked by an expansion in leadership (new highs). New buying efforts may be justified under the fact-based investment system, however, only when all key criteria of the fact-based investment system are satisfied. The Featured Stocks Page provides the latest analysis on noteworthy high-ranked leaders.
The major averages extended its recovery to a fourth day after opening the session firmly in negative territory. U.S. equities dropped in early trading amid inflation concerns after a report revealed consumer prices rose 2.1% year-over-year in January. Investors also appeared disappointed by an unexpected 0.3% decline in retail sales last month.
The market erased its losses led by rallies in Financial and Technology sectors of at least 2.0%. Shares of J.P. Morgan (JPM +2.31%) and Facebook (FB +3.68%). Chipotle (CMG +15.35%) was the best performing member of the S&P 500, surging after announcing a new CEO to turnaround the company. Utilities were the notable decliner, down more 1.0% on the session, as Duke Energy (DUK -2.08%).
Treasuries fell, sending yields higher along the yield curve. Benchmark 10-year notes climbed 8 basis points to yield 2.91%. In commodities, NYMEX WTI crude was up 2.5% to $60.69/barrel after a report showed weekly U.S. inventories rose less than forecasted. COMEX gold gained 1.8% to $1352.30/ounce amid a weaker dollar. |
 Kenneth J. Gruneisen started out as a licensed stockbroker in August 1987, a couple of months prior to the historic stock market crash that took the Dow Jones Industrial Average down -22.6% in a single day. He has published daily fact-based fundamental and technical analysis on high-ranked stocks online for two decades. Through FACTBASEDINVESTING.COM, Kenneth provides educational articles, news, market commentary, and other information regarding proven investment systems that work in good times and bad.
Comments contained in the body of this report are technical opinions only and are not necessarily those of Gruneisen Growth Corp. The material herein has been obtained from sources believed to be reliable and accurate, however, its accuracy and completeness cannot be guaranteed. Our firm, employees, and customers may effect transactions, including transactions contrary to any recommendation herein, or have positions in the securities mentioned herein or options with respect thereto. Any recommendation contained in this report may not be suitable for all investors and it is not to be deemed an offer or solicitation on our part with respect to the purchase or sale of any securities. |
|
 |
Financial, Tech, Commodity, and Retail Indexes Rose
Kenneth J. Gruneisen - Passed the CAN SLIM® Master's Exam
The Bank Index ($BKX +2.75%), Broker/Dealer Index ($XBD +1.97%), and the Retail Index ($RLX +1.86%) each posted a solid gain on Wednesday. The Biotechnology Index ($BTK +2.83%) and the Semiconductor Index ($SOX +2.23%) led the tech sector while the Networking Index ($NWX +1.56%) also posted a decent gain. The Oil Services Index ($OSX +1.70%) and Integrated Oil Index ($XOI +2.28%) both posted solid gains and the Gold & Silver Index ($XAU +5.49%) was a standout gainer. Charts courtesy wwwstockcharts.com
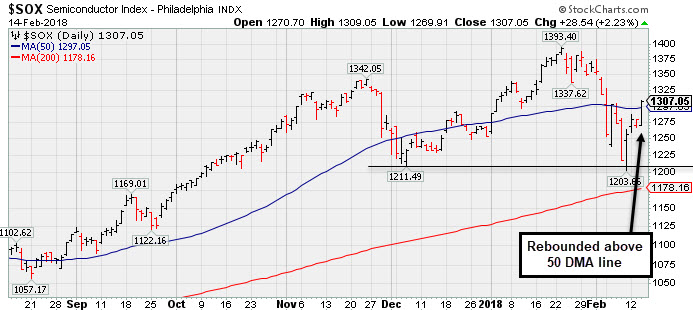 PICTURED: The Semiconductor Index ($SOX +2.23%) rebounded above its 50-day moving average (DMA) line.
| Oil Services |
$OSX |
137.87 |
+2.31 |
+1.70% |
-7.81% |
| Integrated Oil |
$XOI |
1,307.75 |
+29.16 |
+2.28% |
-2.08% |
| Semiconductor |
$SOX |
1,307.05 |
+28.54 |
+2.23% |
+4.31% |
| Networking |
$NWX |
520.99 |
+8.02 |
+1.56% |
+6.21% |
| Broker/Dealer |
$XBD |
279.43 |
+5.40 |
+1.97% |
+5.35% |
| Retail |
$RLX |
1,933.94 |
+35.36 |
+1.86% |
+11.55% |
| Gold & Silver |
$XAU |
85.50 |
+4.44 |
+5.48% |
+0.27% |
| Bank |
$BKX |
113.23 |
+3.02 |
+2.74% |
+6.11% |
| Biotech |
$BTK |
4,651.35 |
+128.14 |
+2.83% |
+10.16% |
|
|
|
 |
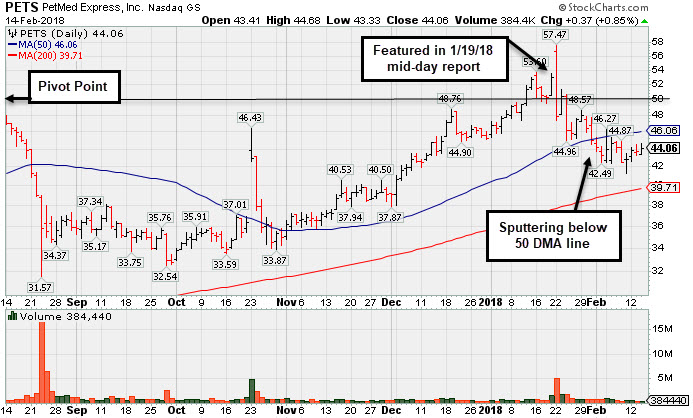
Sputtering Below 50-Day Average After Negative Reversal
Kenneth J. Gruneisen - Passed the CAN SLIM® Master's Exam
Petmed Express Inc (PETS +$0.37 +0.85% $44.06) has failed to rebound and is still sputtering below its 50-day moving average (DMA) line ($46.28) after a "negative reversal" on 1/22/18 following earnings news. A rebound above the 50 DMA line is needed for its outlook improve.
It finished strong after highlighted in yellow with pivot point cited based on its 7/27/17 high plus 10 cents in the earlier mid-day report (read here).
Recently it reported earnings +83% on +14% sales revenues, continuing its strong earnings track record. This Florida-based Retail - Internet firm "Reported earnings +79% on +10% sales revenues for the Sep '17 quarter, its 3rd consecutive quarterly comparison above the +25% minimum guideline (C criteria), helping it better match the fact based investment system's winning models."
The number of top-rated funds owning its shares rose from 247 in Mar '17 to 312 in Dec '17, a reassuring sign concerning the I criteria. Its current Up/Down Volume Ratio of 0.9 is an unbiased indication its shares have been under slight distributional pressure over the past 50 days.
|
|
|
Color Codes Explained :
Y - Better candidates highlighted by our
staff of experts.
G - Previously featured
in past reports as yellow but may no longer be buyable under the
guidelines.
***Last / Change / Volume data in this table is the closing quote data***
Symbol/Exchange
Company Name
Industry Group |
PRICE |
CHANGE
(%Change) |
Day High |
Volume
(% DAV)
(% 50 day avg vol) |
52 Wk Hi
% From Hi |
Featured
Date |
Price
Featured |
Pivot Featured |
|
Max Buy |
TPL
-
NYSE
Texas Pacific Land Trust
FINANCIAL SERVICES - Diversified Investments
|
$497.10
|
+7.08
1.44% |
$503.00
|
12,790
71.06% of 50 DAV
50 DAV is 18,000
|
$569.99
-12.79%
|
12/21/2017
|
$419.50
|
PP = $435.09
|
|
MB = $456.84
|
 Most Recent Note - 2/14/2018 7:38:59 PM
G - Consolidating after getting very extended from the previously noted base. Its 50 DMA line ($475) defines initial support to watch above prior highs in the $435 area. Reported earnings +29% on +118% sales revenues for the Dec '17 quarter.
>>> FEATURED STOCK ARTICLE : Considerable Gains in First 2-3 Weeks After Recent Breakout - 1/23/2018 |
View all notes |
Set NEW NOTE alert |
Company Profile |
SEC
News |
Chart |
Request a new note
C
A
S
I |
YY
-
NASDAQ
YY Inc
INTERNET - Internet Service Providers
|
$128.86
|
+10.24
8.63% |
$130.00
|
1,728,156
147.83% of 50 DAV
50 DAV is 1,169,000
|
$142.97
-9.87%
|
12/29/2017
|
$113.06
|
PP = $123.58
|
|
MB = $129.76
|
Most Recent Note - 2/14/2018 1:21:01 PM
G - Rebounding above its 50 DMA line ($121.61) with a gain today helping its outlook improve, but it has not formed a sound new base of sufficient length.
>>> FEATURED STOCK ARTICLE : Retreating After +78% Rally in 5 Months - 2/2/2018 |
View all notes |
Set NEW NOTE alert |
Company Profile |
SEC
News |
Chart |
Request a new note
C
A
S
I |
HTHT
-
NASDAQ
China Lodging Group Ads
LEISURE - Lodging
|
$145.85
|
+7.03
5.06% |
$146.50
|
350,505
52.63% of 50 DAV
50 DAV is 666,000
|
$166.19
-12.24%
|
12/22/2017
|
$138.07
|
PP = $142.90
|
|
MB = $150.05
|
Most Recent Note - 2/14/2018 7:55:26 PM
G - Consolidating above its 50 DMA line ($140.98), it has not formed a sound base. More damaging losses below the prior low ($128.60 on 2/09/18) the would raise greater concerns.
>>> FEATURED STOCK ARTICLE : Found Support Above Prior High After Latest Breakout - 1/24/2018 |
View all notes |
Set NEW NOTE alert |
Company Profile |
SEC
News |
Chart |
Request a new note
C
A
S
I |
PETS
-
NASDAQ
Petmed Express Inc
RETAIL - Drug Stores
|
$44.06
|
+0.37
0.85% |
$44.68
|
384,440
53.17% of 50 DAV
50 DAV is 723,000
|
$57.80
-23.77%
|
1/19/2018
|
$53.59
|
PP = $51.00
|
|
MB = $53.55
|
Most Recent Note - 2/14/2018 7:34:42 PM
G - Still sputtering below its 50 DMA ($46.28) line, and a rebound above the 50 DMA line is needed to help its outlook improve. Recently reported earnings +83% on +14% sales revenues, continuing its strong earnings track record. See the latest FSU analysis for more details and an annotated graph.
>>> FEATURED STOCK ARTICLE : Sputtering Below 50-Day Average After Negative Reversal - 2/14/2018 |
View all notes |
Set NEW NOTE alert |
Company Profile |
SEC
News |
Chart |
Request a new note
C
A
S
I |
ESNT
-
NYSE
Essent Group Ltd
Finance-MrtgandRel Svc
|
$47.46
|
+1.75
3.83% |
$47.62
|
912,153
129.38% of 50 DAV
50 DAV is 705,000
|
$50.08
-5.23%
|
10/9/2017
|
$39.75
|
PP = $41.54
|
|
MB = $43.62
|
Most Recent Note - 2/14/2018 7:57:44 PM
G - Rebounded above its 50 DMA line ($46.11) with today's 4th consecutive volume-driven gain since slumping near its 200 DMA line ($40.94). More damaging losses would raise greater concerns. Reported earnings +16% on +27% sales revenues for the Dec '17 quarter, below the +25% minimum earnings guideline (C criteria), raising fundamental concerns.
>>> FEATURED STOCK ARTICLE : Slumped Below 50-Day Average With Earnings News Due Friday - 2/6/2018 |
View all notes |
Set NEW NOTE alert |
Company Profile |
SEC
News |
Chart |
Request a new note
C
A
S
I |
Symbol/Exchange
Company Name
Industry Group |
PRICE |
CHANGE
(%Change) |
Day High |
Volume
(% DAV)
(% 50 day avg vol) |
52 Wk Hi
% From Hi |
Featured
Date |
Price
Featured |
Pivot Featured |
|
Max Buy |
FIVE
-
NASDAQ
Five Below Inc
Retail-DiscountandVariety
|
$64.96
|
+0.61
0.95% |
$65.77
|
646,277
54.96% of 50 DAV
50 DAV is 1,176,000
|
$73.55
-11.68%
|
1/2/2018
|
$69.16
|
PP = $68.99
|
|
MB = $72.44
|
Most Recent Note - 2/14/2018 8:00:50 PM
G - Posted a gain today with light volume. A rebound above the 50 DMA line ($66.38) is needed for its outlook to improve. See the latest FSU analysis for more details and an annotated graph.
>>> FEATURED STOCK ARTICLE : Rebound Above 50-day Moving Average is Needed to Help Outlook - 2/12/2018 |
View all notes |
Set NEW NOTE alert |
Company Profile |
SEC
News |
Chart |
Request a new note
C
A
S
I |
MDXG
-
NASDAQ
MiMedx Group Inc
Medical-Products
|
$15.96
|
+0.50
3.23% |
$16.08
|
1,283,430
68.78% of 50 DAV
50 DAV is 1,866,000
|
$18.25
-12.55%
|
1/29/2018
|
$17.43
|
PP = $17.57
|
|
MB = $18.45
|
Most Recent Note - 2/14/2018 7:41:43 PM
Y - Posted a gain today with below average volume. The recent low ($14.61 on 2/09/18) defines near-term support. Concerns were raised after it negated the recent breakout and slumped into the prior base. Disciplined investors always limit losses by selling any stock that falls more than -7% from their purchase price.
>>> FEATURED STOCK ARTICLE : Hit a New High With it 6th Consecutive Gain - 1/29/2018 |
View all notes |
Set NEW NOTE alert |
Company Profile |
SEC
News |
Chart |
Request a new note
C
A
S
I |
ANET
-
NYSE
Arista Networks Inc
TELECOMMUNICATIONS - Communication Equipment
|
$302.12
|
+9.54
3.26% |
$305.44
|
1,465,835
171.44% of 50 DAV
50 DAV is 855,000
|
$292.73
3.21%
|
1/8/2018
|
$248.88
|
PP = $245.75
|
|
MB = $258.04
|
Most Recent Note - 2/14/2018 7:59:31 PM
G - Posted a 4th consecutive gain today with above average volume and hit yet another new all-time high. Its 50 DMA line ($251.73) and prior highs in the $245 area define important support to watch. Due to release its financial results for the quarter and fiscal year ended December 31, 2017 after the market close on Thursday, February 15th.
>>> FEATURED STOCK ARTICLE : Consolidating After Getting Extended From its Prior High - 1/31/2018 |
View all notes |
Set NEW NOTE alert |
Company Profile |
SEC
News |
Chart |
Request a new note
C
A
S
I |
PAYC
-
NYSE
Paycom Software Inc
COMPUTER SOFTWARE and SERVICES - Application Software
|
$92.08
|
+3.18
3.58% |
$92.60
|
1,319,622
192.93% of 50 DAV
50 DAV is 684,000
|
$93.61
-1.63%
|
1/12/2018
|
$87.93
|
PP = $86.20
|
|
MB = $90.51
|
Most Recent Note - 2/14/2018 7:49:37 PM
G - Challenged its prior high with above average volume behind today's 4th consecutive gain. Its color code is changed to green after rising back above its "max buy" level. Found prompt support near its 50 DMA line ($84.56). Recently reported Dec '17 quarterly earnings +61% on +30% sales revenues after the close, continuing its strong earnings track record.
>>> FEATURED STOCK ARTICLE : Fell Below 50 Day Average With Losses on Above Average Volume - 2/8/2018 |
View all notes |
Set NEW NOTE alert |
Company Profile |
SEC
News |
Chart |
Request a new note
C
A
S
I |
GRUB
-
NYSE
Grubhub Inc
COMPUTER SOFTWARE and SERVICES - Technical and System Software
|
$93.39
|
+5.42
6.16% |
$93.93
|
2,575,183
150.77% of 50 DAV
50 DAV is 1,708,000
|
$94.89
-1.58%
|
6/21/2017
|
$47.33
|
PP = $46.94
|
|
MB = $49.29
|
Most Recent Note - 2/14/2018 7:52:11 PM
G - Rallied for a new high close with today's big volume-driven gain, getting more extended from any sound base. Recently reported earnings +61% on +49% sales revenues for the Dec '17 quarter.
>>> FEATURED STOCK ARTICLE : Slumped Below 50-Day Average With Earnings News Due - 2/7/2018 |
View all notes |
Set NEW NOTE alert |
Company Profile |
SEC
News |
Chart |
Request a new note
C
A
S
I |
Symbol/Exchange
Company Name
Industry Group |
PRICE |
CHANGE
(%Change) |
Day High |
Volume
(% DAV)
(% 50 day avg vol) |
52 Wk Hi
% From Hi |
Featured
Date |
Price
Featured |
Pivot Featured |
|
Max Buy |
PYPL
-
NASDAQ
Paypal Holdings Inc
Finance-CrdtCard/PmtPr
|
$77.27
|
+2.30
3.07% |
$77.36
|
8,865,611
86.28% of 50 DAV
50 DAV is 10,275,000
|
$86.32
-10.48%
|
2/1/2018
|
$80.35
|
PP = $79.49
|
|
MB = $83.46
|
Most Recent Note - 2/14/2018 7:37:53 PM
G - Posted a gain today and closed near its 50 DMA line ($77.31) helping its outlook improve. More damaging losses below the recent low ($71.63 on 2/09/18) would raise concerns and trigger a more worrisome technical sell signal.
>>> FEATURED STOCK ARTICLE : Gap Down Following Earnings News Tests Important Support Level - 2/1/2018 |
View all notes |
Set NEW NOTE alert |
Company Profile |
SEC
News |
Chart |
Request a new note
C
A
S
I |
OLLI
-
NASDAQ
Ollie's Bargain Outlet
Retail-DiscountandVariety
|
$56.15
|
+1.35
2.46% |
$56.60
|
306,733
48.46% of 50 DAV
50 DAV is 633,000
|
$58.50
-4.02%
|
11/21/2017
|
$46.78
|
PP = $47.00
|
|
MB = $49.35
|
Most Recent Note - 2/13/2018 6:19:31 PM
G - Holding its ground quietly, it managed two positive reversals last week after intra-day dips below its 50 DMA line ($53.21) raised concerns. Prior low ($50.15 on 1/04/18) defines the next important near-term support. See the latest FSU analysis for more details and a new annotated graph.
>>> FEATURED STOCK ARTICLE : Consolidating Above 50-Day Moving Average Line - 2/13/2018 |
View all notes |
Set NEW NOTE alert |
Company Profile |
SEC
News |
Chart |
Request a new note
C
A
S
I |
WB
-
NASDAQ
Weibo Corp
INTERNET - Content
|
$139.64
|
+9.98
7.70% |
$140.00
|
4,040,357
227.86% of 50 DAV
50 DAV is 1,773,200
|
$136.19
2.53%
|
1/16/2018
|
$126.33
|
PP = $122.21
|
|
MB = $128.32
|
Most Recent Note - 2/14/2018 1:13:11 PM
G - Hitting a new all-time high with today's 4th consecutive gain backed by above average volume, rallying further above its "max buy" level. Recently reported earnings +88% on +77% sales revenues for the Dec '17 quarter, continuing its strong earnings track record.
>>> FEATURED STOCK ARTICLE : Consolidating Near 50-Day Average With Earnings News Due - 2/9/2018 |
View all notes |
Set NEW NOTE alert |
Company Profile |
SEC
News |
Chart |
Request a new note
C
A
S
I |
HLI
-
NYSE
Houlihan Lokey Inc Cl A
Finance-Invest Bnk/Bkrs
|
$47.00
|
-0.08
-0.17% |
$47.57
|
415,321
192.28% of 50 DAV
50 DAV is 216,000
|
$52.81
-11.00%
|
1/3/2018
|
$45.88
|
PP = $47.09
|
|
MB = $49.44
|
Most Recent Note - 2/14/2018 7:44:41 PM
G - Consolidating near its 50 DMA line ($47.16). The recent low ($43.73 on 2/06/18) defines near term support where a violation would raise greater concerns. Recently reported earnings +21% on +5% sales revenues for the Dec '17 quarter, below the +25% minimum earnings guideline (C criteria), raising fundamental concerns. On 10/26/17 it completed a Secondary Offering.
>>> FEATURED STOCK ARTICLE : Damaging Violation of 50-Day Moving Average Line - 2/5/2018 |
View all notes |
Set NEW NOTE alert |
Company Profile |
SEC
News |
Chart |
Request a new note
C
A
S
I |
|
|
|
THESE ARE NOT BUY RECOMMENDATIONS!
Comments contained in the body of this report are technical
opinions only. The material herein has been obtained
from sources believed to be reliable and accurate, however,
its accuracy and completeness cannot be guaranteed.
This site is not an investment advisor, hence it does
not endorse or recommend any securities or other investments.
Any recommendation contained in this report may not
be suitable for all investors and it is not to be deemed
an offer or solicitation on our part with respect to
the purchase or sale of any securities. All trademarks,
service marks and trade names appearing in this report
are the property of their respective owners, and are
likewise used for identification purposes only.
This report is a service available
only to active Paid Premium Members.
You may opt-out of receiving report notifications
at any time. Questions or comments may be submitted
by writing to Premium Membership Services 665 S.E. 10 Street, Suite 201 Deerfield Beach, FL 33441-5634 or by calling 1-800-965-8307
or 954-785-1121.
|
|
|