You are not logged in.
This means you
CAN ONLY VIEW reports that were published prior to Sunday, April 13, 2025.
You
MUST UPGRADE YOUR MEMBERSHIP if you want to see any current reports.
AFTER MARKET UPDATE - MONDAY, FEBRUARY 12TH, 2018
Previous After Market Report Next After Market Report >>>
|
|
|
|
DOW |
+410.37 |
24,601.27 |
+1.70% |
|
Volume |
1,027,770,410 |
-22% |
|
Volume |
2,238,781,860 |
-29% |
|
NASDAQ |
+107.47 |
6,981.96 |
+1.56% |
|
Advancers |
2,195 |
73% |
|
Advancers |
1,925 |
65% |
|
S&P 500 |
+36.45 |
2,656.00 |
+1.39% |
|
Decliners |
792 |
27% |
|
Decliners |
1,015 |
35% |
|
Russell 2000 |
+13.15 |
1,490.98 |
+0.89% |
|
52 Wk Highs |
11 |
|
|
52 Wk Highs |
33 |
|
|
S&P 600 |
+8.51 |
911.31 |
+0.94% |
|
52 Wk Lows |
78 |
|
|
52 Wk Lows |
48 |
|
|
 |
Major Indices Bounced Back With Less Volume and Thin Leadership
Kenneth J. Gruneisen - Passed the CAN SLIM® Master's Exam
Stocks finished higher Monday. The Dow climbed 410 points to 24601. The S&P 500 gained 36 points to 2656 while the Nasdaq Composite was up 107 points to 6981. Volume totals reported were lighter than the prior session totals on the NYSE and on the Nasdaq exchange. Advancers led decliners by nearly a 3-1 margin on the NYSE and nearly 2-1 on the Nasdaq exchange. New 52-week lows totals again outnumbered new 52-week highs totals on both the NYSE and the Nasdaq exchange. New leadership remained elusive as there were 7 high-ranked companies from the Leaders List that made new 52-week highs and were listed on the BreakOuts Page, versus the total of 4 on the prior session. Heavier distributional pressure on the major averages (M criteria) has been noted since last Monday (read here) as a worrisome "correction" warranting much greater caution. During market corrections investors should avoid new buying efforts and raise cash by quickly reacting to technical sell signals from stocks on a case-by-case basis. Charts used courtesy of www.stockcharts.com
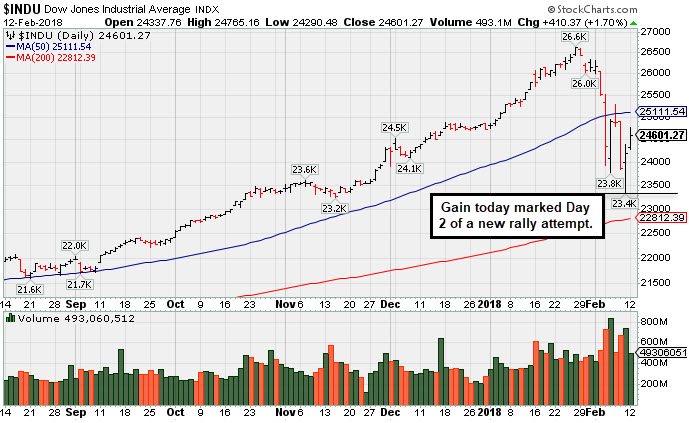 PICTURED: The Dow Jones Industrial Average Index remains below its 50-day moving average (DMA) line. The gain on Monday simply marked Day 2 of a new rally attempt. Disciplined investors will watch carefully for a follow-through-day of gains on higher volume marked by an expansion in leadership (new highs) to signal when new buying efforts are again justified under the fact-based investment system. Meanwhile, patience and caution are paramount. The Featured Stocks Page provides the latest analysis on noteworthy high-ranked leaders.
U.S. equities rebounded from last week’s sell-off, as the S&P 500 found support at Friday’s 200-day moving average level. The Nasdaq Composite returned to positive territory for the year. The major averages were boosted by President Trump’s budget proposal for 2019, which includes a $200 billion infrastructure spending plan.
All 11 S&P 500 sectors closed higher. Technology paced gains as Apple (AAPL +4.03%) and Cisco Systems (CSCO +2.71%) rose. Industrials and Materials also outperformed following President Trump’s infrastructure plan announcement. Boeing (BA +3.30%) and Sherwin-Williams (SHW +1.21%) rose. Ulta Beauty (ULTA -4.15%) was a notable laggard, falling amid reports a lawsuit has been filed against the company. In M&A news, CSRA Inc. (CSRA +31.05%) was up after General Dynamics Corp. (GD -1.21%) announced it will acquire the information technology firm for $9.6 billion.
Treasuries pared early session losses. The yield on the 10-year note had reached a new four-year high of 2.90% before settling up two basis points at 2.85%. In commodities, NYMEX WTI crude added 0.2% to $59.33/barrel, halting a six-day selloff. COMEX gold advanced 0.9% to $1324.20/ounce amid a weaker dollar.
|
 Kenneth J. Gruneisen started out as a licensed stockbroker in August 1987, a couple of months prior to the historic stock market crash that took the Dow Jones Industrial Average down -22.6% in a single day. He has published daily fact-based fundamental and technical analysis on high-ranked stocks online for two decades. Through FACTBASEDINVESTING.COM, Kenneth provides educational articles, news, market commentary, and other information regarding proven investment systems that work in good times and bad.
Comments contained in the body of this report are technical opinions only and are not necessarily those of Gruneisen Growth Corp. The material herein has been obtained from sources believed to be reliable and accurate, however, its accuracy and completeness cannot be guaranteed. Our firm, employees, and customers may effect transactions, including transactions contrary to any recommendation herein, or have positions in the securities mentioned herein or options with respect thereto. Any recommendation contained in this report may not be suitable for all investors and it is not to be deemed an offer or solicitation on our part with respect to the purchase or sale of any securities. |
|
 |
Retail, Financial, Tech, and Commodity-Linked Groups Rose
Kenneth J. Gruneisen - Passed the CAN SLIM® Master's Exam
The Retail Index ($RLX +1.56%), Bank Index ($BKX +1.26%) and the Broker/Dealer Index ($XBD +0.98%) each posted a solid gain on Monday. The Semiconductor Index ($SOX +1.86%) and Biotechnology Index ($BTK +1.92%) led the tech sector while the Networking Index ($NWX +1.32%) posted a smaller gain. Commodity-linked groups had a positive bias as the Gold & Silver Index ($XAU +3.49%), Oil Services Index ($OSX +2.18%) and the Integrated Oil Index ($XOI +1.62%) finished unanimously higher. Charts courtesy wwwstockcharts.com
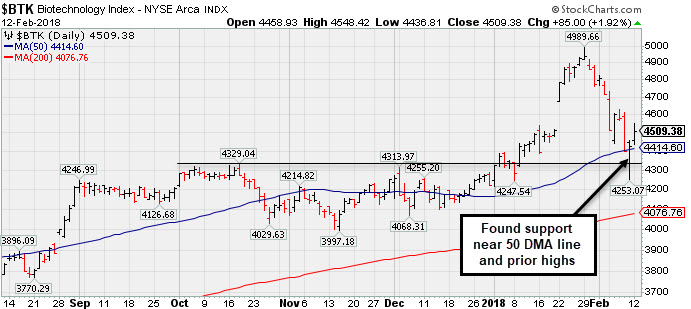 PICTURED: The Biotechnology Index ($BTK +1.92%) found support near prior highs and its 50-day moving average (DMA) line.
| Oil Services |
$OSX |
137.75 |
+2.95 |
+2.19% |
-7.89% |
| Integrated Oil |
$XOI |
1,281.34 |
+20.37 |
+1.62% |
-4.06% |
| Semiconductor |
$SOX |
1,279.14 |
+23.33 |
+1.86% |
+2.08% |
| Networking |
$NWX |
507.10 |
+6.61 |
+1.32% |
+3.38% |
| Broker/Dealer |
$XBD |
272.84 |
+2.64 |
+0.98% |
+2.87% |
| Retail |
$RLX |
1,884.11 |
+28.99 |
+1.56% |
+8.67% |
| Gold & Silver |
$XAU |
81.08 |
+2.73 |
+3.48% |
-4.91% |
| Bank |
$BKX |
109.55 |
+1.37 |
+1.27% |
+2.66% |
| Biotech |
$BTK |
4,509.38 |
+85.00 |
+1.92% |
+6.80% |
|
|
|
 |
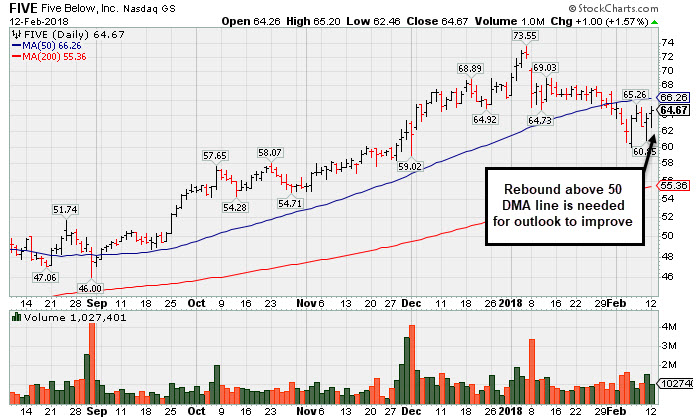
Rebound Above 50-day Moving Average is Needed to Help Outlook
Kenneth J. Gruneisen - Passed the CAN SLIM® Master's Exam
Five Below Inc (FIVE +$1.00 or +1.57% to $64.67) posted a gain with below average volume today. A rebound above the 50-day moving average (DMA) line ($66.26) is needed to help its outlook improve. Weak action on 1/08/18 negated a recent breakout from an advanced "3 weeks tight" base.
FIVE was last shown in this FSU section on 1/17/18 with an annotated graph under the headline, "Consolidating After Negating Breakout From Advanced Base". The subsequent slump below the prior low ($64.73 on 1/10/18) and below its 50-day moving average (DMA) line triggered technical sell signals.
Five Below has traded up as much as +44.89% since highlighted in yellow with new pivot point cited based on its 5/19/17 high plus 10 cents in the 10/06/17 mid-day report (read here). Fundamentals remain very strong as it reported earnings +80% on +29% sales revenues for the Oct '17 quarter, continuing its strong earnings track record. The Retail - Discount & Variety firm has a highest possible 99 Earnings Per Share Rating and matches the fact-based investment system's winning models with a good annual earnings (A criteria) track record. It has been showing acceleration in sales revenues and earnings in sequential quarterly comparisons.
FIVE had a choppy history since its $17 IPO in July 2012 and 3 subsequent Secondary Offerings. It has a small supply of 55.2 million shares outstanding (S criteria). Its current Timeliness Rating is A and its Sponsorship Rating is C. The number of top-rated funds owning its shares rose from 432 in Jun '16 to 460 in Dec '17, a reassuring sign concerning the I criteria. Its current Up/Down Volume Ratio of 1.1 is an unbiased indication its shares have been under slight accumulation over the past 50 days.
|
|
|
Color Codes Explained :
Y - Better candidates highlighted by our
staff of experts.
G - Previously featured
in past reports as yellow but may no longer be buyable under the
guidelines.
***Last / Change / Volume data in this table is the closing quote data***
Symbol/Exchange
Company Name
Industry Group |
PRICE |
CHANGE
(%Change) |
Day High |
Volume
(% DAV)
(% 50 day avg vol) |
52 Wk Hi
% From Hi |
Featured
Date |
Price
Featured |
Pivot Featured |
|
Max Buy |
TPL
-
NYSE
Texas Pacific Land Trust
FINANCIAL SERVICES - Diversified Investments
|
$485.58
|
-7.78
-1.58% |
$500.02
|
20,536
114.09% of 50 DAV
50 DAV is 18,000
|
$569.99
-14.81%
|
12/21/2017
|
$419.50
|
PP = $435.09
|
|
MB = $456.84
|
Most Recent Note - 2/8/2018 4:19:00 PM
G - Consolidating after getting very extended from the previously noted base. Its 50 DMA line ($468) defines initial support to watch above prior highs in the $435 area. Reported earnings +29% on +118% sales revenues for the Dec '17 quarter.
>>> FEATURED STOCK ARTICLE : Considerable Gains in First 2-3 Weeks After Recent Breakout - 1/23/2018 |
View all notes |
Set NEW NOTE alert |
Company Profile |
SEC
News |
Chart |
Request a new note
C
A
S
I |
YY
-
NASDAQ
YY Inc
INTERNET - Internet Service Providers
|
$118.66
|
+1.02
0.87% |
$121.88
|
1,202,007
99.59% of 50 DAV
50 DAV is 1,207,000
|
$142.97
-17.00%
|
12/29/2017
|
$113.06
|
PP = $123.58
|
|
MB = $129.76
|
Most Recent Note - 2/9/2018 6:57:04 PM
G - Posted a big gain with higher volume and ended near the session high. During a streak of 5 consecutive losses it sank below its prior high in the $123 area and well below its 50 DMA line ($120.42) triggering worrisome technical sell signals. Only a prompt rebound above the 50 DMA line would help its outlook improve.
>>> FEATURED STOCK ARTICLE : Retreating After +78% Rally in 5 Months - 2/2/2018 |
View all notes |
Set NEW NOTE alert |
Company Profile |
SEC
News |
Chart |
Request a new note
C
A
S
I |
HTHT
-
NASDAQ
China Lodging Group Ads
LEISURE - Lodging
|
$142.28
|
+8.27
6.17% |
$143.72
|
416,537
59.17% of 50 DAV
50 DAV is 704,000
|
$166.19
-14.39%
|
12/22/2017
|
$138.07
|
PP = $142.90
|
|
MB = $150.05
|
 Most Recent Note - 2/12/2018 5:20:21 PM
G - Rebounded above its 50 DMA line ($139.57) with today's big gain backed by below average volume. More damaging losses would raise greater concerns.
>>> FEATURED STOCK ARTICLE : Found Support Above Prior High After Latest Breakout - 1/24/2018 |
View all notes |
Set NEW NOTE alert |
Company Profile |
SEC
News |
Chart |
Request a new note
C
A
S
I |
PETS
-
NASDAQ
Petmed Express Inc
RETAIL - Drug Stores
|
$43.86
|
+0.99
2.31% |
$44.17
|
417,610
57.60% of 50 DAV
50 DAV is 725,000
|
$57.80
-24.12%
|
1/19/2018
|
$53.59
|
PP = $51.00
|
|
MB = $53.55
|
Most Recent Note - 2/8/2018 4:21:52 PM
G - Slumped further below its 50 DMA line ($45.95) with today's loss on light volume. Only a prompt rebound above the 50 DMA line would help its outlook improve. Recently reported earnings +83% on +14% sales revenues, continuing its strong earnings track record.
>>> FEATURED STOCK ARTICLE : Strong Finish Ahead of Earnings News Next Week - 1/19/2018 |
View all notes |
Set NEW NOTE alert |
Company Profile |
SEC
News |
Chart |
Request a new note
C
A
S
I |
ESNT
-
NYSE
Essent Group Ltd
Finance-MrtgandRel Svc
|
$44.74
|
+0.82
1.87% |
$45.50
|
1,492,591
216.95% of 50 DAV
50 DAV is 688,000
|
$50.08
-10.66%
|
10/9/2017
|
$39.75
|
PP = $41.54
|
|
MB = $43.62
|
Most Recent Note - 2/12/2018 12:27:29 PM
G - Managed a "positive reversal" on the prior session after undercutting prior lows in the $43.00 area and trading near its 200 DMA line ($40.81). More damaging losses would raise greater concerns. Reported earnings +16% on +27% sales revenues for the Dec '17 quarter, below the +25% minimum earnings guideline (C criteria), raising fundamental concerns.
>>> FEATURED STOCK ARTICLE : Slumped Below 50-Day Average With Earnings News Due Friday - 2/6/2018 |
View all notes |
Set NEW NOTE alert |
Company Profile |
SEC
News |
Chart |
Request a new note
C
A
S
I |
Symbol/Exchange
Company Name
Industry Group |
PRICE |
CHANGE
(%Change) |
Day High |
Volume
(% DAV)
(% 50 day avg vol) |
52 Wk Hi
% From Hi |
Featured
Date |
Price
Featured |
Pivot Featured |
|
Max Buy |
FIVE
-
NASDAQ
Five Below Inc
Retail-DiscountandVariety
|
$64.67
|
+1.00
1.57% |
$65.20
|
1,022,169
81.90% of 50 DAV
50 DAV is 1,248,000
|
$73.55
-12.07%
|
1/2/2018
|
$69.16
|
PP = $68.99
|
|
MB = $72.44
|
Most Recent Note - 2/12/2018 5:18:41 PM
G - Posted a gain today with below average volume. A rebound above the 50 DMA line ($66.26) is needed for its outlook to improve. See the latest FSU analysis for more details and a new annotated graph.
>>> FEATURED STOCK ARTICLE : Rebound Above 50-day Moving Average is Needed to Help Outlook - 2/12/2018 |
View all notes |
Set NEW NOTE alert |
Company Profile |
SEC
News |
Chart |
Request a new note
C
A
S
I |
MDXG
-
NASDAQ
MiMedx Group Inc
Medical-Products
|
$15.69
|
+0.35
2.28% |
$16.02
|
1,146,257
60.27% of 50 DAV
50 DAV is 1,902,000
|
$18.25
-14.03%
|
1/29/2018
|
$17.43
|
PP = $17.57
|
|
MB = $18.45
|
Most Recent Note - 2/8/2018 4:17:44 PM
Y - Ended at the session low with a big loss today with below average volume. Disciplined investors always limit losses by selling any stock that falls more than -7% from their purchase price.
>>> FEATURED STOCK ARTICLE : Hit a New High With it 6th Consecutive Gain - 1/29/2018 |
View all notes |
Set NEW NOTE alert |
Company Profile |
SEC
News |
Chart |
Request a new note
C
A
S
I |
ANET
-
NYSE
Arista Networks Inc
TELECOMMUNICATIONS - Communication Equipment
|
$284.54
|
+11.99
4.40% |
$287.17
|
1,265,111
148.66% of 50 DAV
50 DAV is 851,000
|
$289.07
-1.57%
|
1/8/2018
|
$248.88
|
PP = $245.75
|
|
MB = $258.04
|
Most Recent Note - 2/9/2018 7:02:28 PM
G - Posted a 3rd gain with above average volume in the span of 4 session and it remains perched near its all-time high. Its 50 DMA line ($248) and prior highs in the $245 area define important support to watch. Due to release its financial results for the quarter and fiscal year ended December 31, 2017 after the market close on Thursday, February 15th.
>>> FEATURED STOCK ARTICLE : Consolidating After Getting Extended From its Prior High - 1/31/2018 |
View all notes |
Set NEW NOTE alert |
Company Profile |
SEC
News |
Chart |
Request a new note
C
A
S
I |
PAYC
-
NYSE
Paycom Software Inc
COMPUTER SOFTWARE and SERVICES - Application Software
|
$84.51
|
+1.16
1.39% |
$85.16
|
950,973
141.94% of 50 DAV
50 DAV is 670,000
|
$93.61
-9.72%
|
1/12/2018
|
$87.93
|
PP = $86.20
|
|
MB = $90.51
|
Most Recent Note - 2/9/2018 7:05:34 PM
G - Posted a volume-driven gain on Friday but still finished the week below its 50 DMA line ($84.11) after damaging volume-driven losses triggered technical sell signals. Only a prompt rebound above the 50 DMA line would help its outlook improve. Reported Dec '17 quarterly earnings +61% on +30% sales revenues after the close, continuing its strong earnings track record. See the latest FSU analysis for more details and an annotated graph.
>>> FEATURED STOCK ARTICLE : Fell Below 50 Day Average With Losses on Above Average Volume - 2/8/2018 |
View all notes |
Set NEW NOTE alert |
Company Profile |
SEC
News |
Chart |
Request a new note
C
A
S
I |
GRUB
-
NYSE
Grubhub Inc
COMPUTER SOFTWARE and SERVICES - Technical and System Software
|
$86.70
|
+1.16
1.36% |
$88.78
|
2,811,009
166.23% of 50 DAV
50 DAV is 1,691,000
|
$94.89
-8.63%
|
6/21/2017
|
$47.33
|
PP = $46.94
|
|
MB = $49.29
|
Most Recent Note - 2/12/2018 12:36:28 PM
G - Reported earnings +61% on +49% sales revenues for the Dec '17 quarter. Extended from any sound base. Gapped up on 2/08/18 repairing recent technical damage with a considerable volume-driven gain hitting a new all-time high.
>>> FEATURED STOCK ARTICLE : Slumped Below 50-Day Average With Earnings News Due - 2/7/2018 |
View all notes |
Set NEW NOTE alert |
Company Profile |
SEC
News |
Chart |
Request a new note
C
A
S
I |
Symbol/Exchange
Company Name
Industry Group |
PRICE |
CHANGE
(%Change) |
Day High |
Volume
(% DAV)
(% 50 day avg vol) |
52 Wk Hi
% From Hi |
Featured
Date |
Price
Featured |
Pivot Featured |
|
Max Buy |
PYPL
-
NASDAQ
Paypal Holdings Inc
Finance-CrdtCard/PmtPr
|
$75.28
|
+0.53
0.71% |
$76.28
|
10,384,803
96.74% of 50 DAV
50 DAV is 10,735,000
|
$86.32
-12.79%
|
2/1/2018
|
$80.35
|
PP = $79.49
|
|
MB = $83.46
|
Most Recent Note - 2/9/2018 6:58:57 PM
G - Posted a solid gain today with above average volume, but remains below its 50 DMA line after damaging losses marked by heavy volume. Only a prompt rebound above the 50 DMA line ($77.24) would help its outlook improve.
>>> FEATURED STOCK ARTICLE : Gap Down Following Earnings News Tests Important Support Level - 2/1/2018 |
View all notes |
Set NEW NOTE alert |
Company Profile |
SEC
News |
Chart |
Request a new note
C
A
S
I |
OLLI
-
NASDAQ
Ollie's Bargain Outlet
Retail-DiscountandVariety
|
$55.00
|
+0.80
1.48% |
$55.55
|
500,048
78.87% of 50 DAV
50 DAV is 634,000
|
$58.50
-5.98%
|
11/21/2017
|
$46.78
|
PP = $47.00
|
|
MB = $49.35
|
Most Recent Note - 2/12/2018 5:22:42 PM
G - Posted a gain on lighter volume today. Managed two positive reversals last week after intra-day dips below its 50 DMA line ($53.06) raised concerns. Prior low ($50.15 on 1/04/18) defines the next important near-term support.
>>> FEATURED STOCK ARTICLE : Bargain Outlet Looked Expensive Before +114% Rally in 18 Months - 1/18/2018 |
View all notes |
Set NEW NOTE alert |
Company Profile |
SEC
News |
Chart |
Request a new note
C
A
S
I |
WB
-
NASDAQ
Weibo Corp Cl A Ads
INTERNET - Content
|
$118.31
|
+2.96
2.57% |
$119.89
|
2,399,259
138.37% of 50 DAV
50 DAV is 1,734,000
|
$136.19
-13.13%
|
1/16/2018
|
$126.33
|
PP = $122.21
|
|
MB = $128.32
|
Most Recent Note - 2/9/2018 6:53:35 PM
G - Managed a "positive reversal" on Friday and closed above its 50 DMA line ($115.07). Due to report earnings news before the market opens on Tuesday, February 13th. See the latest FSU analysis for more details and a new annotated graph.
>>> FEATURED STOCK ARTICLE : Consolidating Near 50-Day Average With Earnings News Due - 2/9/2018 |
View all notes |
Set NEW NOTE alert |
Company Profile |
SEC
News |
Chart |
Request a new note
C
A
S
I |
HLI
-
NYSE
Houlihan Lokey Inc Cl A
Finance-Invest Bnk/Bkrs
|
$46.45
|
+0.58
1.26% |
$46.83
|
208,448
97.41% of 50 DAV
50 DAV is 214,000
|
$52.81
-12.04%
|
1/3/2018
|
$45.88
|
PP = $47.09
|
|
MB = $49.44
|
Most Recent Note - 2/12/2018 5:23:58 PM
G - Met resistance when trying to rebound above its 50 DMA line ($47.05). Recently reported earnings +21% on +5% sales revenues for the Dec '17 quarter, below the +25% minimum earnings guideline (C criteria), raising fundamental concerns. On 10/26/17 it completed a Secondary Offering.
>>> FEATURED STOCK ARTICLE : Damaging Violation of 50-Day Moving Average Line - 2/5/2018 |
View all notes |
Set NEW NOTE alert |
Company Profile |
SEC
News |
Chart |
Request a new note
C
A
S
I |
|
|
|
THESE ARE NOT BUY RECOMMENDATIONS!
Comments contained in the body of this report are technical
opinions only. The material herein has been obtained
from sources believed to be reliable and accurate, however,
its accuracy and completeness cannot be guaranteed.
This site is not an investment advisor, hence it does
not endorse or recommend any securities or other investments.
Any recommendation contained in this report may not
be suitable for all investors and it is not to be deemed
an offer or solicitation on our part with respect to
the purchase or sale of any securities. All trademarks,
service marks and trade names appearing in this report
are the property of their respective owners, and are
likewise used for identification purposes only.
This report is a service available
only to active Paid Premium Members.
You may opt-out of receiving report notifications
at any time. Questions or comments may be submitted
by writing to Premium Membership Services 665 S.E. 10 Street, Suite 201 Deerfield Beach, FL 33441-5634 or by calling 1-800-965-8307
or 954-785-1121.
|
|
|