You are not logged in.
This means you
CAN ONLY VIEW reports that were published prior to Wednesday, March 26, 2025.
You
MUST UPGRADE YOUR MEMBERSHIP if you want to see any current reports.
AFTER MARKET UPDATE - FRIDAY, FEBRUARY 9TH, 2018
Previous After Market Report Next After Market Report >>>
|
|
|
|
DOW |
+330.44 |
24,190.90 |
+1.38% |
|
Volume |
1,313,235,960 |
+7% |
|
Volume |
3,164,255,900 |
+16% |
|
NASDAQ |
+97.33 |
6,874.49 |
+1.44% |
|
Advancers |
1,775 |
59% |
|
Advancers |
1,732 |
58% |
|
S&P 500 |
+38.55 |
2,619.55 |
+1.49% |
|
Decliners |
1,230 |
41% |
|
Decliners |
1,277 |
42% |
|
Russell 2000 |
+14.04 |
1,477.84 |
+0.96% |
|
52 Wk Highs |
9 |
|
|
52 Wk Highs |
20 |
|
|
S&P 600 |
+9.75 |
902.80 |
+1.09% |
|
52 Wk Lows |
356 |
|
|
52 Wk Lows |
264 |
|
|
 |
Benchmark Index Puts 200-Day Moving Average Line to the Test
Kenneth J. Gruneisen - Passed the CAN SLIM® Master's Exam
For the week the Dow fell 5.2%, the S&P 500 lost 5.2% and the Nasdaq was down 5.1%. Stocks fluctuated in another whirlwind session Friday. The Dow advanced 330 points to 24190, swinging over 1000 points in volatile trading. The S&P 500 gained 38 points to 2619. The Nasdaq Composite added 97 points to 6874. Volume totals reported were higher than the prior session totals on the NYSE and on the Nasdaq exchange. Advancers led decliners by a 3-2 margin on the NYSE and on the Nasdaq exchange. New 52-week lows totals swelled and solidly outnumbered shrinking new 52-week highs totals on both the NYSE and the Nasdaq exchange. New leadership was elusive as there were only 4 high-ranked companies from the Leaders List that made new 52-week highs and were listed on the BreakOuts Page, versus the total of 9 on the prior session. Heavier distributional pressure on the major averages (M criteria) has been noted since Monday (read here) as a worrisome "correction" warranting much greater caution. During market corrections investors should avoid new buying efforts and raise cash by quickly reacting to technical sell signals from stocks on a case-by-case basis. Charts used courtesy of www.stockcharts.com
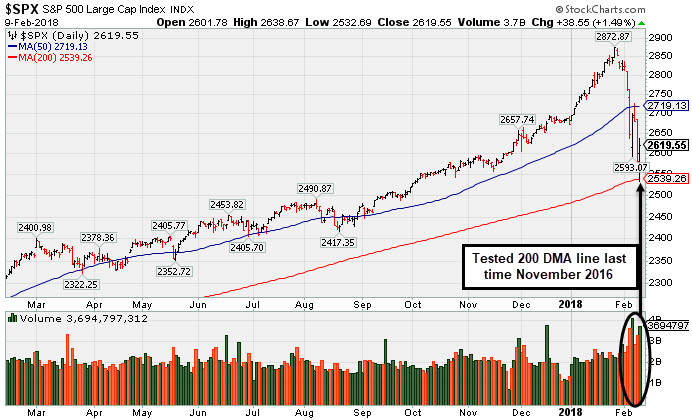 PICTURED: The S&P 500 Index tested its 200-day moving average (DMA) line with early losses and managed a "positive reversal" for a gain on Friday with higher volume than the prior session. The Featured Stocks Page provides the latest analysis on noteworthy high-ranked leaders.
U.S equities oscillated between positive and negative territory Friday, eventually edging higher to close a rocky week. The S&P 500 slipped below its 200-day moving average before rebounding.
Ten of 11 S&P 500 sectors finished higher, with Energy the sole laggard in sympathy with declining oil prices. Technology outperformed with Microsoft (MSFT +3.73%) rising. Nvidia (NVDA +6.69%) soared as the chipmaker topped profit projections and raised its forward guidance. Meanwhile, FedEx (FDX -1.65%) and UPS (UPS -2.64%) fell following Amazon’s (AMZN -0.81%) announcement that the company plans to start its own business delivery service next week.
Treasuries were mixed with the yield on the 10-year note settling up one basis point to 2.85%. In commodities, NYMEX WTI crude fell 3.4% to $59.07/barrel, following the Baker Hughes report that showed that the U.S. oil rig count rose to the highest total since April 2015. COMEX gold was off 0.2% to $1316.10/ounce amid a stronger dollar.
On the data front, a release from the Commerce Department revealed wholesale inventories grew 0.4% in December, above expectations for a 0.2% increase. |
 Kenneth J. Gruneisen started out as a licensed stockbroker in August 1987, a couple of months prior to the historic stock market crash that took the Dow Jones Industrial Average down -22.6% in a single day. He has published daily fact-based fundamental and technical analysis on high-ranked stocks online for two decades. Through FACTBASEDINVESTING.COM, Kenneth provides educational articles, news, market commentary, and other information regarding proven investment systems that work in good times and bad.
Comments contained in the body of this report are technical opinions only and are not necessarily those of Gruneisen Growth Corp. The material herein has been obtained from sources believed to be reliable and accurate, however, its accuracy and completeness cannot be guaranteed. Our firm, employees, and customers may effect transactions, including transactions contrary to any recommendation herein, or have positions in the securities mentioned herein or options with respect thereto. Any recommendation contained in this report may not be suitable for all investors and it is not to be deemed an offer or solicitation on our part with respect to the purchase or sale of any securities. |
|
 |
Financial and Tech Groups Led Friday's Market Bounce
Kenneth J. Gruneisen - Passed the CAN SLIM® Master's Exam
The Bank Index ($BKX +1.98%) and the Broker/Dealer Index ($XBD +1.68%) posted gains and rebounded near their respective 50-day moving average (DMA) lines on Friday. The Semiconductor Index ($SOX +3.05%) led the tech sector's bounce while the Networking Index ($NWX +1.66%) and Biotechnology Index ($BTK +0.57%) posted smaller gains. Commodity-linked groups had a negative bias as the Gold & Silver Index ($XAU -1.90%) and Oil Services Index ($OSX -1.35%) both slid and the Integrated Oil Index ($XOI +0.07%) finished flat. Charts courtesy wwwstockcharts.com
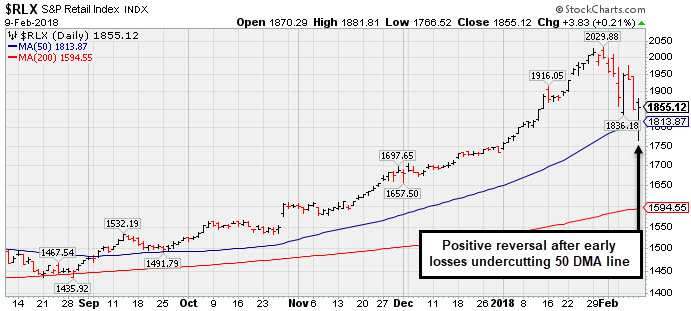 PICTURED: The Retail Index ($RLX +0.21%) managed a "positive reversal" and eked out a small gain on Friday after undercutting its 50 DMA line with a big early loss.
| Oil Services |
$OSX |
134.80 |
-1.86 |
-1.36% |
-9.86% |
| Integrated Oil |
$XOI |
1,260.98 |
+0.86 |
+0.07% |
-5.58% |
| Semiconductor |
$SOX |
1,255.81 |
+37.15 |
+3.05% |
+0.22% |
| Networking |
$NWX |
500.50 |
+8.17 |
+1.66% |
+2.03% |
| Broker/Dealer |
$XBD |
270.20 |
+4.47 |
+1.68% |
+1.87% |
| Retail |
$RLX |
1,855.12 |
+3.83 |
+0.21% |
+7.00% |
| Gold & Silver |
$XAU |
78.35 |
-1.51 |
-1.89% |
-8.12% |
| Bank |
$BKX |
108.18 |
+2.10 |
+1.98% |
+1.38% |
| Biotech |
$BTK |
4,424.38 |
+25.07 |
+0.57% |
+4.79% |
|
|
|
 |
Consolidating Near 50-Day Average With Earnings News Due
Kenneth J. Gruneisen - Passed the CAN SLIM® Master's Exam
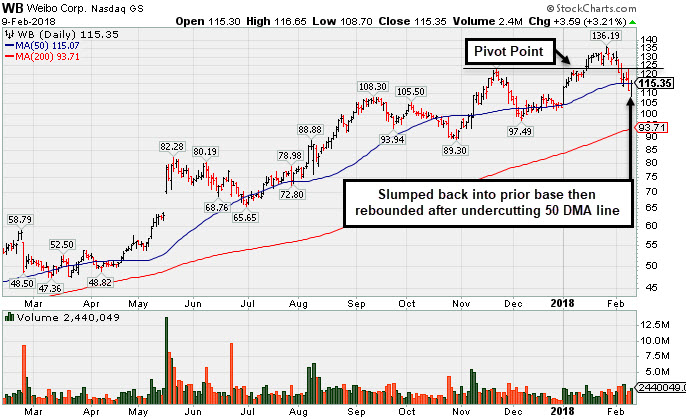
Weibo Corp Cl (WB +$3.59 or +3.21% to $115.35) managed a "positive reversal" and closed Friday's session back above its 50-day moving average ($115.07) helping its outlook improve. Big losses this week triggered a technical sell signal and early weakness initially took it below prior highs in the $123 area and further below the 50 DMA line.
Keep in mind that Weibo is due to announce its unaudited financial results for the fourth quarter of 2017 before the market opens on Tuesday, February 13, 2018. Volume and volatility often increase near earnings news. It reported earnings +113% on +81% sales revenues for the Sep '17 quarter, continuing its strong quarterly earnings track record marked by sales revenues acceleration. Sales revenues rose from the year ago periods by +24%, +36%, +42%, +43%, +67%, +72%, and +81% in the Mar, Jun, Sep, Dec '16, Mar, Jun, and Sep '17 quarters, respectively. The limited annual earnings (A criteria) history for this China-based Internet - Content firm remains a concern. Weibo completed its $17 IPO in April 2014, and in FY '14 and prior years it reported losses.
The number of top-rated funds owning its shares rose from 312 in Mar '17 to 517 in Dec '17, a reassuring sign concerning the I criteria. Its current Up/Down Volume Ratio of 0.9 is an unbiased indication its shares have been under slight distributional pressure over the past 50 days. It has a Timeliness rating of A but a Sponsorship rating of E.
WB was highlighted in yellow in the 1/16/18 mid-day report (read here) with pivot point cited based on its 1/08/18 high after an 8-week cup-with-handle base. Limited annual earnings (A criteria) history for this China-based Internet - Content firm remains a concern. It was last shown in this FSU section on 1/16/18 with an annotated graph under the headline, "Close in Session's Lower Third a Sign of Distributional Pressure".
Charts courtesy wwwstockcharts.com
 |
|
|
Color Codes Explained :
Y - Better candidates highlighted by our
staff of experts.
G - Previously featured
in past reports as yellow but may no longer be buyable under the
guidelines.
***Last / Change / Volume data in this table is the closing quote data***
Symbol/Exchange
Company Name
Industry Group |
PRICE |
CHANGE
(%Change) |
Day High |
Volume
(% DAV)
(% 50 day avg vol) |
52 Wk Hi
% From Hi |
Featured
Date |
Price
Featured |
Pivot Featured |
|
Max Buy |
TPL
-
NYSE
Texas Pacific Land Trust
FINANCIAL SERVICES - Diversified Investments
|
$493.36
|
-4.81
-0.97% |
$506.55
|
20,364
119.79% of 50 DAV
50 DAV is 17,000
|
$569.99
-13.44%
|
12/21/2017
|
$419.50
|
PP = $435.09
|
|
MB = $456.84
|
Most Recent Note - 2/8/2018 4:19:00 PM
G - Consolidating after getting very extended from the previously noted base. Its 50 DMA line ($468) defines initial support to watch above prior highs in the $435 area. Reported earnings +29% on +118% sales revenues for the Dec '17 quarter.
>>> FEATURED STOCK ARTICLE : Considerable Gains in First 2-3 Weeks After Recent Breakout - 1/23/2018 |
View all notes |
Set NEW NOTE alert |
Company Profile |
SEC
News |
Chart |
Request a new note
C
A
S
I |
YY
-
NASDAQ
YY Inc
INTERNET - Internet Service Providers
|
$117.64
|
+6.41
5.76% |
$118.30
|
2,583,915
217.87% of 50 DAV
50 DAV is 1,186,000
|
$142.97
-17.72%
|
12/29/2017
|
$113.06
|
PP = $123.58
|
|
MB = $129.76
|
 Most Recent Note - 2/9/2018 6:57:04 PM
G - Posted a big gain with higher volume and ended near the session high. During a streak of 5 consecutive losses it sank below its prior high in the $123 area and well below its 50 DMA line ($120.42) triggering worrisome technical sell signals. Only a prompt rebound above the 50 DMA line would help its outlook improve.
>>> FEATURED STOCK ARTICLE : Retreating After +78% Rally in 5 Months - 2/2/2018 |
View all notes |
Set NEW NOTE alert |
Company Profile |
SEC
News |
Chart |
Request a new note
C
A
S
I |
HTHT
-
NASDAQ
China Lodging Group Ads
LEISURE - Lodging
|
$134.01
|
+2.00
1.52% |
$136.98
|
405,475
57.11% of 50 DAV
50 DAV is 710,000
|
$166.19
-19.36%
|
12/22/2017
|
$138.07
|
PP = $142.90
|
|
MB = $150.05
|
Most Recent Note - 2/6/2018 5:16:45 PM
G - Recently undercut prior highs in the $142 area and it has been sputtering near its 50 DMA line ($137.72). More damaging losses would raise greater concerns.
>>> FEATURED STOCK ARTICLE : Found Support Above Prior High After Latest Breakout - 1/24/2018 |
View all notes |
Set NEW NOTE alert |
Company Profile |
SEC
News |
Chart |
Request a new note
C
A
S
I |
PETS
-
NASDAQ
Petmed Express Inc
RETAIL - Drug Stores
|
$42.87
|
+0.38
0.89% |
$43.47
|
538,246
74.55% of 50 DAV
50 DAV is 722,000
|
$57.80
-25.83%
|
1/19/2018
|
$53.59
|
PP = $51.00
|
|
MB = $53.55
|
Most Recent Note - 2/8/2018 4:21:52 PM
G - Slumped further below its 50 DMA line ($45.95) with today's loss on light volume. Only a prompt rebound above the 50 DMA line would help its outlook improve. Recently reported earnings +83% on +14% sales revenues, continuing its strong earnings track record.
>>> FEATURED STOCK ARTICLE : Strong Finish Ahead of Earnings News Next Week - 1/19/2018 |
View all notes |
Set NEW NOTE alert |
Company Profile |
SEC
News |
Chart |
Request a new note
C
A
S
I |
ESNT
-
NYSE
Essent Group Ltd
Finance-MrtgandRel Svc
|
$43.92
|
+0.53
1.22% |
$44.30
|
1,556,368
229.86% of 50 DAV
50 DAV is 677,100
|
$50.08
-12.30%
|
10/9/2017
|
$39.75
|
PP = $41.54
|
|
MB = $43.62
|
Most Recent Note - 2/9/2018 12:46:32 PM
G - Reported earnings +16% on +27% sales revenues for the Dec '17 quarter, below the +25% minimum earnings guideline (C criteria), raising fundamental concerns. Undercut the recent lows in the $43.00 area today and traded near its 200 DMA line ($40.81).
>>> FEATURED STOCK ARTICLE : Slumped Below 50-Day Average With Earnings News Due Friday - 2/6/2018 |
View all notes |
Set NEW NOTE alert |
Company Profile |
SEC
News |
Chart |
Request a new note
C
A
S
I |
Symbol/Exchange
Company Name
Industry Group |
PRICE |
CHANGE
(%Change) |
Day High |
Volume
(% DAV)
(% 50 day avg vol) |
52 Wk Hi
% From Hi |
Featured
Date |
Price
Featured |
Pivot Featured |
|
Max Buy |
FIVE
-
NASDAQ
Five Below Inc
Retail-DiscountandVariety
|
$63.67
|
+1.15
1.84% |
$64.28
|
1,511,606
121.71% of 50 DAV
50 DAV is 1,242,000
|
$73.55
-13.43%
|
1/2/2018
|
$69.16
|
PP = $68.99
|
|
MB = $72.44
|
Most Recent Note - 2/6/2018 5:10:26 PM
G - Posted a gain today with near average volume and closed near the session high. Only a prompt rebound above the 50 DMA line ($65.95) would help its outlook improve.
>>> FEATURED STOCK ARTICLE : Consolidating After Negating Breakout From Advanced Base - 1/17/2018 |
View all notes |
Set NEW NOTE alert |
Company Profile |
SEC
News |
Chart |
Request a new note
C
A
S
I |
MDXG
-
NASDAQ
MiMedx Group Inc
Medical-Products
|
$15.34
|
-0.03
-0.20% |
$15.96
|
2,357,466
125.33% of 50 DAV
50 DAV is 1,881,000
|
$18.25
-15.95%
|
1/29/2018
|
$17.43
|
PP = $17.57
|
|
MB = $18.45
|
Most Recent Note - 2/8/2018 4:17:44 PM
Y - Ended at the session low with a big loss today with below average volume. Disciplined investors always limit losses by selling any stock that falls more than -7% from their purchase price.
>>> FEATURED STOCK ARTICLE : Hit a New High With it 6th Consecutive Gain - 1/29/2018 |
View all notes |
Set NEW NOTE alert |
Company Profile |
SEC
News |
Chart |
Request a new note
C
A
S
I |
ANET
-
NYSE
Arista Networks Inc
TELECOMMUNICATIONS - Communication Equipment
|
$272.55
|
+8.03
3.04% |
$274.94
|
1,146,914
136.86% of 50 DAV
50 DAV is 838,000
|
$289.07
-5.71%
|
1/8/2018
|
$248.88
|
PP = $245.75
|
|
MB = $258.04
|
Most Recent Note - 2/9/2018 7:02:28 PM
G - Posted a 3rd gain with above average volume in the span of 4 session and it remains perched near its all-time high. Its 50 DMA line ($248) and prior highs in the $245 area define important support to watch. Due to release its financial results for the quarter and fiscal year ended December 31, 2017 after the market close on Thursday, February 15th.
>>> FEATURED STOCK ARTICLE : Consolidating After Getting Extended From its Prior High - 1/31/2018 |
View all notes |
Set NEW NOTE alert |
Company Profile |
SEC
News |
Chart |
Request a new note
C
A
S
I |
PAYC
-
NYSE
Paycom Software Inc
COMPUTER SOFTWARE and SERVICES - Application Software
|
$83.35
|
+0.45
0.54% |
$84.73
|
1,333,314
203.87% of 50 DAV
50 DAV is 654,000
|
$93.61
-10.96%
|
1/12/2018
|
$87.93
|
PP = $86.20
|
|
MB = $90.51
|
Most Recent Note - 2/9/2018 7:05:34 PM
G - Posted a volume-driven gain on Friday but still finished the week below its 50 DMA line ($84.11) after damaging volume-driven losses triggered technical sell signals. Only a prompt rebound above the 50 DMA line would help its outlook improve. Reported Dec '17 quarterly earnings +61% on +30% sales revenues after the close, continuing its strong earnings track record. See the latest FSU analysis for more details and an annotated graph.
>>> FEATURED STOCK ARTICLE : Fell Below 50 Day Average With Losses on Above Average Volume - 2/8/2018 |
View all notes |
Set NEW NOTE alert |
Company Profile |
SEC
News |
Chart |
Request a new note
C
A
S
I |
GRUB
-
NYSE
Grubhub Inc
COMPUTER SOFTWARE and SERVICES - Technical and System Software
|
$85.54
|
-3.50
-3.93% |
$90.75
|
4,962,596
306.33% of 50 DAV
50 DAV is 1,620,000
|
$94.89
-9.85%
|
6/21/2017
|
$47.33
|
PP = $46.94
|
|
MB = $49.29
|
Most Recent Note - 2/9/2018 12:52:33 PM
G - Pulling back today. Reported earnings +61% on +49% sales revenues for the Dec '17 quarter and gapped on the prior session repairing recent technical damage with a considerable volume-driven gain hitting a new all-time high. Volume and volatility often increase near earnings news. See the latest FSU analysis for more details and an annotated graph.
>>> FEATURED STOCK ARTICLE : Slumped Below 50-Day Average With Earnings News Due - 2/7/2018 |
View all notes |
Set NEW NOTE alert |
Company Profile |
SEC
News |
Chart |
Request a new note
C
A
S
I |
Symbol/Exchange
Company Name
Industry Group |
PRICE |
CHANGE
(%Change) |
Day High |
Volume
(% DAV)
(% 50 day avg vol) |
52 Wk Hi
% From Hi |
Featured
Date |
Price
Featured |
Pivot Featured |
|
Max Buy |
PYPL
-
NASDAQ
Paypal Holdings Inc
Finance-CrdtCard/PmtPr
|
$74.75
|
+2.43
3.36% |
$75.27
|
14,318,678
134.79% of 50 DAV
50 DAV is 10,623,000
|
$86.32
-13.40%
|
2/1/2018
|
$80.35
|
PP = $79.49
|
|
MB = $83.46
|
Most Recent Note - 2/9/2018 6:58:57 PM
G - Posted a solid gain today with above average volume, but remains below its 50 DMA line after damaging losses marked by heavy volume. Only a prompt rebound above the 50 DMA line ($77.24) would help its outlook improve.
>>> FEATURED STOCK ARTICLE : Gap Down Following Earnings News Tests Important Support Level - 2/1/2018 |
View all notes |
Set NEW NOTE alert |
Company Profile |
SEC
News |
Chart |
Request a new note
C
A
S
I |
OLLI
-
NASDAQ
Ollie's Bargain Outlet
Retail-DiscountandVariety
|
$54.20
|
+0.55
1.03% |
$54.80
|
763,045
121.31% of 50 DAV
50 DAV is 629,000
|
$58.50
-7.35%
|
11/21/2017
|
$46.78
|
PP = $47.00
|
|
MB = $49.35
|
Most Recent Note - 2/6/2018 5:22:24 PM
G - Slumped below its 50 DMA line ($52.43) today then managed a "positive reversal" for a gain with above average volume. Prior low ($50.15 on 1/04/18) defines the next important near-term support.
>>> FEATURED STOCK ARTICLE : Bargain Outlet Looked Expensive Before +114% Rally in 18 Months - 1/18/2018 |
View all notes |
Set NEW NOTE alert |
Company Profile |
SEC
News |
Chart |
Request a new note
C
A
S
I |
WB
-
NASDAQ
Weibo Corp Cl A Ads
INTERNET - Content
|
$115.35
|
+3.59
3.21% |
$116.65
|
2,438,876
142.37% of 50 DAV
50 DAV is 1,713,000
|
$136.19
-15.30%
|
1/16/2018
|
$126.33
|
PP = $122.21
|
|
MB = $128.32
|
Most Recent Note - 2/9/2018 6:53:35 PM
G - Managed a "positive reversal" on Friday and closed above its 50 DMA line ($115.07). Due to report earnings news before the market opens on Tuesday, February 13th. See the latest FSU analysis for more details and a new annotated graph.
>>> FEATURED STOCK ARTICLE : Consolidating Near 50-Day Average With Earnings News Due - 2/9/2018 |
View all notes |
Set NEW NOTE alert |
Company Profile |
SEC
News |
Chart |
Request a new note
C
A
S
I |
HLI
-
NYSE
Houlihan Lokey Inc Cl A
Finance-Invest Bnk/Bkrs
|
$45.87
|
-0.19
-0.41% |
$46.79
|
300,997
142.65% of 50 DAV
50 DAV is 211,000
|
$52.81
-13.14%
|
1/3/2018
|
$45.88
|
PP = $47.09
|
|
MB = $49.44
|
Most Recent Note - 2/7/2018 5:28:05 PM
G - Today's gain and close back above the 50 DMA line ($46.93) helped its outlook improve. Recently reported earnings +21% on +5% sales revenues for the Dec '17 quarter, below the +25% minimum earnings guideline (C criteria), raising fundamental concerns. On 10/26/17 it completed a Secondary Offering.
>>> FEATURED STOCK ARTICLE : Damaging Violation of 50-Day Moving Average Line - 2/5/2018 |
View all notes |
Set NEW NOTE alert |
Company Profile |
SEC
News |
Chart |
Request a new note
C
A
S
I |
|
|
|
THESE ARE NOT BUY RECOMMENDATIONS!
Comments contained in the body of this report are technical
opinions only. The material herein has been obtained
from sources believed to be reliable and accurate, however,
its accuracy and completeness cannot be guaranteed.
This site is not an investment advisor, hence it does
not endorse or recommend any securities or other investments.
Any recommendation contained in this report may not
be suitable for all investors and it is not to be deemed
an offer or solicitation on our part with respect to
the purchase or sale of any securities. All trademarks,
service marks and trade names appearing in this report
are the property of their respective owners, and are
likewise used for identification purposes only.
This report is a service available
only to active Paid Premium Members.
You may opt-out of receiving report notifications
at any time. Questions or comments may be submitted
by writing to Premium Membership Services 665 S.E. 10 Street, Suite 201 Deerfield Beach, FL 33441-5634 or by calling 1-800-965-8307
or 954-785-1121.
|
|
|

