You are not logged in.
This means you
CAN ONLY VIEW reports that were published prior to Wednesday, March 26, 2025.
You
MUST UPGRADE YOUR MEMBERSHIP if you want to see any current reports.
AFTER MARKET UPDATE - TUESDAY, FEBRUARY 13TH, 2018
Previous After Market Report Next After Market Report >>>
|
|
|
|
DOW |
+39.18 |
24,640.45 |
+0.16% |
|
Volume |
806,931,380 |
-21% |
|
Volume |
1,817,358,330 |
-19% |
|
NASDAQ |
+31.55 |
7,013.51 |
+0.45% |
|
Advancers |
1,677 |
57% |
|
Advancers |
1,721 |
60% |
|
S&P 500 |
+6.94 |
2,662.94 |
+0.26% |
|
Decliners |
1,282 |
43% |
|
Decliners |
1,168 |
40% |
|
Russell 2000 |
+3.97 |
1,494.95 |
+0.27% |
|
52 Wk Highs |
21 |
|
|
52 Wk Highs |
29 |
|
|
S&P 600 |
+1.43 |
912.74 |
+0.16% |
|
52 Wk Lows |
55 |
|
|
52 Wk Lows |
57 |
|
|
 |
Major Indices Overcame Early Losses to Post Small Gains
Kenneth J. Gruneisen - Passed the CAN SLIM® Master's Exam
The major indices overcame early losses to post modest gains on Tuesday. Volume totals reported were lighter than the prior session totals on the NYSE and on the Nasdaq exchange, revealing a lack of serious buying conviction from the institutional crowd. Advancers led decliners by a 4-3 margin on the NYSE and 3-2 on the Nasdaq exchange. New 52-week lows totals again outnumbered new 52-week highs totals on both the NYSE and the Nasdaq exchange. New leadership remained thin as there were 11 high-ranked companies from the Leaders List that made new 52-week highs and were listed on the BreakOuts Page, versus the total of 7 on the prior session. Heavier distributional pressure on the major averages (M criteria) has been noted since last Monday (read here) as a worrisome "correction" warranting much greater caution. During market corrections investors should avoid new buying efforts and raise cash by quickly reacting to technical sell signals from stocks on a case-by-case basis. Charts used courtesy of www.stockcharts.com
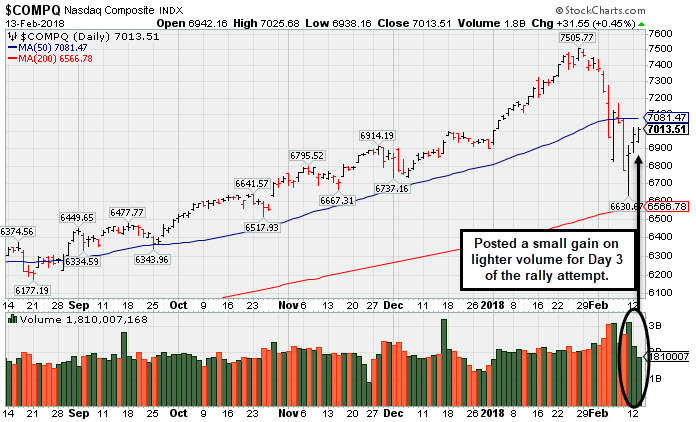 PICTURED: The Nasdaq Composite Index remains below its 50-day moving average (DMA) line. The gain on Tuesday was marked by lighter volume and simply marked Day 3 of a new rally attempt. Disciplined investors will watch carefully for a follow-through-day of gains on higher volume marked by an expansion in leadership (new highs) to signal when new buying efforts are again justified under the fact-based investment system. Meanwhile, patience and caution are paramount. The Featured Stocks Page provides the latest analysis on noteworthy high-ranked leaders.
U.S. equities overcame early losses despite renewed concerns over rising interest rates and as investors awaited January’s inflation update due out Wednesday morning. On the data front, a release revealed small business optimism increased more than anticipated in January to nearly its highest levels in 45 years. In central bank news, Cleveland President Loretta Mester said that the recent stock market sell-off and increased volatility will not damage the economy’s overall strong outlook.
Consumer Discretionary was a notable advancer with Under Armour (UA +16.01%) rising after the athletic apparel maker posted quarterly revenues above analyst estimates. Health Care shares provided a market headwind amid reports Amazon (AMZN +2.04%) will expand its medical supply business. Henry Schein (HSIC -6.64%) and Patterson Companies (PDCO -5.19%) fell after both medical suppliers were named in an FTC antitrust filing. |
 Kenneth J. Gruneisen started out as a licensed stockbroker in August 1987, a couple of months prior to the historic stock market crash that took the Dow Jones Industrial Average down -22.6% in a single day. He has published daily fact-based fundamental and technical analysis on high-ranked stocks online for two decades. Through FACTBASEDINVESTING.COM, Kenneth provides educational articles, news, market commentary, and other information regarding proven investment systems that work in good times and bad.
Comments contained in the body of this report are technical opinions only and are not necessarily those of Gruneisen Growth Corp. The material herein has been obtained from sources believed to be reliable and accurate, however, its accuracy and completeness cannot be guaranteed. Our firm, employees, and customers may effect transactions, including transactions contrary to any recommendation herein, or have positions in the securities mentioned herein or options with respect thereto. Any recommendation contained in this report may not be suitable for all investors and it is not to be deemed an offer or solicitation on our part with respect to the purchase or sale of any securities. |
|
 |
Retail, Financial, Networking, and Biotech Indexes Rose
Kenneth J. Gruneisen - Passed the CAN SLIM® Master's Exam
The Retail Index ($RLX +0.77%), Bank Index ($BKX +0.60%) and the Broker/Dealer Index ($XBD +0.44%) each posted a modest gain on Tuesday. The Networking Index ($NWX +1.16%) posted a decent gain while the Biotechnology Index ($BTK +0.31%) edged higher and the Semiconductor Index ($SOX -0.05%) finished flat. The Oil Services Index ($OSX -1.59%) was a laggard as it fell worse than the Integrated Oil Index ($XOI -0.21%), meanwhile the Gold & Silver Index ($XAU -0.03%) finished unchanged. Charts courtesy wwwstockcharts.com
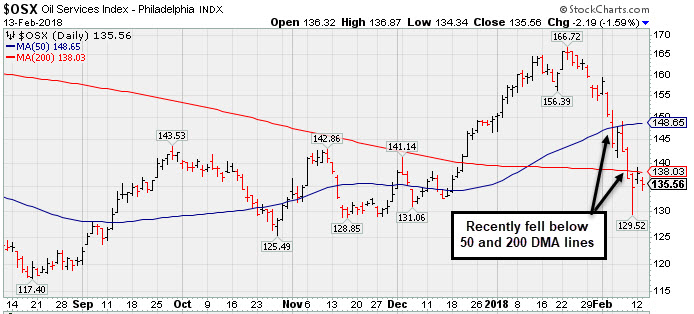 PICTURED: The Oil Services Index ($OSX -1.59%) recently fell below its 50-day and 200-day moving average (DMA) lines.
| Oil Services |
$OSX |
135.56 |
-2.19 |
-1.59% |
-9.35% |
| Integrated Oil |
$XOI |
1,278.59 |
-2.75 |
-0.21% |
-4.27% |
| Semiconductor |
$SOX |
1,278.51 |
-0.63 |
-0.05% |
+2.03% |
| Networking |
$NWX |
512.96 |
+5.86 |
+1.16% |
+4.57% |
| Broker/Dealer |
$XBD |
274.04 |
+1.19 |
+0.44% |
+3.32% |
| Retail |
$RLX |
1,898.58 |
+14.47 |
+0.77% |
+14.79% |
| Gold & Silver |
$XAU |
81.06 |
-0.02 |
-0.02% |
-4.94% |
| Bank |
$BKX |
110.21 |
+0.66 |
+0.60% |
+3.28% |
| Biotech |
$BTK |
4,523.21 |
+13.83 |
+0.31% |
+7.13% |
|
|
|
 |
Consolidating Above 50-Day Moving Average Line
Kenneth J. Gruneisen - Passed the CAN SLIM® Master's Exam
Ollie's Bargain Outlet (OLLI -$0.20 or -0.36% to $54.80) is extended from any sound base. Its 50-day moving average DMA line ($53.21) and recent low ($50.15 on 1/04/18) define important near-term support where damaging violations may trigger more worrisome technical sell signals.
Fundamentals remain very strong. Recently it reported earnings +29% on +18% sales revenues for the Oct '17 quarter, continuing its strong earnings track record and meeting the +25% minimum earnings guideline (C criteria). It has earned a very strong 97 Earnings Per Share (EPS) rating.
The Retail - Discount & Variety firm traded up as much as +121% since highlighted in yellow with a pivot point based on its 4/28/16 high plus 10 cents in 7/19/16 mid-day report (read here). OLLI was last shown in this FSU section on 1/18/18 with an annotated graph under the headline, "Bargain Outlet Looked Expensive Before +114% Rally in 18 Months".
OLLI completed its $16 IPO on 7/16/15. It completed a Secondary Offerings on 6/06/16 and 2/18/16. The number of top-rated funds owning its shares rose from 98 in Sep '15 to 436 in Dec '17, a reassuring sign concerning the I criteria. Its current Up/Down Volume ratio of 1.8 is an unbiased indication its shares have been under accumulation over the past 50 days. The small supply of only 61.7 million shares outstanding (S criteria) can contribute to greater price volatility in the event of institutional buying or selling.
|
|
|
Color Codes Explained :
Y - Better candidates highlighted by our
staff of experts.
G - Previously featured
in past reports as yellow but may no longer be buyable under the
guidelines.
***Last / Change / Volume data in this table is the closing quote data***
Symbol/Exchange
Company Name
Industry Group |
PRICE |
CHANGE
(%Change) |
Day High |
Volume
(% DAV)
(% 50 day avg vol) |
52 Wk Hi
% From Hi |
Featured
Date |
Price
Featured |
Pivot Featured |
|
Max Buy |
TPL
-
NYSE
Texas Pacific Land Trust
FINANCIAL SERVICES - Diversified Investments
|
$490.02
|
+4.44
0.91% |
$499.50
|
8,164
45.36% of 50 DAV
50 DAV is 18,000
|
$569.99
-14.03%
|
12/21/2017
|
$419.50
|
PP = $435.09
|
|
MB = $456.84
|
Most Recent Note - 2/8/2018 4:19:00 PM
G - Consolidating after getting very extended from the previously noted base. Its 50 DMA line ($468) defines initial support to watch above prior highs in the $435 area. Reported earnings +29% on +118% sales revenues for the Dec '17 quarter.
>>> FEATURED STOCK ARTICLE : Considerable Gains in First 2-3 Weeks After Recent Breakout - 1/23/2018 |
View all notes |
Set NEW NOTE alert |
Company Profile |
SEC
News |
Chart |
Request a new note
C
A
S
I |
YY
-
NASDAQ
YY Inc
INTERNET - Internet Service Providers
|
$118.62
|
-0.04
-0.03% |
$120.00
|
1,235,354
105.05% of 50 DAV
50 DAV is 1,176,000
|
$142.97
-17.03%
|
12/29/2017
|
$113.06
|
PP = $123.58
|
|
MB = $129.76
|
Most Recent Note - 2/9/2018 6:57:04 PM
G - Posted a big gain with higher volume and ended near the session high. During a streak of 5 consecutive losses it sank below its prior high in the $123 area and well below its 50 DMA line ($120.42) triggering worrisome technical sell signals. Only a prompt rebound above the 50 DMA line would help its outlook improve.
>>> FEATURED STOCK ARTICLE : Retreating After +78% Rally in 5 Months - 2/2/2018 |
View all notes |
Set NEW NOTE alert |
Company Profile |
SEC
News |
Chart |
Request a new note
C
A
S
I |
HTHT
-
NASDAQ
China Lodging Group Ads
LEISURE - Lodging
|
$138.82
|
-3.46
-2.43% |
$144.15
|
357,552
52.27% of 50 DAV
50 DAV is 684,000
|
$166.19
-16.47%
|
12/22/2017
|
$138.07
|
PP = $142.90
|
|
MB = $150.05
|
Most Recent Note - 2/12/2018 5:20:21 PM
G - Rebounded above its 50 DMA line ($139.57) with today's big gain backed by below average volume. More damaging losses would raise greater concerns.
>>> FEATURED STOCK ARTICLE : Found Support Above Prior High After Latest Breakout - 1/24/2018 |
View all notes |
Set NEW NOTE alert |
Company Profile |
SEC
News |
Chart |
Request a new note
C
A
S
I |
PETS
-
NASDAQ
Petmed Express Inc
RETAIL - Drug Stores
|
$43.69
|
-0.17
-0.39% |
$44.47
|
388,934
53.57% of 50 DAV
50 DAV is 726,000
|
$57.80
-24.41%
|
1/19/2018
|
$53.59
|
PP = $51.00
|
|
MB = $53.55
|
Most Recent Note - 2/8/2018 4:21:52 PM
G - Slumped further below its 50 DMA line ($45.95) with today's loss on light volume. Only a prompt rebound above the 50 DMA line would help its outlook improve. Recently reported earnings +83% on +14% sales revenues, continuing its strong earnings track record.
>>> FEATURED STOCK ARTICLE : Strong Finish Ahead of Earnings News Next Week - 1/19/2018 |
View all notes |
Set NEW NOTE alert |
Company Profile |
SEC
News |
Chart |
Request a new note
C
A
S
I |
ESNT
-
NYSE
Essent Group Ltd
Finance-MrtgandRel Svc
|
$45.71
|
+0.97
2.17% |
$45.79
|
1,021,420
145.27% of 50 DAV
50 DAV is 703,100
|
$50.08
-8.73%
|
10/9/2017
|
$39.75
|
PP = $41.54
|
|
MB = $43.62
|
Most Recent Note - 2/12/2018 12:27:29 PM
G - Managed a "positive reversal" on the prior session after undercutting prior lows in the $43.00 area and trading near its 200 DMA line ($40.81). More damaging losses would raise greater concerns. Reported earnings +16% on +27% sales revenues for the Dec '17 quarter, below the +25% minimum earnings guideline (C criteria), raising fundamental concerns.
>>> FEATURED STOCK ARTICLE : Slumped Below 50-Day Average With Earnings News Due Friday - 2/6/2018 |
View all notes |
Set NEW NOTE alert |
Company Profile |
SEC
News |
Chart |
Request a new note
C
A
S
I |
Symbol/Exchange
Company Name
Industry Group |
PRICE |
CHANGE
(%Change) |
Day High |
Volume
(% DAV)
(% 50 day avg vol) |
52 Wk Hi
% From Hi |
Featured
Date |
Price
Featured |
Pivot Featured |
|
Max Buy |
FIVE
-
NASDAQ
Five Below Inc
Retail-DiscountandVariety
|
$64.35
|
-0.32
-0.49% |
$64.88
|
884,150
72.06% of 50 DAV
50 DAV is 1,227,000
|
$73.55
-12.51%
|
1/2/2018
|
$69.16
|
PP = $68.99
|
|
MB = $72.44
|
Most Recent Note - 2/12/2018 5:18:41 PM
G - Posted a gain today with below average volume. A rebound above the 50 DMA line ($66.26) is needed for its outlook to improve. See the latest FSU analysis for more details and a new annotated graph.
>>> FEATURED STOCK ARTICLE : Rebound Above 50-day Moving Average is Needed to Help Outlook - 2/12/2018 |
View all notes |
Set NEW NOTE alert |
Company Profile |
SEC
News |
Chart |
Request a new note
C
A
S
I |
MDXG
-
NASDAQ
MiMedx Group Inc
Medical-Products
|
$15.46
|
-0.23
-1.47% |
$15.80
|
828,281
43.64% of 50 DAV
50 DAV is 1,898,000
|
$18.25
-15.29%
|
1/29/2018
|
$17.43
|
PP = $17.57
|
|
MB = $18.45
|
Most Recent Note - 2/8/2018 4:17:44 PM
Y - Ended at the session low with a big loss today with below average volume. Disciplined investors always limit losses by selling any stock that falls more than -7% from their purchase price.
>>> FEATURED STOCK ARTICLE : Hit a New High With it 6th Consecutive Gain - 1/29/2018 |
View all notes |
Set NEW NOTE alert |
Company Profile |
SEC
News |
Chart |
Request a new note
C
A
S
I |
ANET
-
NYSE
Arista Networks Inc
TELECOMMUNICATIONS - Communication Equipment
|
$292.58
|
+8.04
2.83% |
$292.73
|
1,011,787
118.75% of 50 DAV
50 DAV is 852,000
|
$289.07
1.21%
|
1/8/2018
|
$248.88
|
PP = $245.75
|
|
MB = $258.04
|
 Most Recent Note - 2/13/2018 6:24:07 PM
G - Posted a 3rd consecutive gain today and hit a new all-time high. Its 50 DMA line ($250) and prior highs in the $245 area define important support to watch. Due to release its financial results for the quarter and fiscal year ended December 31, 2017 after the market close on Thursday, February 15th.
>>> FEATURED STOCK ARTICLE : Consolidating After Getting Extended From its Prior High - 1/31/2018 |
View all notes |
Set NEW NOTE alert |
Company Profile |
SEC
News |
Chart |
Request a new note
C
A
S
I |
PAYC
-
NYSE
Paycom Software Inc
COMPUTER SOFTWARE and SERVICES - Application Software
|
$88.90
|
+4.39
5.19% |
$89.23
|
1,008,811
150.12% of 50 DAV
50 DAV is 672,000
|
$93.61
-5.03%
|
1/12/2018
|
$87.93
|
PP = $86.20
|
|
MB = $90.51
|
Most Recent Note - 2/13/2018 12:28:12 PM
Y - Rebounding back above its 50 DMA line ($84.30) helping its outlook improve and its color code is changed to yellow. Recently reported Dec '17 quarterly earnings +61% on +30% sales revenues after the close, continuing its strong earnings track record.
>>> FEATURED STOCK ARTICLE : Fell Below 50 Day Average With Losses on Above Average Volume - 2/8/2018 |
View all notes |
Set NEW NOTE alert |
Company Profile |
SEC
News |
Chart |
Request a new note
C
A
S
I |
GRUB
-
NYSE
Grubhub Inc
COMPUTER SOFTWARE and SERVICES - Technical and System Software
|
$87.97
|
+1.27
1.46% |
$89.20
|
1,232,135
71.97% of 50 DAV
50 DAV is 1,712,000
|
$94.89
-7.29%
|
6/21/2017
|
$47.33
|
PP = $46.94
|
|
MB = $49.29
|
Most Recent Note - 2/12/2018 12:36:28 PM
G - Reported earnings +61% on +49% sales revenues for the Dec '17 quarter. Extended from any sound base. Gapped up on 2/08/18 repairing recent technical damage with a considerable volume-driven gain hitting a new all-time high.
>>> FEATURED STOCK ARTICLE : Slumped Below 50-Day Average With Earnings News Due - 2/7/2018 |
View all notes |
Set NEW NOTE alert |
Company Profile |
SEC
News |
Chart |
Request a new note
C
A
S
I |
Symbol/Exchange
Company Name
Industry Group |
PRICE |
CHANGE
(%Change) |
Day High |
Volume
(% DAV)
(% 50 day avg vol) |
52 Wk Hi
% From Hi |
Featured
Date |
Price
Featured |
Pivot Featured |
|
Max Buy |
PYPL
-
NASDAQ
Paypal Holdings Inc
Finance-CrdtCard/PmtPr
|
$74.97
|
-0.31
-0.41% |
$75.60
|
7,731,411
74.06% of 50 DAV
50 DAV is 10,439,000
|
$86.32
-13.15%
|
2/1/2018
|
$80.35
|
PP = $79.49
|
|
MB = $83.46
|
Most Recent Note - 2/9/2018 6:58:57 PM
G - Posted a solid gain today with above average volume, but remains below its 50 DMA line after damaging losses marked by heavy volume. Only a prompt rebound above the 50 DMA line ($77.24) would help its outlook improve.
>>> FEATURED STOCK ARTICLE : Gap Down Following Earnings News Tests Important Support Level - 2/1/2018 |
View all notes |
Set NEW NOTE alert |
Company Profile |
SEC
News |
Chart |
Request a new note
C
A
S
I |
OLLI
-
NASDAQ
Ollie's Bargain Outlet
Retail-DiscountandVariety
|
$54.80
|
-0.20
-0.36% |
$55.45
|
326,563
51.43% of 50 DAV
50 DAV is 635,000
|
$58.50
-6.32%
|
11/21/2017
|
$46.78
|
PP = $47.00
|
|
MB = $49.35
|
Most Recent Note - 2/13/2018 6:19:31 PM
G - Holding its ground quietly, it managed two positive reversals last week after intra-day dips below its 50 DMA line ($53.21) raised concerns. Prior low ($50.15 on 1/04/18) defines the next important near-term support. See the latest FSU analysis for more details and a new annotated graph.
>>> FEATURED STOCK ARTICLE : Consolidating Above 50-Day Moving Average Line - 2/13/2018 |
View all notes |
Set NEW NOTE alert |
Company Profile |
SEC
News |
Chart |
Request a new note
C
A
S
I |
WB
-
NASDAQ
Weibo Corp Cl A Ads
INTERNET - Content
|
$129.66
|
+11.35
9.59% |
$130.97
|
4,978,095
289.93% of 50 DAV
50 DAV is 1,717,000
|
$136.19
-4.79%
|
1/16/2018
|
$126.33
|
PP = $122.21
|
|
MB = $128.32
|
Most Recent Note - 2/13/2018 6:22:30 PM
G - Color code is changed to green after rebounding well above its 50 DMA line ($115.64) and closing above its "max buy" level with today's big volume-driven gain. Reported earnings +88% on +77% sales revenues for the Dec '17 quarter, continuing its strong earnings track record.
>>> FEATURED STOCK ARTICLE : Consolidating Near 50-Day Average With Earnings News Due - 2/9/2018 |
View all notes |
Set NEW NOTE alert |
Company Profile |
SEC
News |
Chart |
Request a new note
C
A
S
I |
HLI
-
NYSE
Houlihan Lokey Inc Cl A
Finance-Invest Bnk/Bkrs
|
$47.08
|
+0.63
1.36% |
$47.33
|
250,191
115.83% of 50 DAV
50 DAV is 216,000
|
$52.81
-10.85%
|
1/3/2018
|
$45.88
|
PP = $47.09
|
|
MB = $49.44
|
Most Recent Note - 2/12/2018 5:23:58 PM
G - Met resistance when trying to rebound above its 50 DMA line ($47.05). Recently reported earnings +21% on +5% sales revenues for the Dec '17 quarter, below the +25% minimum earnings guideline (C criteria), raising fundamental concerns. On 10/26/17 it completed a Secondary Offering.
>>> FEATURED STOCK ARTICLE : Damaging Violation of 50-Day Moving Average Line - 2/5/2018 |
View all notes |
Set NEW NOTE alert |
Company Profile |
SEC
News |
Chart |
Request a new note
C
A
S
I |
|
|
|
THESE ARE NOT BUY RECOMMENDATIONS!
Comments contained in the body of this report are technical
opinions only. The material herein has been obtained
from sources believed to be reliable and accurate, however,
its accuracy and completeness cannot be guaranteed.
This site is not an investment advisor, hence it does
not endorse or recommend any securities or other investments.
Any recommendation contained in this report may not
be suitable for all investors and it is not to be deemed
an offer or solicitation on our part with respect to
the purchase or sale of any securities. All trademarks,
service marks and trade names appearing in this report
are the property of their respective owners, and are
likewise used for identification purposes only.
This report is a service available
only to active Paid Premium Members.
You may opt-out of receiving report notifications
at any time. Questions or comments may be submitted
by writing to Premium Membership Services 665 S.E. 10 Street, Suite 201 Deerfield Beach, FL 33441-5634 or by calling 1-800-965-8307
or 954-785-1121.
|
|
|


