You are not logged in.
This means you
CAN ONLY VIEW reports that were published prior to Wednesday, March 26, 2025.
You
MUST UPGRADE YOUR MEMBERSHIP if you want to see any current reports.
AFTER MARKET UPDATE - THURSDAY, FEBRUARY 15TH, 2018
Previous After Market Report Next After Market Report >>>
|
|
|
|
DOW |
+306.88 |
25,200.37 |
+1.23% |
|
Volume |
826,205,780 |
-11% |
|
Volume |
2,113,115,570 |
-4% |
|
NASDAQ |
+112.81 |
7,256.43 |
+1.58% |
|
Advancers |
2,056 |
69% |
|
Advancers |
2,041 |
69% |
|
S&P 500 |
+32.57 |
2,731.20 |
+1.21% |
|
Decliners |
912 |
31% |
|
Decliners |
908 |
31% |
|
Russell 2000 |
+15.10 |
1,537.20 |
+0.99% |
|
52 Wk Highs |
69 |
|
|
52 Wk Highs |
78 |
|
|
S&P 600 |
+8.62 |
937.91 |
+0.93% |
|
52 Wk Lows |
46 |
|
|
52 Wk Lows |
49 |
|
|
 |
Breadth Positive as Leadership in New Rally Improves
Kenneth J. Gruneisen - Passed the CAN SLIM® Master's Exam
U.S. equities closed firmly higher Thursday. The Dow climbed 307 points to 25200. The S&P 500 was up 33 points to 2731 and the Nasdaq Composite added 113 points to 7256. Volume totals reported were lighter than the prior session totals on the NYSE and on the Nasdaq exchange. Breadth was positive as advancers led decliners by more than a 2-1 margin on the NYSE and on the Nasdaq exchange. New 52-week highs totals outnumbered new 52-week lows totals on both the NYSE and the Nasdaq exchange. That marked a favorable shift, as new 52 week lows have decided outnumbered new highs since January 30th. New leadership again improved as there were 42 high-ranked companies from the Leaders List that made new 52-week highs and were listed on the BreakOuts Page, up from the total of 22 on the prior session. Charts used courtesy of www.stockcharts.com
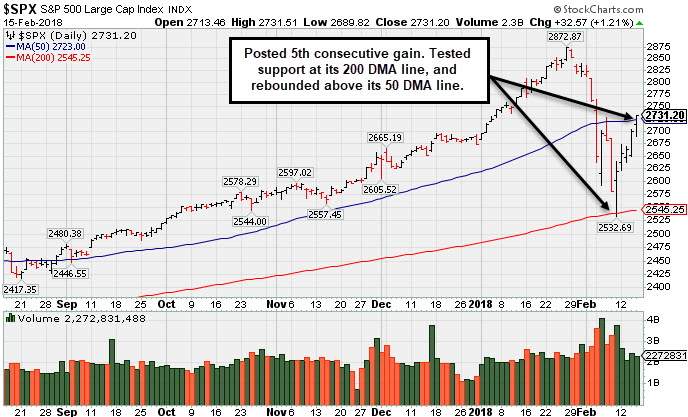 PICTURED: The S&P 500 Index rebounded and closed above its 50-day moving average (DMA) line with a 5th gain since testing support at its 200 DMA line. Wednesday's follow-through-day gain s came on higher volume than the prior session and it was marked by an expansion in leadership (new highs). New buying efforts may be justified under the fact-based investment system, however, only when all key criteria of the fact-based investment system are satisfied. The Featured Stocks Page provides the latest analysis on noteworthy high-ranked leaders.
The major averages advanced for a fifth straight day, on pace for their best week of gains since November 2016. Investors digested a slew of economic data, including a gauge of inflation which showed producer prices rose 0.4% in January, in line with expectations and up from a surprise decline of 0.1% in December. A separate release revealed initial jobless claims rose 7,000 in the most recent week to 230,000, slightly above expectations of 228,000. On the manufacturing front, reports showed industrial production and capacity utilization both slipped modestly last month.
Ten of 11 sectors in the S&P 500 finished higher with Energy the sole laggard. Technology shares paced gains with Cisco Systems (CSCO +4.73%) and Apple (AAPL +3.36%) gaining. Consumer Staples also outperformed with Walmart (WMT +1.50%) and Procter & Gamble (PG +2.14%) rising. In Health Care, Teva Pharmaceuticals (TEVA +7.66%) rallied after Warren Buffett disclosed a new stake in the generic drug maker.
The U.S. Treasury curve flattened slightly, with the yield on the 10-year note finishing unchanged at 2.90%. In commodities, NYMEX WTI crude advanced 1.6% to $61.55/barrel amid a weaker dollar. COMEX gold lost 0.2% to $1353.20/ounce. |
 Kenneth J. Gruneisen started out as a licensed stockbroker in August 1987, a couple of months prior to the historic stock market crash that took the Dow Jones Industrial Average down -22.6% in a single day. He has published daily fact-based fundamental and technical analysis on high-ranked stocks online for two decades. Through FACTBASEDINVESTING.COM, Kenneth provides educational articles, news, market commentary, and other information regarding proven investment systems that work in good times and bad.
Comments contained in the body of this report are technical opinions only and are not necessarily those of Gruneisen Growth Corp. The material herein has been obtained from sources believed to be reliable and accurate, however, its accuracy and completeness cannot be guaranteed. Our firm, employees, and customers may effect transactions, including transactions contrary to any recommendation herein, or have positions in the securities mentioned herein or options with respect thereto. Any recommendation contained in this report may not be suitable for all investors and it is not to be deemed an offer or solicitation on our part with respect to the purchase or sale of any securities. |
|
 |
Retail, Tech, and Financial Groups Rose
Kenneth J. Gruneisen - Passed the CAN SLIM® Master's Exam
The Retail Index ($RLX +1.25%) outpaced the Bank Index ($BKX +0.36%) and Broker/Dealer Index ($XBD +0.40%)on Thursday. The Networking Index ($NWX +2.11%) and the Semiconductor Index ($SOX +1.22%) led the tech sector while the Biotechnology Index ($BTK +0.97%) also posted a decent gain. The Oil Services Index ($OSX -0.96%) and Integrated Oil Index ($XOI -0.34%) edged lower and the Gold & Silver Index ($XAU -0.02%) finished flat. Charts courtesy wwwstockcharts.com
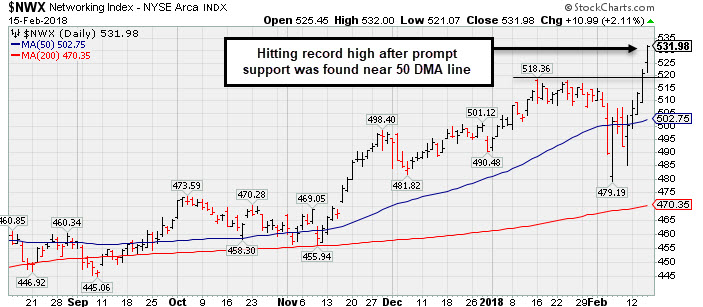 PICTURED: The Networking Index ($NWX +2.11%) found prompt support near its 50-day moving average (DMA) line and rallied to a new record high.
| Oil Services |
$OSX |
136.55 |
-1.32 |
-0.96% |
-8.69% |
| Integrated Oil |
$XOI |
1,303.34 |
-4.40 |
-0.34% |
-2.41% |
| Semiconductor |
$SOX |
1,322.95 |
+15.90 |
+1.22% |
+5.58% |
| Networking |
$NWX |
531.98 |
+10.99 |
+2.11% |
+8.45% |
| Broker/Dealer |
$XBD |
280.56 |
+1.13 |
+0.40% |
+5.78% |
| Retail |
$RLX |
1,958.21 |
+24.27 |
+1.25% |
+12.95% |
| Gold & Silver |
$XAU |
85.48 |
-0.02 |
-0.02% |
+0.25% |
| Bank |
$BKX |
113.64 |
+0.41 |
+0.36% |
+6.49% |
| Biotech |
$BTK |
4,696.47 |
+45.12 |
+0.97% |
+11.23% |
|
|
|
 |
Technical Breakout Came Ahead of Earnings News
Kenneth J. Gruneisen - Passed the CAN SLIM® Master's Exam
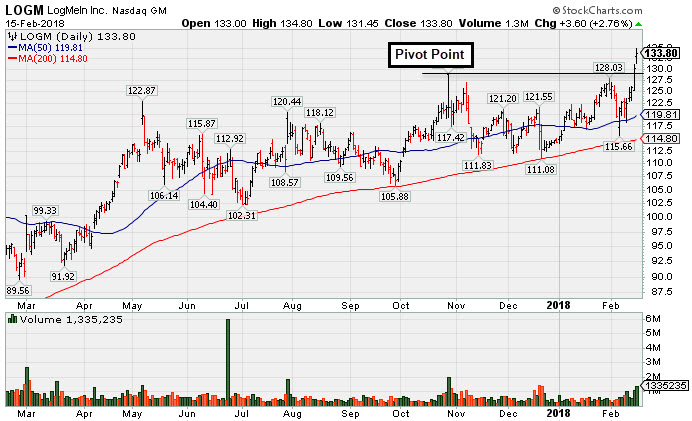
Logmein Inc (LOGM +$3.60 or +2.76% $133.80) was highlighted in yellow with pivot point cited based on its 10/27/17 high plus 10 cents in the earlier mid-day report (read here). Rallying into new all-time high territory after finding support near its 50-day moving average (DMA) line. A strong gain on the prior session triggered a technical buy signal as it rose above the pivot point cited based on its 10/27/17.
After the close it reported Dec '17 earnings +94% on +214% sales revenues versus the year ago period. Volume and volatility often increase near earnings news. Market reactions are based on the combination of the actual news as well as future guidance provided. Reported earnings +107% on +216% sales revenues for the Sep '17 quarter, and prior quarters have been above the +25% minimum guideline (C criteria). Annual earnings (A criteria) history has been strong after a downturn in FY '13).
The number of top-rated funds owning its shares rose from 754 in Jun '17 to 769 in Dec '17, a reassuring sign concerning the I criteria. Its current Up/Down Volume Ratio of 1.6 is an unbiased indication its shares have been under accumulation over the past 50 days. It has earned a Timeliness Rating of A and Sponsorship Rating of C.
|
|
|
Color Codes Explained :
Y - Better candidates highlighted by our
staff of experts.
G - Previously featured
in past reports as yellow but may no longer be buyable under the
guidelines.
***Last / Change / Volume data in this table is the closing quote data***
Symbol/Exchange
Company Name
Industry Group |
PRICE |
CHANGE
(%Change) |
Day High |
Volume
(% DAV)
(% 50 day avg vol) |
52 Wk Hi
% From Hi |
Featured
Date |
Price
Featured |
Pivot Featured |
|
Max Buy |
TPL
-
NYSE
Texas Pacific Land Trust
FINANCIAL SERVICES - Diversified Investments
|
$500.15
|
+3.05
0.61% |
$504.01
|
13,271
73.73% of 50 DAV
50 DAV is 18,000
|
$569.99
-12.25%
|
12/21/2017
|
$419.50
|
PP = $435.09
|
|
MB = $456.84
|
Most Recent Note - 2/14/2018 7:38:59 PM
G - Consolidating after getting very extended from the previously noted base. Its 50 DMA line ($475) defines initial support to watch above prior highs in the $435 area. Reported earnings +29% on +118% sales revenues for the Dec '17 quarter.
>>> FEATURED STOCK ARTICLE : Considerable Gains in First 2-3 Weeks After Recent Breakout - 1/23/2018 |
View all notes |
Set NEW NOTE alert |
Company Profile |
SEC
News |
Chart |
Request a new note
C
A
S
I |
YY
-
NASDAQ
YY Inc
INTERNET - Internet Service Providers
|
$129.02
|
+0.16
0.12% |
$133.59
|
1,251,535
106.79% of 50 DAV
50 DAV is 1,172,000
|
$142.97
-9.76%
|
12/29/2017
|
$113.06
|
PP = $123.58
|
|
MB = $129.76
|
Most Recent Note - 2/14/2018 1:21:01 PM
G - Rebounding above its 50 DMA line ($121.61) with a gain today helping its outlook improve, but it has not formed a sound new base of sufficient length.
>>> FEATURED STOCK ARTICLE : Retreating After +78% Rally in 5 Months - 2/2/2018 |
View all notes |
Set NEW NOTE alert |
Company Profile |
SEC
News |
Chart |
Request a new note
C
A
S
I |
LOGM
-
NASDAQ
Logmein Inc
INTERNET - Internet Software andamp; Services
|
$133.80
|
+3.60
2.76% |
$134.80
|
1,313,474
259.58% of 50 DAV
50 DAV is 506,000
|
$131.20
1.98%
|
2/15/2018
|
$132.35
|
PP = $129.61
|
|
MB = $136.09
|
 Most Recent Note - 2/15/2018 5:53:50 PM
Y - Color code was changed to yellow with pivot point cited based on its 10/27/17 high plus 10 cents. Rallied into new all-time high territory after finding support near its 50 DMA line. A strong gain on the prior session triggered a technical buy signal as it rose above the pivot point. Reported strong Dec '17 results after the close today. Volume and volatility often increase near earnings news. Annual earnings (A criteria) history has been strong after a downturn in FY '13. See the latest FSU analysis for more details and a new annotated graph.
>>> FEATURED STOCK ARTICLE : Technical Breakout Came Ahead of Earnings News - 2/15/2018 |
View all notes |
Set NEW NOTE alert |
Company Profile |
SEC
News |
Chart |
Request a new note
C
A
S
I |
HTHT
-
NASDAQ
China Lodging Group Ads
LEISURE - Lodging
|
$147.47
|
+1.62
1.11% |
$148.88
|
209,993
32.01% of 50 DAV
50 DAV is 656,000
|
$166.19
-11.26%
|
12/22/2017
|
$138.07
|
PP = $142.90
|
|
MB = $150.05
|
Most Recent Note - 2/14/2018 7:55:26 PM
G - Consolidating above its 50 DMA line ($140.98), it has not formed a sound base. More damaging losses below the prior low ($128.60 on 2/09/18) the would raise greater concerns.
>>> FEATURED STOCK ARTICLE : Found Support Above Prior High After Latest Breakout - 1/24/2018 |
View all notes |
Set NEW NOTE alert |
Company Profile |
SEC
News |
Chart |
Request a new note
C
A
S
I |
PETS
-
NASDAQ
Petmed Express Inc
RETAIL - Drug Stores
|
$44.88
|
+0.82
1.86% |
$45.22
|
355,015
49.31% of 50 DAV
50 DAV is 720,000
|
$57.80
-22.35%
|
1/19/2018
|
$53.59
|
PP = $51.00
|
|
MB = $53.55
|
Most Recent Note - 2/14/2018 7:34:42 PM
G - Still sputtering below its 50 DMA ($46.28) line, and a rebound above the 50 DMA line is needed to help its outlook improve. Recently reported earnings +83% on +14% sales revenues, continuing its strong earnings track record. See the latest FSU analysis for more details and an annotated graph.
>>> FEATURED STOCK ARTICLE : Sputtering Below 50-Day Average After Negative Reversal - 2/14/2018 |
View all notes |
Set NEW NOTE alert |
Company Profile |
SEC
News |
Chart |
Request a new note
C
A
S
I |
Symbol/Exchange
Company Name
Industry Group |
PRICE |
CHANGE
(%Change) |
Day High |
Volume
(% DAV)
(% 50 day avg vol) |
52 Wk Hi
% From Hi |
Featured
Date |
Price
Featured |
Pivot Featured |
|
Max Buy |
ESNT
-
NYSE
Essent Group Ltd
Finance-MrtgandRel Svc
|
$46.87
|
-0.59
-1.24% |
$47.73
|
955,660
137.11% of 50 DAV
50 DAV is 697,000
|
$50.08
-6.41%
|
10/9/2017
|
$39.75
|
PP = $41.54
|
|
MB = $43.62
|
Most Recent Note - 2/14/2018 7:57:44 PM
G - Rebounded above its 50 DMA line ($46.11) with today's 4th consecutive volume-driven gain since slumping near its 200 DMA line ($40.94). More damaging losses would raise greater concerns. Reported earnings +16% on +27% sales revenues for the Dec '17 quarter, below the +25% minimum earnings guideline (C criteria), raising fundamental concerns.
>>> FEATURED STOCK ARTICLE : Slumped Below 50-Day Average With Earnings News Due Friday - 2/6/2018 |
View all notes |
Set NEW NOTE alert |
Company Profile |
SEC
News |
Chart |
Request a new note
C
A
S
I |
FIVE
-
NASDAQ
Five Below Inc
Retail-DiscountandVariety
|
$64.52
|
-0.44
-0.68% |
$65.84
|
868,629
78.47% of 50 DAV
50 DAV is 1,107,000
|
$73.55
-12.28%
|
1/2/2018
|
$69.16
|
PP = $68.99
|
|
MB = $72.44
|
Most Recent Note - 2/14/2018 8:00:50 PM
G - Posted a gain today with light volume. A rebound above the 50 DMA line ($66.38) is needed for its outlook to improve. See the latest FSU analysis for more details and an annotated graph.
>>> FEATURED STOCK ARTICLE : Rebound Above 50-day Moving Average is Needed to Help Outlook - 2/12/2018 |
View all notes |
Set NEW NOTE alert |
Company Profile |
SEC
News |
Chart |
Request a new note
C
A
S
I |
MDXG
-
NASDAQ
MiMedx Group Inc
Medical-Products
|
$15.43
|
-0.53
-3.32% |
$16.62
|
2,119,515
114.38% of 50 DAV
50 DAV is 1,853,000
|
$18.25
-15.45%
|
1/29/2018
|
$17.43
|
PP = $17.57
|
|
MB = $18.45
|
Most Recent Note - 2/14/2018 7:41:43 PM
Y - Posted a gain today with below average volume. The recent low ($14.61 on 2/09/18) defines near-term support. Concerns were raised after it negated the recent breakout and slumped into the prior base. Disciplined investors always limit losses by selling any stock that falls more than -7% from their purchase price.
>>> FEATURED STOCK ARTICLE : Hit a New High With it 6th Consecutive Gain - 1/29/2018 |
View all notes |
Set NEW NOTE alert |
Company Profile |
SEC
News |
Chart |
Request a new note
C
A
S
I |
SPLK
-
NASDAQ
Splunk Inc
Computer Sftwr-Database
|
$96.35
|
+4.00
4.33% |
$97.27
|
2,694,908
180.02% of 50 DAV
50 DAV is 1,497,000
|
$93.68
2.85%
|
2/15/2018
|
$96.06
|
PP = $93.68
|
|
MB = $98.36
|
Most Recent Note - 2/15/2018 2:23:57 PM
Y - Hitting new 52-week and multi-year highs with today's 5th consecutive gain, it recently found support at its 50 DMA line. May be considered a valid "secondary buy point" up to +5% above the prior high after testing support at the 10 WMA after a prior breakout. Reported earnings +70% on +34% sales revenues for the Oct '17 quarter. Three of the past 4 quarterly comparisons showed strong earnings above the +25% minimum guideline (C criteria) and its annual earnings (A criteria) history has been strong since reaching profitability in FY '15. Patient investors may watch for a new base or secondary buy point to possibly develop and be noted in the weeks ahead.
There are no Featured Stock Updates™ available for this stock at this time. You may request one by clicking the Request a New Note link below |
View all notes |
Set NEW NOTE alert |
Company Profile |
SEC
News |
Chart |
Request a new note
C
A
S
I |
ANET
-
NYSE
Arista Networks Inc
TELECOMMUNICATIONS - Communication Equipment
|
$307.96
|
+5.84
1.93% |
$311.67
|
2,533,467
293.91% of 50 DAV
50 DAV is 862,000
|
$305.44
0.83%
|
1/8/2018
|
$248.88
|
PP = $245.75
|
|
MB = $258.04
|
Most Recent Note - 2/15/2018 12:50:28 PM
G - Getting very extended and tallying a 5th consecutive gain today with above average volume for yet another new all-time high. Its 50 DMA line ($253) defines support above prior highs in the $245 area. Due to release its financial results for the quarter and fiscal year ended December 31, 2017 after the market close on Thursday, February 15th.
>>> FEATURED STOCK ARTICLE : Consolidating After Getting Extended From its Prior High - 1/31/2018 |
View all notes |
Set NEW NOTE alert |
Company Profile |
SEC
News |
Chart |
Request a new note
C
A
S
I |
Symbol/Exchange
Company Name
Industry Group |
PRICE |
CHANGE
(%Change) |
Day High |
Volume
(% DAV)
(% 50 day avg vol) |
52 Wk Hi
% From Hi |
Featured
Date |
Price
Featured |
Pivot Featured |
|
Max Buy |
PAYC
-
NYSE
Paycom Software Inc
COMPUTER SOFTWARE and SERVICES - Application Software
|
$95.01
|
+2.93
3.18% |
$95.65
|
909,997
130.75% of 50 DAV
50 DAV is 696,000
|
$93.61
1.50%
|
2/15/2018
|
$95.01
|
PP = $93.61
|
|
MB = $98.29
|
Most Recent Note - 2/15/2018 5:58:32 PM
Y - Color code is changed to yellow while a valid "secondary buy point" exists up to +5% above the latest high. Found prompt support at its 10-week moving average following the prior breakout. Recently reported Dec '17 quarterly earnings +61% on +30% sales revenues after the close, continuing its strong earnings track record.
>>> FEATURED STOCK ARTICLE : Fell Below 50 Day Average With Losses on Above Average Volume - 2/8/2018 |
View all notes |
Set NEW NOTE alert |
Company Profile |
SEC
News |
Chart |
Request a new note
C
A
S
I |
GRUB
-
NYSE
Grubhub Inc
COMPUTER SOFTWARE and SERVICES - Technical and System Software
|
$94.40
|
+1.01
1.08% |
$94.43
|
1,879,858
108.79% of 50 DAV
50 DAV is 1,728,000
|
$94.89
-0.52%
|
6/21/2017
|
$47.33
|
PP = $46.94
|
|
MB = $49.29
|
Most Recent Note - 2/14/2018 7:52:11 PM
G - Rallied for a new high close with today's big volume-driven gain, getting more extended from any sound base. Recently reported earnings +61% on +49% sales revenues for the Dec '17 quarter.
>>> FEATURED STOCK ARTICLE : Slumped Below 50-Day Average With Earnings News Due - 2/7/2018 |
View all notes |
Set NEW NOTE alert |
Company Profile |
SEC
News |
Chart |
Request a new note
C
A
S
I |
PYPL
-
NASDAQ
Paypal Holdings Inc
Finance-CrdtCard/PmtPr
|
$78.30
|
+1.03
1.33% |
$78.30
|
9,101,505
89.35% of 50 DAV
50 DAV is 10,186,000
|
$86.32
-9.30%
|
2/1/2018
|
$80.35
|
PP = $79.49
|
|
MB = $83.46
|
Most Recent Note - 2/14/2018 7:37:53 PM
G - Posted a gain today and closed near its 50 DMA line ($77.31) helping its outlook improve. More damaging losses below the recent low ($71.63 on 2/09/18) would raise concerns and trigger a more worrisome technical sell signal.
>>> FEATURED STOCK ARTICLE : Gap Down Following Earnings News Tests Important Support Level - 2/1/2018 |
View all notes |
Set NEW NOTE alert |
Company Profile |
SEC
News |
Chart |
Request a new note
C
A
S
I |
OLLI
-
NASDAQ
Ollie's Bargain Outlet
Retail-DiscountandVariety
|
$56.90
|
+0.75
1.34% |
$57.15
|
243,146
39.03% of 50 DAV
50 DAV is 623,000
|
$58.50
-2.74%
|
11/21/2017
|
$46.78
|
PP = $47.00
|
|
MB = $49.35
|
Most Recent Note - 2/13/2018 6:19:31 PM
G - Holding its ground quietly, it managed two positive reversals last week after intra-day dips below its 50 DMA line ($53.21) raised concerns. Prior low ($50.15 on 1/04/18) defines the next important near-term support. See the latest FSU analysis for more details and a new annotated graph.
>>> FEATURED STOCK ARTICLE : Consolidating Above 50-Day Moving Average Line - 2/13/2018 |
View all notes |
Set NEW NOTE alert |
Company Profile |
SEC
News |
Chart |
Request a new note
C
A
S
I |
WB
-
NASDAQ
Weibo Corp Cl A Ads
INTERNET - Content
|
$135.12
|
-4.52
-3.24% |
$142.12
|
3,122,015
172.49% of 50 DAV
50 DAV is 1,810,000
|
$140.00
-3.49%
|
1/16/2018
|
$126.33
|
PP = $122.21
|
|
MB = $128.32
|
Most Recent Note - 2/15/2018 2:27:58 PM
G - Hit new all-time highs with 4 consecutive gains backed by above average volume, rallying further above its "max buy" level. Recently reported earnings +88% on +77% sales revenues for the Dec '17 quarter, continuing its strong earnings track record.
>>> FEATURED STOCK ARTICLE : Consolidating Near 50-Day Average With Earnings News Due - 2/9/2018 |
View all notes |
Set NEW NOTE alert |
Company Profile |
SEC
News |
Chart |
Request a new note
C
A
S
I |
Symbol/Exchange
Company Name
Industry Group |
PRICE |
CHANGE
(%Change) |
Day High |
Volume
(% DAV)
(% 50 day avg vol) |
52 Wk Hi
% From Hi |
Featured
Date |
Price
Featured |
Pivot Featured |
|
Max Buy |
HLI
-
NYSE
Houlihan Lokey Inc Cl A
Finance-Invest Bnk/Bkrs
|
$46.28
|
-0.72
-1.53% |
$47.41
|
335,330
151.05% of 50 DAV
50 DAV is 222,000
|
$52.81
-12.37%
|
1/3/2018
|
$45.88
|
PP = $47.09
|
|
MB = $49.44
|
Most Recent Note - 2/14/2018 7:44:41 PM
G - Consolidating near its 50 DMA line ($47.16). The recent low ($43.73 on 2/06/18) defines near term support where a violation would raise greater concerns. Recently reported earnings +21% on +5% sales revenues for the Dec '17 quarter, below the +25% minimum earnings guideline (C criteria), raising fundamental concerns. On 10/26/17 it completed a Secondary Offering.
>>> FEATURED STOCK ARTICLE : Damaging Violation of 50-Day Moving Average Line - 2/5/2018 |
View all notes |
Set NEW NOTE alert |
Company Profile |
SEC
News |
Chart |
Request a new note
C
A
S
I |
|
|
|
THESE ARE NOT BUY RECOMMENDATIONS!
Comments contained in the body of this report are technical
opinions only. The material herein has been obtained
from sources believed to be reliable and accurate, however,
its accuracy and completeness cannot be guaranteed.
This site is not an investment advisor, hence it does
not endorse or recommend any securities or other investments.
Any recommendation contained in this report may not
be suitable for all investors and it is not to be deemed
an offer or solicitation on our part with respect to
the purchase or sale of any securities. All trademarks,
service marks and trade names appearing in this report
are the property of their respective owners, and are
likewise used for identification purposes only.
This report is a service available
only to active Paid Premium Members.
You may opt-out of receiving report notifications
at any time. Questions or comments may be submitted
by writing to Premium Membership Services 665 S.E. 10 Street, Suite 201 Deerfield Beach, FL 33441-5634 or by calling 1-800-965-8307
or 954-785-1121.
|
|
|