You are not logged in.
This means you
CAN ONLY VIEW reports that were published prior to Wednesday, March 26, 2025.
You
MUST UPGRADE YOUR MEMBERSHIP if you want to see any current reports.
AFTER MARKET UPDATE - THURSDAY, FEBRUARY 8TH, 2018
Previous After Market Report Next After Market Report >>>
|
|
|
|
DOW |
-1,032.89 |
23,860.46 |
-4.15% |
|
Volume |
1,229,083,740 |
+8% |
|
Volume |
2,733,305,100 |
+16% |
|
NASDAQ |
-274.82 |
6,777.16 |
-3.90% |
|
Advancers |
326 |
11% |
|
Advancers |
453 |
15% |
|
S&P 500 |
-100.66 |
2,581.00 |
-3.75% |
|
Decliners |
2,689 |
89% |
|
Decliners |
2,525 |
85% |
|
Russell 2000 |
-44.18 |
1,463.79 |
-2.93% |
|
52 Wk Highs |
16 |
|
|
52 Wk Highs |
32 |
|
|
S&P 600 |
-25.49 |
893.05 |
-2.78% |
|
52 Wk Lows |
207 |
|
|
52 Wk Lows |
150 |
|
|
 |
Decliners Trump Advancers as Major Indices Suffer More Damage
Kenneth J. Gruneisen - Passed the CAN SLIM® Master's Exam
The major averages fell hard again amid renewed concerns that rising interest rates will negatively impact equity prices. Volume totals reported were higher than the prior session totals on the NYSE and on the Nasdaq exchange, indicative of distributional pressure. Decliners led advancers by an 8-1 margin on the NYSE and more than a 5-1 margin on the Nasdaq exchange. New 52-week lows totals again solidly outnumbered new 52-week highs totals on both the NYSE and the Nasdaq exchange. There were 9 high-ranked companies from the Leaders List that made new 52-week highs and were listed on the BreakOuts Page, versus the total of 7 on the prior session. The Featured Stocks Page provides the latest analysis on noteworthy high-ranked leaders. Charts used courtesy of www.stockcharts.com
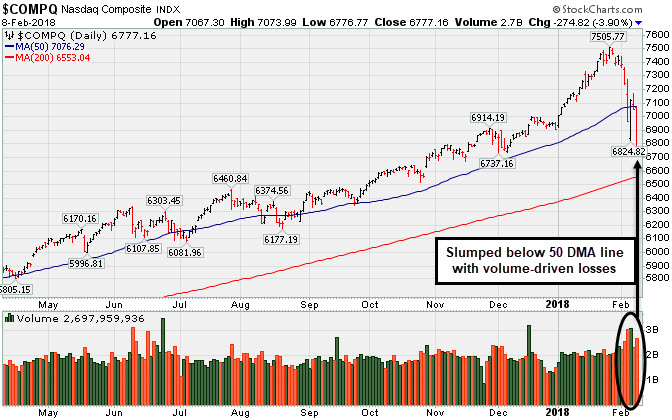 PICTURED: The Nasdaq Composite Index has slumped below its 50-day moving average (DMA) line with big losses on higher volume. Heavier distributional pressure on the major averages (M criteria) took the recently noted "uptrend under pressure" into a worrisome "correction" warranting much greater caution. During market corrections investors should avoid new buying efforts and raise cash by quickly reacting to technical sell signals from stocks on a case-by-case basis.
On the data front, weekly initial jobless claims unexpectedly fell 9,000 to 221,000 versus a projected reading of 232,000. With the decline, the number of first time filings for unemployment benefits is hovering near its lowest point in 45 years. In central bank news, Philadelphia President Patrick Harker said he would like to see inflation tick slightly above the Fed’s 2% target.
Consumer Discretionary stocks paced losses while Real Estate and Utilities were the best performing groups. In earnings news, Tesla (TSLA -8.63%) and Hanesbrands (HBI -10.88%) as both companies posted disappointing quarterly reports. Shares of Kellogg Co (K +2.76%%), Coty (COTY +14.19%), Twitter Inc (TWTR +12.15%), and Grubhub Inc (GRUB +27.36%) rose after their quarterly results topped analyst projections. |
 Kenneth J. Gruneisen started out as a licensed stockbroker in August 1987, a couple of months prior to the historic stock market crash that took the Dow Jones Industrial Average down -22.6% in a single day. He has published daily fact-based fundamental and technical analysis on high-ranked stocks online for two decades. Through FACTBASEDINVESTING.COM, Kenneth provides educational articles, news, market commentary, and other information regarding proven investment systems that work in good times and bad.
Comments contained in the body of this report are technical opinions only and are not necessarily those of Gruneisen Growth Corp. The material herein has been obtained from sources believed to be reliable and accurate, however, its accuracy and completeness cannot be guaranteed. Our firm, employees, and customers may effect transactions, including transactions contrary to any recommendation herein, or have positions in the securities mentioned herein or options with respect thereto. Any recommendation contained in this report may not be suitable for all investors and it is not to be deemed an offer or solicitation on our part with respect to the purchase or sale of any securities. |
|
 |
Financial, Energy, Retail, and Tech Groups All Hit Hard
Kenneth J. Gruneisen - Passed the CAN SLIM® Master's Exam
The Retail Index ($RLX -4.34%) and Bank Index ($BKX -4.42%) both suffered large losses and the Broker/Dealer Index ($XBD -1.77%) also fell on Thursday. The Semiconductor Index ($SOX -4.23%) and Biotechnology Index ($BTK -3.98%) led the tech sector's retreat as the Networking Index ($NWX -1.51%) also ended lower. Energy-linked groups suffered large losses as the Integrated Oil Index ($XOI -3.04%) and the Oil Services Index ($OSX -4.03%) both lost considerable ground, meanwhile the Gold & Silver Index ($XAU -0.85%) fared better than most other groups as it edged lower. Charts courtesy wwwstockcharts.com
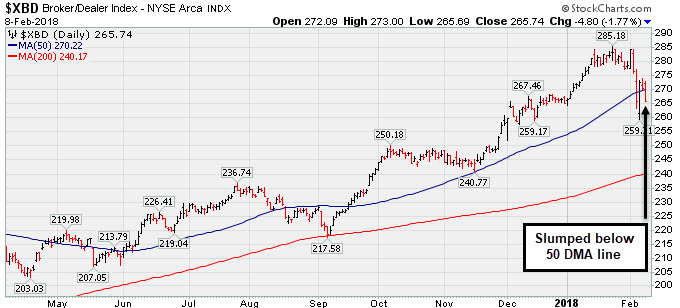 PICTURED: The Broker/Dealer Index ($XBD -1.77%) has slumped below its 50-day moving average (DMA) line again. Charts courtesy wwwstockcharts.com
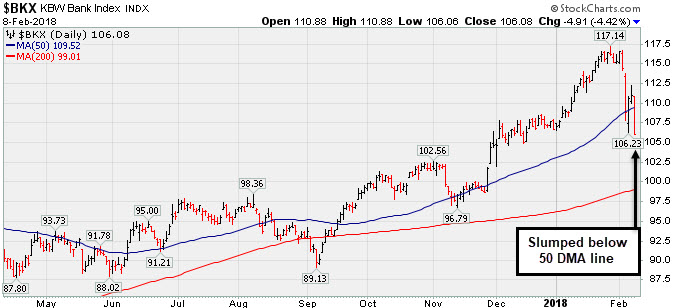 PICTURED 2: The Bank Index ($BKX -4.42%) slumped back below its 50 DMA line and ended near the session low. The decisively weak action gives cause for concern and hurts the market outlook. Long time readers of this report know that financial groups have been very reliable "leading indicators" for the broader market's direction.
| Oil Services |
$OSX |
136.66 |
-5.73 |
-4.02% |
-8.62% |
| Integrated Oil |
$XOI |
1,260.12 |
-39.47 |
-3.04% |
-5.65% |
| Semiconductor |
$SOX |
1,218.66 |
-53.84 |
-4.23% |
-2.74% |
| Networking |
$NWX |
492.32 |
-7.53 |
-1.51% |
+0.37% |
| Broker/Dealer |
$XBD |
265.74 |
-4.80 |
-1.77% |
+0.19% |
| Retail |
$RLX |
1,851.29 |
-84.09 |
-4.34% |
+6.78% |
| Gold & Silver |
$XAU |
79.86 |
-0.68 |
-0.84% |
-6.34% |
| Bank |
$BKX |
106.08 |
-4.91 |
-4.42% |
-0.59% |
| Biotech |
$BTK |
4,399.31 |
-182.24 |
-3.98% |
+4.19% |
|
|
|
 |
Fell Below 50 Day Average With Losses on Above Average Volume
Kenneth J. Gruneisen - Passed the CAN SLIM® Master's Exam
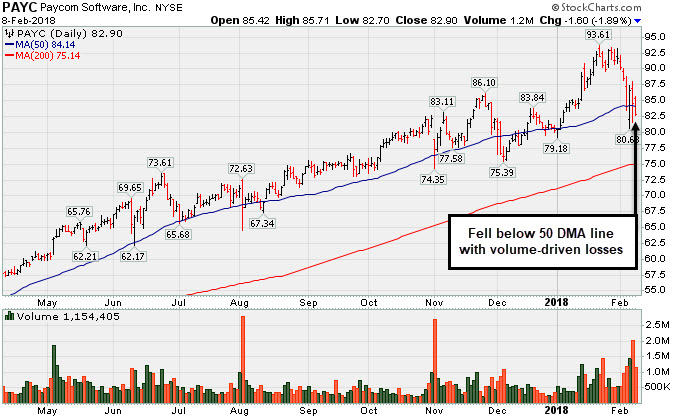
Paycom Software Inc (PAYC -$1.60 or -1.89% to $82.90) slumped to a close below its 50-day moving average (DMA) line ($84.14) with today's 4th volume-driven loss in the span of 5 sessions raising more serious concerns. Disciplined investors avoid chasing stocks more than +5% above proir highs and always limit losses by selling any stock that falls more than -7% from their purchase price.
Recently it reported Dec '17 quarterly earnings +61% on +30% sales revenues, continuing its strong earnings track record. It has earned a 99 Earnings Per Share Rating, the highest possible rank.
It was last shown in this FSU section on 1/12/18 with an annotated graph under the headline, "Finished Strong With Big Gain on +118% Above Average Volume". It finished strong after highlighted in yellow with pivot point cited based on its 11/27/17 high plus 10 cents in the earlier mid-day report (read here). Its gain above the pivot point was backed by +118% above average volume triggering a technical buy signal.
The high-ranked Computer Software - Enterprise firm's current Up/Down Volume ratio of 0.9 is an unbiased indication its shares have been under slight distributional pressure over the past 50 days. The number of top-rated funds owning its shares rose from 286 in Mar '16 to 407 in Dec '17, a reassuring sign concerning the I criteria. It has a Timeliness rating of A and Sponsorship rating of B. It completed Secondary Offerings on on 11/13/15, 9/16/15, 5/15/15 and 1/14/15 since its $15 IPO on 4/15/14. |
|
|
Color Codes Explained :
Y - Better candidates highlighted by our
staff of experts.
G - Previously featured
in past reports as yellow but may no longer be buyable under the
guidelines.
***Last / Change / Volume data in this table is the closing quote data***
Symbol/Exchange
Company Name
Industry Group |
PRICE |
CHANGE
(%Change) |
Day High |
Volume
(% DAV)
(% 50 day avg vol) |
52 Wk Hi
% From Hi |
Featured
Date |
Price
Featured |
Pivot Featured |
|
Max Buy |
ROG
-
NYSE
Rogers Corp
CONSUMER NON-DURABLES - Rubber and Plastics
|
$145.61
|
-8.16
-5.31% |
$154.76
|
172,843
108.03% of 50 DAV
50 DAV is 160,000
|
$184.00
-20.86%
|
12/29/2017
|
$162.92
|
PP = $168.17
|
|
MB = $176.58
|
 Most Recent Note - 2/8/2018 4:13:37 PM
Slumped further below its 50 DMA line ($162.73) and below the prior low ($151.02 on 12/06/17) with today's big loss on lighter volume. It will be dropped from the Featured Stocks list tonight. Only a prompt rebound above the 50 DMA line would help its outlook improve.
>>> FEATURED STOCK ARTICLE : Stalled After Recent Technical Breakout - 1/30/2018 |
View all notes |
Set NEW NOTE alert |
Company Profile |
SEC
News |
Chart |
Request a new note
C
A
S
I |
TPL
-
NYSE
Texas Pacific Land Trust
FINANCIAL SERVICES - Diversified Investments
|
$498.17
|
-24.02
-4.60% |
$525.00
|
14,701
86.48% of 50 DAV
50 DAV is 17,000
|
$569.99
-12.60%
|
12/21/2017
|
$419.50
|
PP = $435.09
|
|
MB = $456.84
|
Most Recent Note - 2/8/2018 4:19:00 PM
G - Consolidating after getting very extended from the previously noted base. Its 50 DMA line ($468) defines initial support to watch above prior highs in the $435 area. Reported earnings +29% on +118% sales revenues for the Dec '17 quarter.
>>> FEATURED STOCK ARTICLE : Considerable Gains in First 2-3 Weeks After Recent Breakout - 1/23/2018 |
View all notes |
Set NEW NOTE alert |
Company Profile |
SEC
News |
Chart |
Request a new note
C
A
S
I |
YY
-
NASDAQ
YY Inc
INTERNET - Internet Service Providers
|
$111.23
|
-8.76
-7.30% |
$121.66
|
1,635,363
138.59% of 50 DAV
50 DAV is 1,180,000
|
$142.97
-22.20%
|
12/29/2017
|
$113.06
|
PP = $123.58
|
|
MB = $129.76
|
Most Recent Note - 2/8/2018 4:08:08 PM
G - Higher volume behind today's 5th consecutive loss had it slumping further below its prior highs in the $123 area and well below its 50 DMA line ($120.34) triggering a worrisome technical sell signal. Only a prompt rebound above the 50 DMA line would help its outlook improve.
>>> FEATURED STOCK ARTICLE : Retreating After +78% Rally in 5 Months - 2/2/2018 |
View all notes |
Set NEW NOTE alert |
Company Profile |
SEC
News |
Chart |
Request a new note
C
A
S
I |
HTHT
-
NASDAQ
China Lodging Group Ads
LEISURE - Lodging
|
$132.01
|
-5.50
-4.00% |
$141.10
|
495,158
69.25% of 50 DAV
50 DAV is 715,000
|
$166.19
-20.57%
|
12/22/2017
|
$138.07
|
PP = $142.90
|
|
MB = $150.05
|
Most Recent Note - 2/6/2018 5:16:45 PM
G - Recently undercut prior highs in the $142 area and it has been sputtering near its 50 DMA line ($137.72). More damaging losses would raise greater concerns.
>>> FEATURED STOCK ARTICLE : Found Support Above Prior High After Latest Breakout - 1/24/2018 |
View all notes |
Set NEW NOTE alert |
Company Profile |
SEC
News |
Chart |
Request a new note
C
A
S
I |
PETS
-
NASDAQ
Petmed Express Inc
RETAIL - Drug Stores
|
$42.49
|
-1.63
-3.69% |
$44.87
|
391,725
54.26% of 50 DAV
50 DAV is 722,000
|
$57.80
-26.49%
|
1/19/2018
|
$53.59
|
PP = $51.00
|
|
MB = $53.55
|
Most Recent Note - 2/8/2018 4:21:52 PM
G - Slumped further below its 50 DMA line ($45.95) with today's loss on light volume. Only a prompt rebound above the 50 DMA line would help its outlook improve. Recently reported earnings +83% on +14% sales revenues, continuing its strong earnings track record.
>>> FEATURED STOCK ARTICLE : Strong Finish Ahead of Earnings News Next Week - 1/19/2018 |
View all notes |
Set NEW NOTE alert |
Company Profile |
SEC
News |
Chart |
Request a new note
C
A
S
I |
Symbol/Exchange
Company Name
Industry Group |
PRICE |
CHANGE
(%Change) |
Day High |
Volume
(% DAV)
(% 50 day avg vol) |
52 Wk Hi
% From Hi |
Featured
Date |
Price
Featured |
Pivot Featured |
|
Max Buy |
ESNT
-
NYSE
Essent Group Ltd
Finance-MrtgandRel Svc
|
$43.39
|
-1.63
-3.62% |
$45.34
|
902,394
135.19% of 50 DAV
50 DAV is 667,500
|
$50.08
-13.36%
|
10/9/2017
|
$39.75
|
PP = $41.54
|
|
MB = $43.62
|
Most Recent Note - 2/8/2018 4:16:26 PM
G - Ended near the session low today, testing near the recent lows in the $43.00 area which define important support. A rebound above the 50 DMA line ($46.05) is needed fro its outlook to improve. Due to report earnings news before the open on Friday, February 9, 2018. See the latest FSU analysis for more details and an annotated graph.
>>> FEATURED STOCK ARTICLE : Slumped Below 50-Day Average With Earnings News Due Friday - 2/6/2018 |
View all notes |
Set NEW NOTE alert |
Company Profile |
SEC
News |
Chart |
Request a new note
C
A
S
I |
FIVE
-
NASDAQ
Five Below Inc
Retail-DiscountandVariety
|
$62.52
|
-1.73
-2.69% |
$65.07
|
1,084,402
87.73% of 50 DAV
50 DAV is 1,236,000
|
$73.55
-15.00%
|
1/2/2018
|
$69.16
|
PP = $68.99
|
|
MB = $72.44
|
Most Recent Note - 2/6/2018 5:10:26 PM
G - Posted a gain today with near average volume and closed near the session high. Only a prompt rebound above the 50 DMA line ($65.95) would help its outlook improve.
>>> FEATURED STOCK ARTICLE : Consolidating After Negating Breakout From Advanced Base - 1/17/2018 |
View all notes |
Set NEW NOTE alert |
Company Profile |
SEC
News |
Chart |
Request a new note
C
A
S
I |
MDXG
-
NASDAQ
MiMedx Group Inc
Medical-Products
|
$15.37
|
-1.04
-6.34% |
$16.57
|
2,034,671
109.51% of 50 DAV
50 DAV is 1,858,000
|
$18.25
-15.78%
|
1/29/2018
|
$17.43
|
PP = $17.57
|
|
MB = $18.45
|
Most Recent Note - 2/8/2018 4:17:44 PM
Y - Ended at the session low with a big loss today with below average volume. Disciplined investors always limit losses by selling any stock that falls more than -7% from their purchase price.
>>> FEATURED STOCK ARTICLE : Hit a New High With it 6th Consecutive Gain - 1/29/2018 |
View all notes |
Set NEW NOTE alert |
Company Profile |
SEC
News |
Chart |
Request a new note
C
A
S
I |
ANET
-
NYSE
Arista Networks Inc
TELECOMMUNICATIONS - Communication Equipment
|
$264.52
|
-17.10
-6.07% |
$285.14
|
1,149,563
139.17% of 50 DAV
50 DAV is 826,000
|
$289.07
-8.49%
|
1/8/2018
|
$248.88
|
PP = $245.75
|
|
MB = $258.04
|
Most Recent Note - 2/8/2018 4:10:24 PM
G - Pulled back with above average volume today after hitting a new all-time high on the prior session. its 50 DMA line ($247.53) and prior highs in the $245 area define important support to watch.
>>> FEATURED STOCK ARTICLE : Consolidating After Getting Extended From its Prior High - 1/31/2018 |
View all notes |
Set NEW NOTE alert |
Company Profile |
SEC
News |
Chart |
Request a new note
C
A
S
I |
PAYC
-
NYSE
Paycom Software Inc
COMPUTER SOFTWARE and SERVICES - Application Software
|
$82.90
|
-1.60
-1.89% |
$85.71
|
1,154,345
180.09% of 50 DAV
50 DAV is 641,000
|
$93.61
-11.44%
|
1/12/2018
|
$87.93
|
PP = $86.20
|
|
MB = $90.51
|
Most Recent Note - 2/8/2018 6:09:30 PM
G - Slumped below its 50 DMA line ($84.14) with damaging volume-driven losses raising serious concerns and triggering technical sell signals. Only a prompt rebound above the 50 DMA line would help its outlook improve. Reported Dec '17 quarterly earnings +61% on +30% sales revenues after the close, continuing its strong earnings track record. See the latest FSU analysis for more details and a new annotated graph.
>>> FEATURED STOCK ARTICLE : Fell Below 50 Day Average With Losses on Above Average Volume - 2/8/2018 |
View all notes |
Set NEW NOTE alert |
Company Profile |
SEC
News |
Chart |
Request a new note
C
A
S
I |
Symbol/Exchange
Company Name
Industry Group |
PRICE |
CHANGE
(%Change) |
Day High |
Volume
(% DAV)
(% 50 day avg vol) |
52 Wk Hi
% From Hi |
Featured
Date |
Price
Featured |
Pivot Featured |
|
Max Buy |
GRUB
-
NYSE
Grubhub Inc
COMPUTER SOFTWARE and SERVICES - Technical and System Software
|
$89.04
|
+19.13
27.36% |
$94.89
|
13,579,441
991.92% of 50 DAV
50 DAV is 1,369,000
|
$77.99
14.18%
|
6/21/2017
|
$47.33
|
PP = $46.94
|
|
MB = $49.29
|
Most Recent Note - 2/8/2018 1:01:22 PM
G - Reported earnings +61% on +49% sales revenues for the Dec '17 quarter and gapped up today repairing recent technical damage with a considerable volume-driven gain hitting a new all-time high. Volume and volatility often increase near earnings news. See the latest FSU analysis for more details and an annotated graph.
>>> FEATURED STOCK ARTICLE : Slumped Below 50-Day Average With Earnings News Due - 2/7/2018 |
View all notes |
Set NEW NOTE alert |
Company Profile |
SEC
News |
Chart |
Request a new note
C
A
S
I |
PYPL
-
NASDAQ
Paypal Holdings Inc
Finance-CrdtCard/PmtPr
|
$72.32
|
-3.27
-4.33% |
$75.91
|
13,643,882
130.13% of 50 DAV
50 DAV is 10,485,000
|
$86.32
-16.22%
|
2/1/2018
|
$80.35
|
PP = $79.49
|
|
MB = $83.46
|
Most Recent Note - 2/6/2018 5:28:00 PM
G - Posted a small gain today, but remains below its 50 DMA line after 3 consecutive losses marked by above average volume. Only a prompt rebound above the 50 DMA line ($77.47) would help its outlook improve.
>>> FEATURED STOCK ARTICLE : Gap Down Following Earnings News Tests Important Support Level - 2/1/2018 |
View all notes |
Set NEW NOTE alert |
Company Profile |
SEC
News |
Chart |
Request a new note
C
A
S
I |
OLLI
-
NASDAQ
Ollie's Bargain Outlet
Retail-DiscountandVariety
|
$53.65
|
-2.15
-3.85% |
$55.99
|
471,844
75.37% of 50 DAV
50 DAV is 626,000
|
$58.50
-8.29%
|
11/21/2017
|
$46.78
|
PP = $47.00
|
|
MB = $49.35
|
Most Recent Note - 2/6/2018 5:22:24 PM
G - Slumped below its 50 DMA line ($52.43) today then managed a "positive reversal" for a gain with above average volume. Prior low ($50.15 on 1/04/18) defines the next important near-term support.
>>> FEATURED STOCK ARTICLE : Bargain Outlet Looked Expensive Before +114% Rally in 18 Months - 1/18/2018 |
View all notes |
Set NEW NOTE alert |
Company Profile |
SEC
News |
Chart |
Request a new note
C
A
S
I |
WB
-
NASDAQ
Weibo Corp Cl A Ads
INTERNET - Content
|
$111.76
|
-5.77
-4.91% |
$122.80
|
2,027,052
118.61% of 50 DAV
50 DAV is 1,709,000
|
$136.19
-17.94%
|
1/16/2018
|
$126.33
|
PP = $122.21
|
|
MB = $128.32
|
Most Recent Note - 2/8/2018 4:20:25 PM
G - Slumped further below prior highs in the $123 area and violated its 50 DMA line ($115.09) with today's big loss on average volume triggering a technical sell signal.
>>> FEATURED STOCK ARTICLE : Close in Session's Lower Third a Sign of Distributional Pressure - 1/16/2018 |
View all notes |
Set NEW NOTE alert |
Company Profile |
SEC
News |
Chart |
Request a new note
C
A
S
I |
HLI
-
NYSE
Houlihan Lokey Inc Cl A
Finance-Invest Bnk/Bkrs
|
$46.06
|
-0.99
-2.10% |
$47.14
|
278,522
133.90% of 50 DAV
50 DAV is 208,000
|
$52.81
-12.78%
|
1/3/2018
|
$45.88
|
PP = $47.09
|
|
MB = $49.44
|
Most Recent Note - 2/7/2018 5:28:05 PM
G - Today's gain and close back above the 50 DMA line ($46.93) helped its outlook improve. Recently reported earnings +21% on +5% sales revenues for the Dec '17 quarter, below the +25% minimum earnings guideline (C criteria), raising fundamental concerns. On 10/26/17 it completed a Secondary Offering.
>>> FEATURED STOCK ARTICLE : Damaging Violation of 50-Day Moving Average Line - 2/5/2018 |
View all notes |
Set NEW NOTE alert |
Company Profile |
SEC
News |
Chart |
Request a new note
C
A
S
I |
Symbol/Exchange
Company Name
Industry Group |
PRICE |
CHANGE
(%Change) |
Day High |
Volume
(% DAV)
(% 50 day avg vol) |
52 Wk Hi
% From Hi |
Featured
Date |
Price
Featured |
Pivot Featured |
|
Max Buy |
ICHR
-
NASDAQ
Ichor Holdings Ltd
ELECTRONICS - Semiconductor Equipment
|
$22.01
|
-4.36
-16.53% |
$27.90
|
5,438,018
419.28% of 50 DAV
50 DAV is 1,297,000
|
$35.51
-38.02%
|
1/22/2018
|
$34.00
|
PP = $35.61
|
|
MB = $37.39
|
Most Recent Note - 2/8/2018 4:04:58 PM
Violated its 200 DMA line and prior low with today's big loss on very heavy volume. It will be dropped from the Featured Stocks list tonight. A rebound above the 50 DMA line is needed for its outlook to improve.
>>> FEATURED STOCK ARTICLE : Found Support at 200 Day Average and Rebounded Near Prior High - 1/22/2018 |
View all notes |
Set NEW NOTE alert |
Company Profile |
SEC
News |
Chart |
Request a new note
C
A
S
I |
|
|
|
THESE ARE NOT BUY RECOMMENDATIONS!
Comments contained in the body of this report are technical
opinions only. The material herein has been obtained
from sources believed to be reliable and accurate, however,
its accuracy and completeness cannot be guaranteed.
This site is not an investment advisor, hence it does
not endorse or recommend any securities or other investments.
Any recommendation contained in this report may not
be suitable for all investors and it is not to be deemed
an offer or solicitation on our part with respect to
the purchase or sale of any securities. All trademarks,
service marks and trade names appearing in this report
are the property of their respective owners, and are
likewise used for identification purposes only.
This report is a service available
only to active Paid Premium Members.
You may opt-out of receiving report notifications
at any time. Questions or comments may be submitted
by writing to Premium Membership Services 665 S.E. 10 Street, Suite 201 Deerfield Beach, FL 33441-5634 or by calling 1-800-965-8307
or 954-785-1121.
|
|
|