You are not logged in.
This means you
CAN ONLY VIEW reports that were published prior to Thursday, March 20, 2025.
You
MUST UPGRADE YOUR MEMBERSHIP if you want to see any current reports.
AFTER MARKET UPDATE - FRIDAY, MARCH 2ND, 2018
Previous After Market Report Next After Market Report >>>
|
|
|
|
DOW |
-70.92 |
24,538.06 |
-0.29% |
|
Volume |
919,892,010 |
-11% |
|
Volume |
2,292,836,060 |
-7% |
|
NASDAQ |
+77.31 |
7,257.87 |
+1.08% |
|
Advancers |
1,854 |
63% |
|
Advancers |
2,198 |
75% |
|
S&P 500 |
+13.58 |
2,691.25 |
+0.51% |
|
Decliners |
1,086 |
37% |
|
Decliners |
735 |
25% |
|
Russell 2000 |
+25.78 |
1,533.17 |
+1.71% |
|
52 Wk Highs |
27 |
|
|
52 Wk Highs |
64 |
|
|
S&P 600 |
+15.54 |
932.68 |
+1.69% |
|
52 Wk Lows |
164 |
|
|
52 Wk Lows |
72 |
|
|
 |
Leadership Improved as Indices Rose With Less Volume Conviction
Kenneth J. Gruneisen - Passed the CAN SLIM® Master's Exam
For the week, the Dow fell 3.0%, the S&P 500 lost 2.0% and the Nasdaq Composite declined 1.1%. Stocks finished mixed Friday. The Dow fell 70 points to 24538. The S&P 500 added 13 points to 2691 while the Nasdaq Composite gained 77 points to 7257. The volume totals reported were lighter than the prior session totals on the NYSE and on the Nasdaq exchange. Advancers led decliners by more than a 3-2 margin on the NYSE and 3-1 on the Nasdaq exchange. New 52-week highs were again outnumbered by new 52-week lows totals on both the Nasdaq exchange and the NYSE. There were 19 high-ranked companies from the Leaders List that made new 52-week highs and were listed on the BreakOuts Page, versus the total of 5 on the prior session. Charts used courtesy of www.stockcharts.com
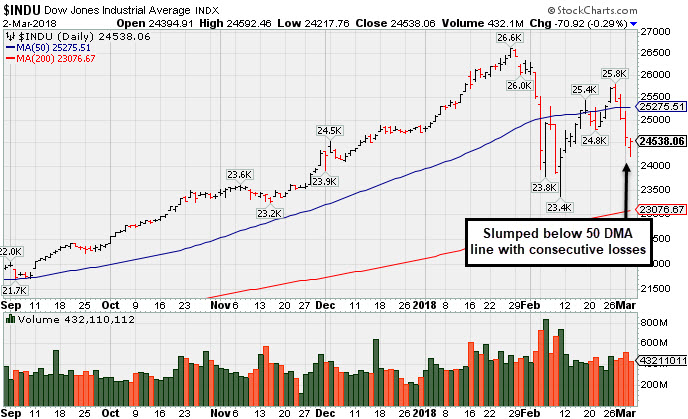 PICTURED: The Dow Jones Industrial Average has slumped back below its 50-day moving average (DMA) line with 4 consecutive losses. The major indices (M criteria) have seen the latest uptrend come under pressure as several distribution days were noted. New buying efforts may be justified under the fact-based investment system, however, only when all key criteria of the fact-based investment system are satisfied. The Featured Stocks Pageprovides the latest analysis on noteworthy high-ranked leaders.
The major averages fluctuated between gains and losses in a choppy trading session, ultimately finishing the week in negative territory amid rising geopolitical tensions. Investors are concerned about a potential trade war after global leaders condemned President Trump’s proposed tariffs on steel and aluminum. On the data front, the University of Michigan’s final update on consumer sentiment came in at the second-highest level since 2004.
Seven of 11 sectors in the S&P 500 finished higher. Health Care shares paced gains as Regeneron Pharmaceuticals (REGN +2.70%) on reports of positive clinical trials for a new asthma treatment. Technology also outperformed while Real Estate shares lagged. In other news, Gap (GPS +7.82%) after posting quarterly results above consensus and raising forward guidance. McDonald’s (MCD -4.77%) fell after an analyst reduced their estimates and price target on the shares. In M&A news, chipmaker Microsemi Corp. (MSCC +4.67%) after agreeing to be bought by Microchip Technologies (MCHP +2.55%) for $8.3 billion.
Treasuries weakened with the yield on the 10-year note advancing six basis points to 2.86%. In commodities, NYMEX WTI crude rose 0.8% to $61.46/barrel. COMEX gold gained 1.4% to $1323.10/ounce amid a weaker dollar. |
 Kenneth J. Gruneisen started out as a licensed stockbroker in August 1987, a couple of months prior to the historic stock market crash that took the Dow Jones Industrial Average down -22.6% in a single day. He has published daily fact-based fundamental and technical analysis on high-ranked stocks online for two decades. Through FACTBASEDINVESTING.COM, Kenneth provides educational articles, news, market commentary, and other information regarding proven investment systems that work in good times and bad.
Comments contained in the body of this report are technical opinions only and are not necessarily those of Gruneisen Growth Corp. The material herein has been obtained from sources believed to be reliable and accurate, however, its accuracy and completeness cannot be guaranteed. Our firm, employees, and customers may effect transactions, including transactions contrary to any recommendation herein, or have positions in the securities mentioned herein or options with respect thereto. Any recommendation contained in this report may not be suitable for all investors and it is not to be deemed an offer or solicitation on our part with respect to the purchase or sale of any securities. |
|
 |
Retail, Financial, and Tech Groups Rose
Kenneth J. Gruneisen - Passed the CAN SLIM® Master's Exam
On Friday the Retail Index ($RLX +0.34), Bank Index ($BKX +0.63%) and the Broker/Dealer Index ($XBD +0.78%) finished higher. The tech sector had a positive bias as the Biotechnology Index ($BTK +3.22%), Networking Index ($NWX +2.07%), and the Semiconductor Index ($SOX +1.76%) posted unanimous gains. The Oil Services Index ($OSX +1.07%) and the Integrated Oil Index ($XOI +0.35%) both finished higher while the Gold & Silver Index ($XAU -0.23%) was a standout decliner. Charts courtesy wwwstockcharts.com
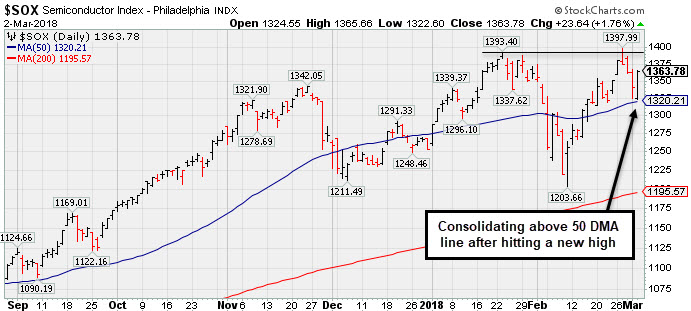 PICTURED: The Semiconductor Index ($SOX +1.76%) found support at its 50-day moving average (DMA) line after recently touching a new high.
| Oil Services |
$OSX |
133.59 |
-0.26 |
-0.19% |
-10.67% |
| Integrated Oil |
$XOI |
1,274.80 |
-0.74 |
-0.06% |
-4.55% |
| Semiconductor |
$SOX |
1,349.70 |
+9.56 |
+0.71% |
+7.71% |
| Networking |
$NWX |
524.66 |
+8.89 |
+1.72% |
+6.96% |
| Broker/Dealer |
$XBD |
282.03 |
+1.86 |
+0.66% |
+6.33% |
| Retail |
$RLX |
1,968.73 |
+6.69 |
+0.34% |
+13.55% |
| Gold & Silver |
$XAU |
79.25 |
+0.32 |
+0.41% |
-7.06% |
| Bank |
$BKX |
111.09 |
-0.10 |
-0.09% |
+4.10% |
| Biotech |
$BTK |
4,626.09 |
+114.61 |
+2.54% |
+9.57% |
|
|
|
 |
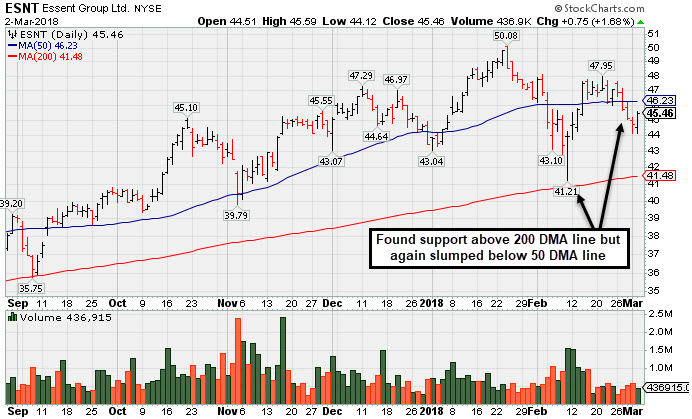
Sputtering ESNBelow 50-Day Moving Average Line
Kenneth J. Gruneisen - Passed the CAN SLIM® Master's Exam
Essent Group Ltd (ESNT +$0.75 or +1.68% to $45.46) is sputtering below its 50-day moving average (DMA) line ($46.24). It tested support near its 200 DMA line recently. More damaging losses would raise greater concerns. Recently reported earnings +16% on +27% sales revenues for the Dec '17 quarter, below the +25% minimum earnings guideline (C criteria), raising fundamental concerns.
Fundamentals remain strong. It currently has a Timeliness rating of A and a Sponsorship rating of C. The high-ranked Finance-Mrtg and Rel Svc firm's quarterly earnings have been above the +25% minimum guideline (C criteria) and sales revenues increases in comparisons through Sep '17 have been strong. Its annual earnings (A criteria) history has been good since its $17 IPO on 10/31/13.
Essent has traded up as much as +46.9% since first highlighted in yellow with pivot point cited based on its 12/12/16 high plus 10 cents in the 1/25/17 mid-day report (read here). The number of top-rated funds owning its shares rose from 317 in Mar '16 to 553 in Dec '17, a reassuring sign concerning the I criteria. Its current Up/Down Volume ratio of 1.4 is an unbiased indication its shares have been under accumulation over the past 50 days. |
|
|
Color Codes Explained :
Y - Better candidates highlighted by our
staff of experts.
G - Previously featured
in past reports as yellow but may no longer be buyable under the
guidelines.
***Last / Change / Volume data in this table is the closing quote data***
Symbol/Exchange
Company Name
Industry Group |
PRICE |
CHANGE
(%Change) |
Day High |
Volume
(% DAV)
(% 50 day avg vol) |
52 Wk Hi
% From Hi |
Featured
Date |
Price
Featured |
Pivot Featured |
|
Max Buy |
TPL
-
NYSE
Texas Pacific Land Trust
FINANCIAL SERVICES - Diversified Investments
|
$520.06
|
+3.06
0.59% |
$528.06
|
6,129
32.26% of 50 DAV
50 DAV is 19,000
|
$569.99
-8.76%
|
2/20/2018
|
$517.00
|
PP = $569.99
|
|
MB = $598.49
|
Most Recent Note - 2/27/2018 1:59:32 PM
Y - Still consolidating in an orderly fashion above its 50 DMA line ($493.23). A valid secondary buy point exists up to +5% above the latest high after it successfully tested the 10 week moving average (WMA) line following an earlier technical breakout. Reported earnings +29% on +118% sales revenues for the Dec '17 quarter.
>>> FEATURED STOCK ARTICLE : Finding Support Above 50-Day Moving Average Line - 2/22/2018 |
View all notes |
Set NEW NOTE alert |
Company Profile |
SEC
News |
Chart |
Request a new note
C
A
S
I |
YY
-
NASDAQ
YY Inc
INTERNET - Internet Service Providers
|
$133.78
|
+6.31
4.95% |
$134.40
|
1,286,244
113.93% of 50 DAV
50 DAV is 1,129,000
|
$142.97
-6.43%
|
12/29/2017
|
$113.06
|
PP = $123.58
|
|
MB = $129.76
|
Most Recent Note - 2/27/2018 6:04:05 PM
G - Consolidating above its 50 DMA line ($125.72). It has not formed a sound new base. Due to report earnings news on Monday. See the latest FSU analysis for more details and a new annotated graph.
>>> FEATURED STOCK ARTICLE : Earnings News Due Next Week for Chinese Social Platform - 2/27/2018 |
View all notes |
Set NEW NOTE alert |
Company Profile |
SEC
News |
Chart |
Request a new note
C
A
S
I |
LOGM
-
NASDAQ
Logmein Inc
INTERNET - Internet Software andamp; Services
|
$119.45
|
+2.40
2.05% |
$119.80
|
505,397
81.97% of 50 DAV
50 DAV is 616,600
|
$134.80
-11.39%
|
2/15/2018
|
$132.35
|
PP = $129.61
|
|
MB = $136.09
|
Most Recent Note - 3/1/2018 5:27:31 PM
G - A rebound above the 50 DMA line ($120.28) is still needed to help its outlook improve. Its Relative Strength rating is 63, well below the 80+ minimum guideline for buy candidates. Found support recently at its 200 DMA line.
>>> FEATURED STOCK ARTICLE : Technical Breakout Came Ahead of Earnings News - 2/15/2018 |
View all notes |
Set NEW NOTE alert |
Company Profile |
SEC
News |
Chart |
Request a new note
C
A
S
I |
HTHT
-
NASDAQ
China Lodging Group Ads
LEISURE - Lodging
|
$152.06
|
+3.57
2.40% |
$153.27
|
408,135
73.01% of 50 DAV
50 DAV is 559,000
|
$166.19
-8.50%
|
12/22/2017
|
$138.07
|
PP = $142.90
|
|
MB = $150.05
|
 Most Recent Note - 3/2/2018 10:15:37 AM
G - It has not formed a sound base and it gapped down today undercutting its 50 DMA line ($148), raising concerns. A rebound above that short-term average is needed for its outlook to improve.
>>> FEATURED STOCK ARTICLE : Repaired Recent Technical Damage But Has Not Formed a New Base - 2/23/2018 |
View all notes |
Set NEW NOTE alert |
Company Profile |
SEC
News |
Chart |
Request a new note
C
A
S
I |
PETS
-
NASDAQ
Petmed Express Inc
RETAIL - Drug Stores
|
$44.68
|
-0.12
-0.27% |
$44.99
|
429,916
60.04% of 50 DAV
50 DAV is 716,000
|
$57.80
-22.70%
|
1/19/2018
|
$53.59
|
PP = $51.00
|
|
MB = $53.55
|
Most Recent Note - 3/1/2018 5:31:41 PM
G - Slumped further below its 50 DMA line ($46.83) today. Faces resistance due to overhead supply up to the $57 level. Recently reported earnings +83% on +14% sales revenues, continuing its strong earnings track record.
>>> FEATURED STOCK ARTICLE : Sputtering Below 50-Day Average After Negative Reversal - 2/14/2018 |
View all notes |
Set NEW NOTE alert |
Company Profile |
SEC
News |
Chart |
Request a new note
C
A
S
I |
Symbol/Exchange
Company Name
Industry Group |
PRICE |
CHANGE
(%Change) |
Day High |
Volume
(% DAV)
(% 50 day avg vol) |
52 Wk Hi
% From Hi |
Featured
Date |
Price
Featured |
Pivot Featured |
|
Max Buy |
DPZ
-
NYSE
Dominos Pizza Inc
WHOLESALE - Food Wholesale
|
$222.49
|
-0.33
-0.15% |
$224.16
|
873,192
77.76% of 50 DAV
50 DAV is 1,123,000
|
$236.00
-5.72%
|
2/20/2018
|
$224.86
|
PP = $222.01
|
|
MB = $233.11
|
Most Recent Note - 2/27/2018 1:46:28 PM
Y - Hovering near its all-time high after rallying above the pivot point cited with big volume-driven gains. Highlighted in the 2/20/18 mid-day report with pivot point cited based on its 1/25/18 high plus 10 cents.
>>> FEATURED STOCK ARTICLE : Popular Pizza Firm Met Resistance Near Prior High - 2/20/2018 |
View all notes |
Set NEW NOTE alert |
Company Profile |
SEC
News |
Chart |
Request a new note
C
A
S
I |
ESNT
-
NYSE
Essent Group Ltd
Finance-MrtgandRel Svc
|
$45.46
|
+0.75
1.68% |
$45.59
|
436,915
68.49% of 50 DAV
50 DAV is 637,900
|
$50.08
-9.23%
|
10/9/2017
|
$39.75
|
PP = $41.54
|
|
MB = $43.62
|
Most Recent Note - 2/27/2018 1:48:26 PM
G - Quietly consolidating near its 50 DMA line ($46.24). Tested support near its 200 DMA line recently. More damaging losses would raise greater concerns. Reported earnings +16% on +27% sales revenues for the Dec '17 quarter, below the +25% minimum earnings guideline (C criteria), raising fundamental concerns.
>>> FEATURED STOCK ARTICLE : Sputtering ESNBelow 50-Day Moving Average Line - 3/2/2018 |
View all notes |
Set NEW NOTE alert |
Company Profile |
SEC
News |
Chart |
Request a new note
C
A
S
I |
FIVE
-
NASDAQ
Five Below Inc
Retail-DiscountandVariety
|
$68.66
|
+1.52
2.26% |
$69.05
|
818,992
80.06% of 50 DAV
50 DAV is 1,023,000
|
$73.55
-6.65%
|
1/2/2018
|
$69.16
|
PP = $68.99
|
|
MB = $72.44
|
Most Recent Note - 2/27/2018 1:49:24 PM
G - Still sputtering near its 50 DMA line ($66.48). The recent low ($60.00 on 2/06/18) defines important near-term support to watch on pullbacks.
>>> FEATURED STOCK ARTICLE : Rebound Above 50-day Moving Average is Needed to Help Outlook - 2/12/2018 |
View all notes |
Set NEW NOTE alert |
Company Profile |
SEC
News |
Chart |
Request a new note
C
A
S
I |
SPLK
-
NASDAQ
Splunk Inc
Computer Sftwr-Database
|
$102.32
|
+8.68
9.27% |
$102.61
|
6,731,790
467.49% of 50 DAV
50 DAV is 1,440,000
|
$97.27
5.19%
|
2/15/2018
|
$96.06
|
PP = $93.68
|
|
MB = $98.36
|
Most Recent Note - 3/2/2018 12:57:13 PM
G - Gapped up today hitting a new all-time high with a big volume-driven gain. Color code was changed to green after rising above the "max buy" level. Bullish action came after it reported earnings +76% on +37% sales revenues for the quarter ended January 31, 2018 versus the year ago period.
>>> FEATURED STOCK ARTICLE : Pulled Back to 10-Week Moving Average After Technical Breakout - 2/16/2018 |
View all notes |
Set NEW NOTE alert |
Company Profile |
SEC
News |
Chart |
Request a new note
C
A
S
I |
PAYC
-
NYSE
Paycom Software Inc
COMPUTER SOFTWARE and SERVICES - Application Software
|
$101.79
|
+3.03
3.07% |
$102.71
|
717,035
101.42% of 50 DAV
50 DAV is 707,000
|
$101.43
0.35%
|
2/15/2018
|
$95.01
|
PP = $93.61
|
|
MB = $98.29
|
Most Recent Note - 3/1/2018 5:30:42 PM
G - Stubbornly holding its ground near its all-time high extended from any sound base. Prior highs in the $93 area define initial support above its 50 DMA line ($88.31). Fundamentals remain strong.
>>> FEATURED STOCK ARTICLE : Fell Below 50 Day Average With Losses on Above Average Volume - 2/8/2018 |
View all notes |
Set NEW NOTE alert |
Company Profile |
SEC
News |
Chart |
Request a new note
C
A
S
I |
Symbol/Exchange
Company Name
Industry Group |
PRICE |
CHANGE
(%Change) |
Day High |
Volume
(% DAV)
(% 50 day avg vol) |
52 Wk Hi
% From Hi |
Featured
Date |
Price
Featured |
Pivot Featured |
|
Max Buy |
GRUB
-
NYSE
Grubhub Inc
COMPUTER SOFTWARE and SERVICES - Technical and System Software
|
$98.84
|
+1.29
1.32% |
$99.89
|
1,535,303
86.25% of 50 DAV
50 DAV is 1,780,000
|
$101.03
-2.17%
|
6/21/2017
|
$47.33
|
PP = $46.94
|
|
MB = $49.29
|
Most Recent Note - 3/1/2018 5:21:44 PM
G - Perched near its all-time high, very extended from any sound base. Recently reported earnings +61% on +49% sales revenues for the Dec '17 quarter. See the latest FSU analysis for more details and a new annotated graph.
>>> FEATURED STOCK ARTICLE : Bullish Action Followed Last Earnings Report - 3/1/2018 |
View all notes |
Set NEW NOTE alert |
Company Profile |
SEC
News |
Chart |
Request a new note
C
A
S
I |
HQY
-
NASDAQ
Healthequity Inc
COMPUTER SOFTWARE and SERVICES - Healthcare Information Service
|
$55.35
|
+1.35
2.50% |
$55.43
|
488,320
79.40% of 50 DAV
50 DAV is 615,000
|
$58.28
-5.03%
|
2/20/2018
|
$56.37
|
PP = $55.41
|
|
MB = $58.18
|
Most Recent Note - 3/1/2018 4:34:29 PM
Y - Ended near the session low with a big volume-driven loss today following 4 consecutive volume-driven gains for a new high. A "positive reversal" was noted on 2/23/18 after early lows undercut both its 50 and 200 DMA lines. Wider than usual intra-day price swings are indicative of uncertainty since highlighted in the 2/20/18 mid-day report (read here). Fundamentals remain strong.
>>> FEATURED STOCK ARTICLE : Fundamentals Remained Favorable and Strength Returned - 2/21/2018 |
View all notes |
Set NEW NOTE alert |
Company Profile |
SEC
News |
Chart |
Request a new note
C
A
S
I |
PYPL
-
NASDAQ
Paypal Holdings Inc
Finance-CrdtCard/PmtPr
|
$78.87
|
+0.23
0.29% |
$79.11
|
9,422,734
97.32% of 50 DAV
50 DAV is 9,682,000
|
$86.32
-8.63%
|
2/1/2018
|
$80.35
|
PP = $79.49
|
|
MB = $83.46
|
Most Recent Note - 3/1/2018 5:32:45 PM
G - Consolidating near its 50 DMA line ($78.34). Subsequent losses below the recent low ($71.63 on 2/09/18) would raise concerns and trigger a more worrisome technical sell signal. Fundamentals remain strong.
>>> FEATURED STOCK ARTICLE : Quietly Consolidating Back Above 50-Day Moving Average - 2/26/2018 |
View all notes |
Set NEW NOTE alert |
Company Profile |
SEC
News |
Chart |
Request a new note
C
A
S
I |
OLLI
-
NASDAQ
Ollie's Bargain Outlet
Retail-DiscountandVariety
|
$61.05
|
+1.65
2.78% |
$61.28
|
407,845
74.83% of 50 DAV
50 DAV is 545,000
|
$61.25
-0.33%
|
11/21/2017
|
$46.78
|
PP = $47.00
|
|
MB = $49.35
|
Most Recent Note - 3/1/2018 5:28:55 PM
G - Holding its ground stubbornly near its all-time high with volume totals cooling. Found prompt support near its 50 DMA line. Prior low ($50.15 on 1/04/18) defines the next important near-term support.
>>> FEATURED STOCK ARTICLE : Consolidating Above 50-Day Moving Average Line - 2/13/2018 |
View all notes |
Set NEW NOTE alert |
Company Profile |
SEC
News |
Chart |
Request a new note
C
A
S
I |
WB
-
NASDAQ
Weibo Corp Cl A Ads
INTERNET - Content
|
$130.55
|
+2.77
2.17% |
$130.67
|
1,700,989
90.82% of 50 DAV
50 DAV is 1,873,000
|
$142.12
-8.14%
|
1/16/2018
|
$126.33
|
PP = $122.21
|
|
MB = $128.32
|
Most Recent Note - 3/1/2018 5:34:34 PM
Y - Color code is changed to yellow after pulling back below its "max buy" level with light volume behind today's 4th consecutive loss. Recently reported earnings +88% on +77% sales revenues for the Dec '17 quarter, continuing its strong earnings track record.
>>> FEATURED STOCK ARTICLE : Consolidating Near 50-Day Average With Earnings News Due - 2/9/2018 |
View all notes |
Set NEW NOTE alert |
Company Profile |
SEC
News |
Chart |
Request a new note
C
A
S
I |
Symbol/Exchange
Company Name
Industry Group |
PRICE |
CHANGE
(%Change) |
Day High |
Volume
(% DAV)
(% 50 day avg vol) |
52 Wk Hi
% From Hi |
Featured
Date |
Price
Featured |
Pivot Featured |
|
Max Buy |
HLI
-
NYSE
Houlihan Lokey Inc Cl A
Finance-Invest Bnk/Bkrs
|
$45.40
|
+0.01
0.02% |
$45.59
|
193,083
88.57% of 50 DAV
50 DAV is 218,000
|
$52.81
-14.03%
|
1/3/2018
|
$45.88
|
PP = $47.09
|
|
MB = $49.44
|
Most Recent Note - 2/28/2018 6:04:10 PM
G - Meeting resistance while recently consolidating below its 50 DMA line ($47.45). The recent low ($43.73 on 2/06/18) defines near term support where a violation would raise greater concerns. Earnings +21% for the Dec '17 quarter were below the +25% minimum earnings guideline (C criteria) raising fundamental concerns. See the latest FSU analysis for more details and a new annotated graph.
>>> FEATURED STOCK ARTICLE : Recently Met Resistance at 50-Day Moving Average - 2/28/2018 |
View all notes |
Set NEW NOTE alert |
Company Profile |
SEC
News |
Chart |
Request a new note
C
A
S
I |
|
|
|
THESE ARE NOT BUY RECOMMENDATIONS!
Comments contained in the body of this report are technical
opinions only. The material herein has been obtained
from sources believed to be reliable and accurate, however,
its accuracy and completeness cannot be guaranteed.
This site is not an investment advisor, hence it does
not endorse or recommend any securities or other investments.
Any recommendation contained in this report may not
be suitable for all investors and it is not to be deemed
an offer or solicitation on our part with respect to
the purchase or sale of any securities. All trademarks,
service marks and trade names appearing in this report
are the property of their respective owners, and are
likewise used for identification purposes only.
This report is a service available
only to active Paid Premium Members.
You may opt-out of receiving report notifications
at any time. Questions or comments may be submitted
by writing to Premium Membership Services 665 S.E. 10 Street, Suite 201 Deerfield Beach, FL 33441-5634 or by calling 1-800-965-8307
or 954-785-1121.
|
|
|