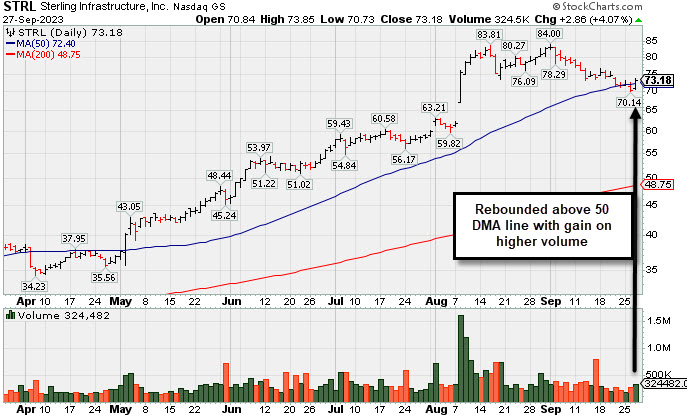
Found Support and Rebounded Above 50-Day Moving Average - Wednesday, September 27, 2023
Sterling Infrastructure (STRL +$2.86 or +4.07% to $73.18) posted a gain with higher (but still below average) volume and closed back above its 50-day moving average (DMA) line ($72.39). It was reassuring to see it find support near that important short-term average. Fundamentals remain strong.
STRL has traded up +159% since it was highlighted in yellow with pivot point cited based on its 11/08/22 high plus 10 cents in the 12/14/22 mid-day report (read here). Volume totals have been cooling while it has sputtered since last covered in detail on 9/13/23 with an annotated graph under the headline, "7th Straight Loss Off High for Sterling Infrastructure".
STRL hails from the Building - Heavy Construction industry group which is currently ranked 14th on the 197 Industry Groups list (L criteria). It has a 97 Earnings Per Share Rating and 7 of the last 8 quarterly comparisons were well above the +25% minimum earnings guideline (C criteria). Annual earnings (A criteria) growth has been strong and steady since FY '17.
The company has a small supply of only 30.8 million shares outstanding. That can lead to greater price volatility in the event of institutional buying or selling. The number of top-rated funds owning its shares rose from 337 in Dec '21 to 422 in Jun '23. Its current Up/Down Volume Ratio of 1.4 is an unbiased indication its shares have been under accumulation over the past 50 days.
| Symbol/Exchange Company Name Industry Group | PRICE | CHANGE | Day High | Volume (% DAV) (% 50 day avg vol) | 52 Wk Hi | Featured Date | Price Featured | Pivot Featured |
| Max Buy | ||||||||
Sterling Infrastructure Bldg-Heavy Construction | $73.18 | +2.86 4.07% | $73.85 | 324,481 50 DAV is 406,000 | $84.00 -12.88% | 12/14/2022 | $32.41 | PP = $33.72 |
| MB = $35.41 | ||||||||
G - Rebounded above its 50 DMA line ($72.39) with today''s gain backed by higher (but still below-average) volume. Fundamentals remain strong. See the latest FSU analysis for more details and a new annotated graph. >>> FEATURED STOCK ARTICLE : Found Support and Rebounded Above 50-Day Moving Average - 9/27/2023 | View all notes | Set NEW NOTE alert | Company Profile | SEC News | Chart | Request a new note | ||||||||
Comfort Systems USA Bldg-A/C and Heating Prds | $172.77 | +3.17 1.87% | $173.76 | 220,577 50 DAV is 247,000 | $192.33 -10.17% | 4/27/2023 | $148.85 | PP = $152.23 |
| MB = $159.84 | ||||||||
| Most Recent Note - 9/26/2023 5:52:51 PM G - Suffered a loss today with light volume. Only a prompt rebound above the 50 DMA line would help its outlook improve. Fundamentals remain strong. >>> FEATURED STOCK ARTICLE : Violated 50-Day Moving Average With a Damaging Gap Down - 9/21/2023 | View all notes | Set NEW NOTE alert | Company Profile | SEC News | Chart | Request a new note | ||||||||
Arista Networks Computer-Networking | $181.60 | +3.68 2.07% | $183.00 | 2,166,115 50 DAV is 2,638,000 | $198.70 -8.61% | 8/1/2023 | $188.84 | PP = $178.46 |
| MB = $187.38 | ||||||||
| Most Recent Note - 9/26/2023 5:51:38 PM G - Quietly sputtering below its 50 DMA line ($181) today with another loss on light volume. Only a prompt rebound above the 50 DMA line would help its outlook improve. Fundamentals remain strong. >>> FEATURED STOCK ARTICLE : Orderly Pullback Below "Max Buy" Level - 9/15/2023 | View all notes | Set NEW NOTE alert | Company Profile | SEC News | Chart | Request a new note | ||||||||
Medpace Holdings Medical-Research Eqp/Svc | $248.00 | +5.85 2.42% | $248.76 | 259,228 50 DAV is 290,000 | $282.73 -12.28% | 7/25/2023 | $196.32 | PP = $241.57 |
| MB = $253.65 | ||||||||
G - Holding its ground for the past week after violating its 50 DMA line ($259.53) with volume-driven losses. A rebound above the 50 DMA line is needed for its outlook to improve. Fundamentals remain strong. >>> FEATURED STOCK ARTICLE : Damaging Streak of Losses Violated 50-Day Moving Average Line - 9/22/2023 | View all notes | Set NEW NOTE alert | Company Profile | SEC News | Chart | Request a new note | ||||||||
Coca-Cola Consolidated Beverages-Non-Alcoholic | $636.60 | -9.40 -1.46% | $648.70 | 23,452 50 DAV is 41,000 | $745.53 -14.61% | 8/3/2023 | $718.56 | PP = $694.30 |
| MB = $729.02 | ||||||||
| Most Recent Note - 9/25/2023 5:25:02 PM G - Volume totals have been cooling while recently sputtering below its 50 DMA line ($672.75) after volume-driven losses. A rebound above the 50 DMA line is needed to help its outlook improve. See the latest FSU analysis for more details and a new annotated graph. >>> FEATURED STOCK ARTICLE : Lingering Below 50 DMA Line and Perched -12.3% Off High - 9/25/2023 | View all notes | Set NEW NOTE alert | Company Profile | SEC News | Chart | Request a new note | ||||||||
| Symbol/Exchange Company Name Industry Group | PRICE | CHANGE | Day High | Volume (% DAV) (% 50 day avg vol) | 52 Wk Hi | Featured Date | Price Featured | Pivot Featured |
| Max Buy | ||||||||
ePlus Computer-Tech Services | $63.34 | +1.05 1.69% | $63.75 | 60,508 50 DAV is 107,000 | $75.90 -16.55% | 8/8/2023 | $67.60 | PP = $62.92 |
| MB = $66.07 | ||||||||
| Most Recent Note - 9/25/2023 5:27:48 PM Y - Volume totals have been cooling while recently consolidating above its 50 DMA line ($62.46). More damaging losses may trigger a technical sell signal. >>> FEATURED STOCK ARTICLE : Still Consolidating Above 50 DMA Line - 9/12/2023 | View all notes | Set NEW NOTE alert | Company Profile | SEC News | Chart | Request a new note | ||||||||
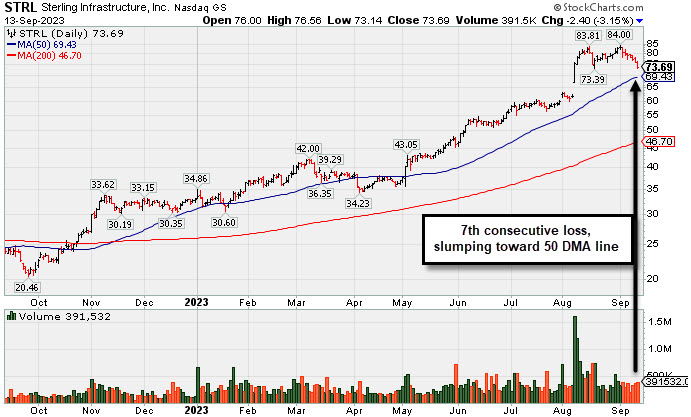
7th Straight Loss Off High for Sterling Infrastructure - Wednesday, September 13, 2023
Sterling Infrastructure (STRL -$2.40 or -3.15% to $73.69) pulled back from its all-time high with today's 7th consecutive loss on near average volume. It is extended from any sound base. Important near-term support is its 50-day moving average (DMA) line ($69.43). Fundamentals remain strong.
STRL was highlighted in yellow with pivot point cited based on its 11/08/22 high plus 10 cents in the 12/14/22 mid-day report (read here). It was last covered in detail on 8/09/23 with an annotated graph under the headline, "Volume-Driven Gains Leave Construction Firm at All-Time High".
STRL hails from the Building - Heavy Construction industry group which is currently ranked 18th on the 197 Industry Groups list (L criteria). It has a 97 Earnings Per Share Rating and 7 of the last 8 quarterly comparisons were well above the +25% minimum earnings guideline (C criteria). Annual earnings (A criteria) growth has been strong and steady since FY '17.
The company has a small supply of only 30.8 million shares outstanding. That can lead to greater price volatility in the event of institutional buying or selling. The number of top-rated funds owning its shares rose from 337 in Dec '21 to 421 in Jun '23. Its current Up/Down Volume Ratio of 1.9 is an unbiased indication its shares have been under accumulation over the past 50 days.
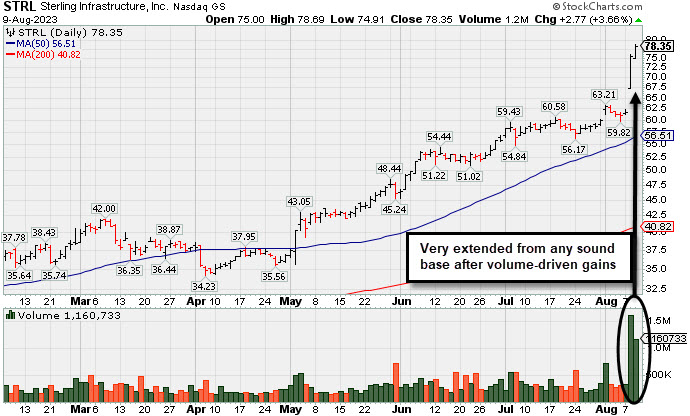
Volume-Driven Gains Leave Construction Firm at All-Time High - Wednesday, August 9, 2023
Sterling Infrastructure (STRL +$2.77 or +3.66% to $78.35) posted a 3rd consecutive volume-driven gain today hitting yet another new all-time high. It is very extended from any sound base. Bullish action came after it reported Jun '23 quarterly earnings +37% on +13% sales revenues versus the year-ago period, a solid increase after the Mar '23 earnings were below the +25% minimum guideline (C criteria).
STRL was highlighted in yellow with pivot point cited based on its 11/08/22 high plus 10 cents in the 12/14/22 mid-day report (read here). It was last covered in detail on 7/03/23 with an annotated graph under the headline, "Streak of Gains Lifts Sterling Infrastructure to New Highs".
STRL hails from the Building - Heavy Construction industry group which is currently ranked 25th on the 197 Industry Groups list (L criteria). It has a 97 Earnings Per Share Rating and 7 of the last 8 quarterly comparisons were well above the +25% minimum earnings guideline (C criteria). Annual earnings (A criteria) growth has been strong and steady since FY '17.
The company has a small supply of only 30.8 million shares outstanding. That can lead to greater price volatility in the event of institutional buying or selling. The number of top-rated funds owning its shares rose from 337 in Dec '21 to 414 in Jun '23. Its current Up/Down Volume Ratio of 1.7 is an unbiased indication its shares have been under accumulation over the past 50 days.
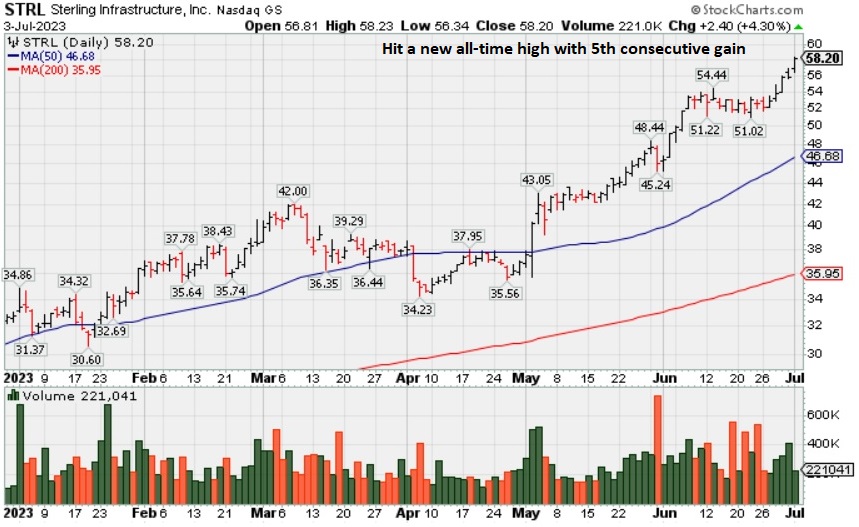
Streak of Gains Lifts Sterling Infrastructure to New Highs - Monday, July 3, 2023
Sterling Infrastructure (STRL +$2.40 or +4.30% to $58.20) hit yet another new all-time high today, getting more extended from any sound base. Bullish action has continued although it reported Mar '23 quarterly earnings +0% on +10% sales revenues versus the year-ago period, below the +25% minimum earning guideline (C criteria) raising fundamental concerns.
STRL was highlighted in yellow with pivot point cited based on its 11/08/22 high plus 10 cents in the 12/14/22 mid-day report (read here). It was last covered in detail on 6/07/23 with an annotated graph under the headline, "Impressive Streak of Gains for New Highs".
STRL hails from the Building - Heavy Construction industry group which is currently ranked 45th on the 197 Industry Groups list (L criteria). It has a 96 Earnings Per Share Rating, down from 99 when recently featured. Through Dec '22 it had 6 quarterly comparisons at or above the +25% minimum earnings guideline (C criteria). Annual earnings (A criteria) growth has been strong and steady since FY '17.
The company has a small supply of only 30.8 million shares outstanding. That can lead to greater price volatility in the event of institutional buying or selling. The number of top-rated funds owning its shares rose from 337 in Dec '21 to 403 in Jun '23. Its current Up/Down Volume Ratio of 1.9 is an unbiased indication its shares have been under accumulation over the past 50 days.
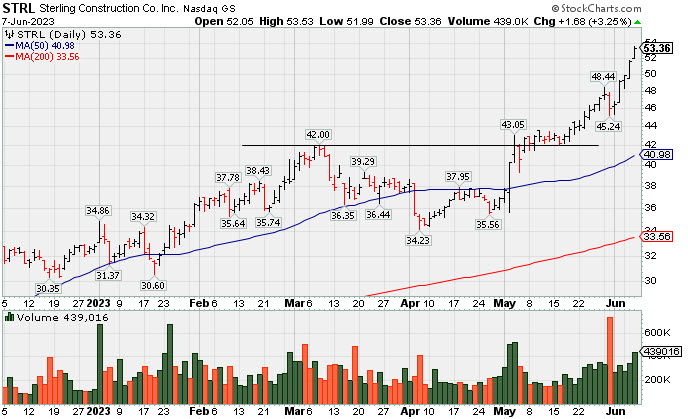
Impressive Streak of Gains for New Highs - Wednesday, June 7, 2023
Sterling Infrastructure (STRL +$1.68 or +3.25% to $53.36) hit yet another new all-time high today, getting more extended from any sound base with its 14th gain in the span of 15 sessions. Bullish action has continued although it reported Mar '23 quarterly earnings +0% on +10% sales revenues versus the year-ago period, below the +25% minimum earnings guideline (C criteria) raising fundamental concerns.
STRL was highlighted in yellow with pivot point cited based on its 11/08/22 high plus 10 cents in the 12/14/22 mid-day report (read here). It was last covered in detail on 4/28/23 with an annotated graph under the headline, "50-Day Moving Average Line Acted as Recent Resistance". In the week that followed it rebounded above the 50-day moving average and rallied above the prior high ($42). Then it stubbornly held its ground for a couple of weeks before marching higher.
STRL hails from the Building - Heavy Construction industry group which is currently ranked 41st on the 197 Industry Groups list (L criteria). It has a 95 Earnings Per Share Rating, down from 99 when recently featured. Through Dec '22 it had 6 quarterly comparisons at or above the +25% minimum earnings guideline (C criteria). Annual earnings (A criteria) growth has been strong and steady since FY '17.
The company has a small supply of only 30.8 million shares outstanding. That can lead to greater price volatility in the event of institutional buying or selling. The number of top-rated funds owning its shares rose from 337 in Dec '21 to 395 in Mar '23. Its current Up/Down Volume Ratio of 2.3 is an unbiased indication its shares have been under accumulation over the past 50 days.
Chart courtesy of www.stockcharts.com
| Symbol/Exchange Company Name Industry Group | PRICE | CHANGE | Day High | Volume (% DAV) (% 50 day avg vol) | 52 Wk Hi | Featured Date | Price Featured | Pivot Featured |
| Max Buy | ||||||||
Graphic Packaging Paper and Paper Products | $26.31 | +0.47 1.82% | $26.44 | 4,068,947 50 DAV is 2,775,000 | $26.16 0.57% | 10/25/2022 | $22.75 | PP = $24.17 |
| MB = $25.38 | ||||||||
| Most Recent Note - 6/6/2023 3:24:17 PM G - Rebounded above its 50 DMA line ($25.11) and it is perched within close striking distance of its all-time high with today's 4th consecutive gain. It has not formed a sound new base of sufficient length. Quickly recovered after testing its 4/27/23 low last week. Reported Mar '23 quarterly earnings +60% on +9% sales revenues versus the year-ago period. >>> FEATURED STOCK ARTICLE : Packaging Firm Due to Report Earnings News - 5/1/2023 | View all notes | Set NEW NOTE alert | Company Profile | SEC News | Chart | Request a new note | ||||||||
Sterling Infrastructure Bldg-Heavy Construction | $53.36 | +1.68 3.25% | $53.53 | 439,016 50 DAV is 245,000 | $51.73 3.15% | 12/14/2022 | $32.41 | PP = $33.72 |
| MB = $35.41 | ||||||||
G - Hit yet another new all-time high with today's 14th gain in the span of 15 sessions, very extended from any sound base. Mar '23 quarterly earnings were below the +25% minimum guideline (C criteria). See the latest FSU analysis for more details and a new annotated graph. >>> FEATURED STOCK ARTICLE : Impressive Streak of Gains for New Highs - 6/7/2023 | View all notes | Set NEW NOTE alert | Company Profile | SEC News | Chart | Request a new note | ||||||||
Comfort Systems USA Bldg-A/C and Heating Prds | $158.15 | -0.69 -0.43% | $161.94 | 331,819 50 DAV is 277,000 | $159.50 -0.85% | 4/27/2023 | $148.85 | PP = $152.23 |
| MB = $159.84 | ||||||||
| Most Recent Note - 6/6/2023 3:10:24 PM Y - Hitting a new all-time high and approaching its "max buy" level with today's big gain backed by light volume. No resistance remains due to overhead supply, however, it has made very little headway in recent weeks. It was repeatedly noted - "Subsequent gains and new highs backed by at least +40% above average volume may help reconfirm a technical buy signal." >>> FEATURED STOCK ARTICLE : Churning Action While Recently Hovering Near All-Time High - 5/12/2023 | View all notes | Set NEW NOTE alert | Company Profile | SEC News | Chart | Request a new note | ||||||||
Coca-Cola Femsa ADR Beverages-Non-Alcoholic | $86.88 | +1.77 2.08% | $87.54 | 301,176 50 DAV is 194,000 | $91.23 -4.77% | 3/7/2023 | $76.63 | PP = $77.11 |
| MB = $80.97 | ||||||||
G - On track today for a 5th consecutive gain after finding support near its 50 DMA line ($84.79). Recent lows in the $81.50 area define the next important support to watch below its 50 DMA line. Reported Mar '23 quarterly earnings +53% on +24% sales revenues versus the year-ago period. >>> FEATURED STOCK ARTICLE : Posted Gain Afrer Reporting Strong Mar '23 Quarterly Results - 5/2/2023 | View all notes | Set NEW NOTE alert | Company Profile | SEC News | Chart | Request a new note | ||||||||
Clean Harbors Pollution Control | $156.08 | +2.80 1.83% | $156.47 | 421,567 50 DAV is 380,000 | $153.87 1.44% | 3/10/2023 | $136.89 | PP = $136.74 |
| MB = $143.58 | ||||||||
| Most Recent Note - 6/6/2023 3:20:35 PM G - Hitting yet another new all-time high with today's big gain backed by below average volume. Its 50 DMA line ($141) defines near-term support to watch on pullbacks. Reported Mar '23 quarterly earnings +64% on +12% sales revenues versus the year-ago period. Fundamentals remain strong. >>> FEATURED STOCK ARTICLE : Showed Resilience Near 50-Day Moving Average Following Sell-Off - 5/10/2023 | View all notes | Set NEW NOTE alert | Company Profile | SEC News | Chart | Request a new note | ||||||||
| Symbol/Exchange Company Name Industry Group | PRICE | CHANGE | Day High | Volume (% DAV) (% 50 day avg vol) | 52 Wk Hi | Featured Date | Price Featured | Pivot Featured |
| Max Buy | ||||||||
SPS Commerce Comp Sftwr-Spec Enterprs | $169.28 | -0.48 -0.28% | $171.77 | 368,175 50 DAV is 143,000 | $170.90 -0.95% | 4/24/2023 | $150.01 | PP = $157.56 |
| MB = $165.44 | ||||||||
| Most Recent Note - 6/6/2023 3:16:49 PM G - Color code is changed to green while rising above its "max buy" level and hitting a new 52-week high with today's 4th consecutive gain backed by near average volume. Gains above the pivot point were not backed by +40% above average volume, so it did not trigger a proper technical buy signal. Reported Mar '23 quarterly earnings +22% on +20% versus the year-ago period, below the +25% minimum earnings guideline (C criteria) raising some fundamental concerns. >>> FEATURED STOCK ARTICLE : Pulled Back After Quietly Wedging to New Highs - 5/31/2023 | View all notes | Set NEW NOTE alert | Company Profile | SEC News | Chart | Request a new note | ||||||||
Hubbell Electrical-Power/Equipmt | $304.50 | +8.33 2.81% | $305.48 | 401,263 50 DAV is 403,000 | $297.46 2.37% | 4/25/2023 | $262.85 | PP = $257.51 |
| MB = $270.39 | ||||||||
G - Gain today with average volume hit yet another new all-time high, getting more extended from the prior base. Prior highs in the $263 area define initial support to watch on pullbacks. Fundamentals remain strong. >>> FEATURED STOCK ARTICLE : Extended From Prior Base and Perched Near High - 6/1/2023 | View all notes | Set NEW NOTE alert | Company Profile | SEC News | Chart | Request a new note | ||||||||
NVR Bldg-Resident/Comml | $5,771.12 | -23.48 -0.41% | $5,851.18 | 24,700 50 DAV is 23,000 | $5,986.96 -3.61% | 4/25/2023 | $5,882.18 | PP = $5,978.25 |
| MB = $6,277.16 | ||||||||
| Most Recent Note - 6/6/2023 5:16:26 PM G - Rebounded further above its 50 DMA line ($5,707) with today's light volume gain helping its technical stance. Reported Mar '23 quarterly earnings -14% on -3% sales revenues versus the year-ago period, below the +25% minimum earnings guideline (C criteria) raising fundamental concerns, and its color code was changed to green. Prior quarterly comparisons were well above the +25% minimum earnings guideline (C criteria). Annual earnings (A criteria) growth has been very strong. See the latest FSU analysis for more details and a new annotated graph. >>> FEATURED STOCK ARTICLE : Rebounded Above 50 Day Average With Light Volume Gains - 6/6/2023 | View all notes | Set NEW NOTE alert | Company Profile | SEC News | Chart | Request a new note | ||||||||
PulteGroup Bldg-Resident/Comml | $71.57 | -0.61 -0.85% | $72.89 | 2,866,178 50 DAV is 2,865,000 | $72.25 -0.94% | 4/25/2023 | $65.17 | PP = $64.01 |
| MB = $67.21 | ||||||||
| Most Recent Note - 6/6/2023 3:13:08 PM G - Hitting another new high with today's 4th consecutive gain backed by light volume, getting extended from any sound base. Reported earnings +28% for the Mar '23 quarter versus the year-ago period. Important support to watch is its 50 DMA line ($64.31). See the latest FSU analysis for more details and an annotated graph. >>> FEATURED STOCK ARTICLE : Rebounded Above "Max Buy" Level Toward Recent High - 6/2/2023 | View all notes | Set NEW NOTE alert | Company Profile | SEC News | Chart | Request a new note | ||||||||
Coca-Cola Consolidated Beverages-Non-Alcoholic | $665.67 | -16.93 -2.48% | $688.36 | 54,999 50 DAV is 34,000 | $694.20 -4.11% | 5/4/2023 | $646.66 | PP = $656.21 |
| MB = $689.02 | ||||||||
| Most Recent Note - 6/5/2023 2:47:33 PM Y - Color code is changed to yellow today after pulling back below its "max buy" level. Bullish action came after it reported Mar '23 quarterly earnings +93% on +12% sales revenues versus the year-ago period, continuing its strong earnings track record. >>> FEATURED STOCK ARTICLE : COKE is Showing Real Strength - 5/4/2023 | View all notes | Set NEW NOTE alert | Company Profile | SEC News | Chart | Request a new note | ||||||||
| Symbol/Exchange Company Name Industry Group | PRICE | CHANGE | Day High | Volume (% DAV) (% 50 day avg vol) | 52 Wk Hi | Featured Date | Price Featured | Pivot Featured |
| Max Buy | ||||||||
Amphastar Pharm Medical-Biomed/Biotech | $45.91 | +0.03 0.07% | $46.29 | 449,498 50 DAV is 399,000 | $46.86 -2.03% | 5/15/2023 | $43.56 | PP = $44.15 |
| MB = $46.36 | ||||||||
Y - Hovering near all-time high and just below "max buy" level stubbornly holding ground. Gain and strong close above the pivot point on 6/02/23 was backed by +55% above average volume clinching a technical buy signal. Fundamentals remain strong. >>> FEATURED STOCK ARTICLE : Weak Finish After Early Gain When Perched Near All-Time High - 5/15/2023 | View all notes | Set NEW NOTE alert | Company Profile | SEC News | Chart | Request a new note | ||||||||
Arista Networks Computer-Networking | $155.59 | -4.09 -2.56% | $162.46 | 3,333,290 50 DAV is 3,231,000 | $178.36 -12.77% | 5/30/2023 | $176.35 | PP = $171.54 |
| MB = $180.12 | ||||||||
Y - Ended near the session low as it suffered a 3rd loss with average volume in the span of 4 sessions. Stalled after recent gains triggered a technical buy signal. Its 50 DMA line ($154) defines important near-term support to watch. Color code was changed to yellow with new pivot point cited based on its 3/23/23 high plus 10 cents in the 5/30/23 mid-day report. Fundamentals remain strong. >>> FEATURED STOCK ARTICLE : Technical Sell Signal Triggered by Damaging Volume-Driven Loss - 5/3/2023 | View all notes | Set NEW NOTE alert | Company Profile | SEC News | Chart | Request a new note | ||||||||
Palo Alto Networks Computer Sftwr-Security | $216.25 | -8.47 -3.77% | $225.91 | 7,168,901 50 DAV is 4,165,000 | $230.18 -6.05% | 6/5/2023 | $228.35 | PP = $213.73 |
| MB = $224.42 | ||||||||
Y - Pulled back for a 2nd consecutive loss today backed by higher volume following an impressive streak of 8 straight volume-driven gains. The prior high ($213) defines initial support to watch. Fundamentals remain strong. >>> FEATURED STOCK ARTICLE : Palo Alto Powers to New Highs Again - 6/5/2023 | View all notes | Set NEW NOTE alert | Company Profile | SEC News | Chart | Request a new note | ||||||||
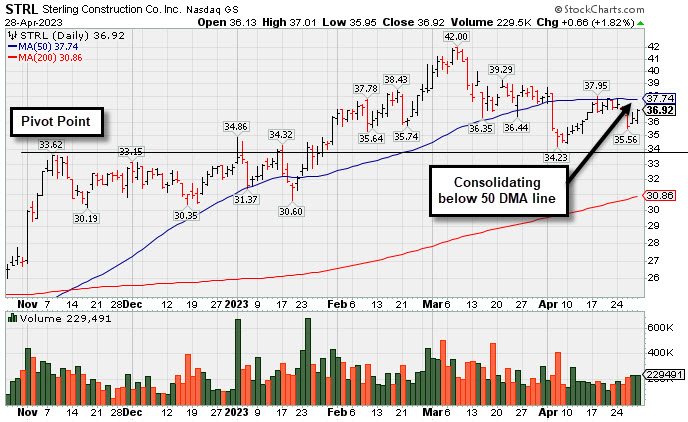
50-Day Moving Average Line Acted as Recent Resistance - Friday, April 28, 2023
Sterling Infrastructure (STRL +$0.66 or +1.82% to $36.92) slumped again after recently meeting resistance at its 50-day moving average (DMA) line ($37.74). A rebound above the 50 DMA line is needed for its outlook to improve. Keep in mind it is due to report Mar '23 quarterly results on 5/01/23. Volume and volatility often increase near earnings news.
STRL was highlighted in yellow with pivot point cited based on its 11/08/22 high plus 10 cents in the 12/14/22 mid-day report (read here). It was last covered in detail on 4/05/23 with an annotated graph under the headline, "Volume-Driven 50-Day Moving Average Violation Triggered Sell Signal".
STRL hails from the Building - Heavy Construction industry group which is currently ranked 88th on the 197 Industry Groups list (L criteria). It has a 99 Earnings Per Share Rating. It reported Dec '22 quarterly earnings +74% on 26% sales revenues versus the year ago period, its 6th quarterly comparison at or above the +25% minimum earnings guideline (C criteria). Annual earnings (A criteria) growth has been strong and steady since FY '17.
The company has a small supply of only 30.6 million shares outstanding. That can lead to greater price volatility in the event of institutional buying or selling. The number of top rated funds owning its shares rose from 337 in Dec '21 to 377 in Mar '23. Its current Up/Down Volume Ratio of 1.2 is an unbiased indication its shares have been under accumulation over the past 50 days.
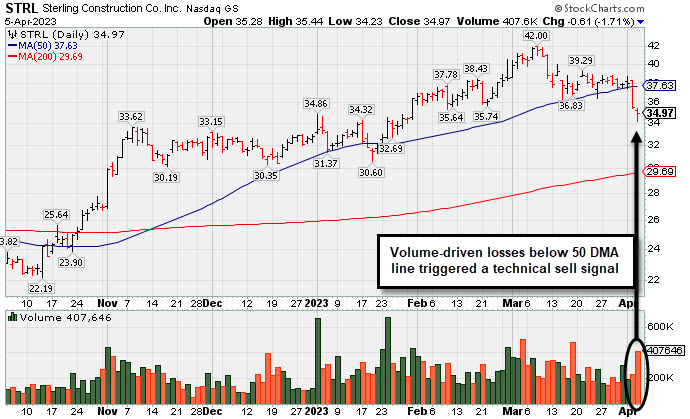
Volume-Driven 50-Day Moving Average Violation Triggered Sell Signal - Wednesday, April 5, 2023
Sterling Infrastructure (STRL -$0.61 or -1.71% to $34.97) suffered damaging volume-driven losses as it violated its 50-day moving average DMA line ($37.63) and slumped below the recent lows in the mid-$36 area triggering technical sell signals. Only a prompt rebound above the 50 DMA line would help its outlook improve.
STRL was highlighted in yellow with pivot point cited based on its 11/08/22 high plus 10 cents in the 12/14/22 mid-day report (read here). It was last covered in detail on 3/20/23 with an annotated graph under the headline, "Posting Quiet Gains Just Above 50-Day Moving Average Line".
STRL hails from the Building - Heavy Construction industry group which is currently ranked 66th on the 197 Industry Groups list (L criteria). It has a 99 Earnings Per Share Rating. It reported Dec '22 quarterly earnings +74% on 26% sales revenues versus the year ago period, its 6th quarterly comparison at or above the +25% minimum earnings guideline (C criteria). Annual earnings (A criteria) growth has been strong and steady since FY '17.
The company has a small supply of only 30.6 million shares outstanding. That can lead to greater price volatility in the event of institutional buying or selling. The number of top rated funds owning its shares rose from 337 in Dec '21 to 369 in Dec '22. Its current Up/Down Volume Ratio of 1.3 is an unbiased indication its shares have been under accumulation over the past 50 days.
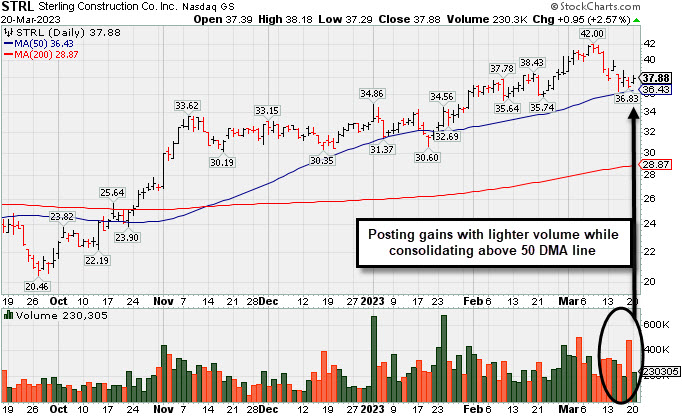
Posting Quiet Gains Just Above 50-Day Moving Average Line - Monday, March 20, 2023
Sterling Infrastructure (STRL+$0.95 or +2.57% to $37.88) posted a gain today with below average volume. It abruptly slumped from its all-time high with recent volume-driven losses. Its 50-day moving average (DMA) line ($36.43) defines initial support above and prior highs in the $34-33 area.
STRL was highlighted in yellow with pivot point cited based on its 11/08/22 high plus 10 cents in the 12/14/22 mid-day report (read here). It was last covered in detail on 2/24/23 with an annotated graph under the headline, "Sterling Perched Near High, Extended From Prior Base".
STRL hails from the Building - Heavy Construction industry group which is currently ranked 67th on the 197 Industry Groups list (L criteria). It has a 99 Earnings Per Share Rating. It reported Dec '22 quarterly earnings +74%, its 6th quarterly comparison at or above the +25% minimum earnings guideline (C criteria). Annual earnings (A criteria) growth has been strong and steady since FY '17.
The company has a small supply of only 30.6 million shares outstanding. That can lead to greater price volatility in the event of institutional buying or selling. The number of top rated funds owning its shares rose from 337 in Dec '21 to 354 in Dec '22. Its current Up/Down Volume Ratio of 1.4 is an unbiased indication its shares have been under accumulation over the past 50 days.
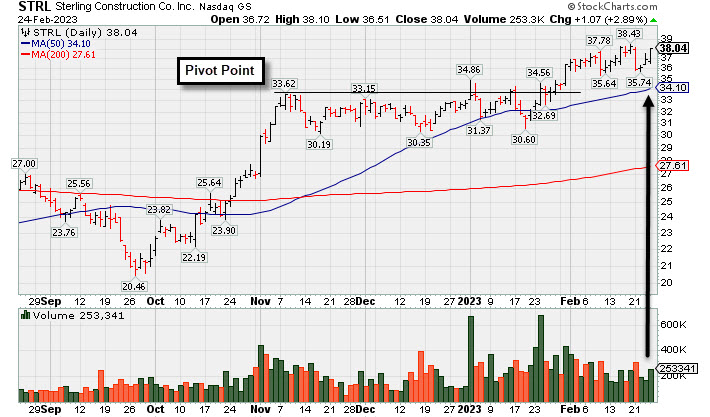
Sterling Perched Near High, Extended From Prior Base - Friday, February 24, 2023
Sterling Infrastructure (STRL +$1.07 or +2.89% to $38.04) is perched near its all-time high, extended from the previously noted base. Prior highs in the $34-33 area and its 50-day moving average (DMA) line ($34.10) define important near-term support to watch.
STRL was highlighted in yellow with pivot point cited based on its 11/08/22 high plus 10 cents in the 12/14/22 mid-day report (read here). Confirming volume-driven gains for new highs were a reassuring sign of fresh institutional buying demand. STRL was last covered in detail on 1/26/23 with an annotated graph under the headline, "Gain With Average Volume While Perched Near Recent Highs".
STRL hails from the Building - Heavy Construction industry group which is currently ranked 62nd on the 197 Industry Groups list (L criteria). It has a 97 Earnings Per Share Rating. It reported Sep '22 quarterly earnings +35% on +20% sales revenues versus the year ago period, its 5th quarterly comparison at or above the +25% minimum earnings guideline (C criteria). Annual earnings (A criteria) growth has been strong and steady since FY '17.
The company has a small supply of only 30.3 million shares outstanding. That can lead to greater price volatility in the event of institutional buying or selling. The number of top rated funds owning its shares rose from 337 in Dec '21 to 352 in Dec '22. Its current Up/Down Volume Ratio of 1.6 is an unbiased indication its shares have been under accumulation over the past 50 days.
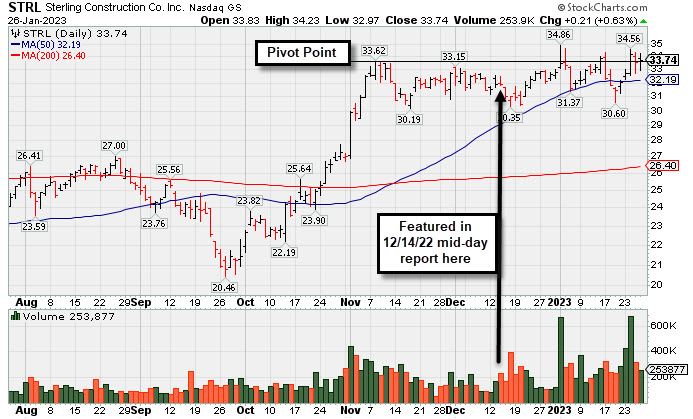
Gain With Average Volume While Perched Near Recent Highs - Thursday, January 26, 2023
Sterling Infrastructure (STRL +$0.21 or +0.63% to $33.74) posted a gain today with +14% above average volume and finished 2 cents above the previously cited pivot point. The 50-day moving average (DMA) line ($32.19) and recent low ($30.60 on 1/19/23) define near-term support levels to watch following its recently noted failed breakout attempt.
STRL was highlighted in yellow with pivot point cited based on its 11/08/22 high plus 10 cents in the 12/14/22 mid-day report (read here). Confirming volume-driven gains for a new high would be a reassuring sign of fresh institutional buying demand. STRL was last covered in detail on 1/09/23 with an annotated graph under the headline, "Finding Support Near 50-Day Moving Average After Failed Breakout Attempt".
STRL hails from the Building - Heavy Construction industry group which is currently ranked 36th on the 197 Industry Groups list (L criteria). It has a 96 Earnings Per Share Rating. It reported Sep '22 quarterly earnings +35% on +20% sales revenues versus the year ago period, its 5th quarterly comparison at or above the +25% minimum earnings guideline (C criteria). Annual earnings (A criteria) growth has been strong and steady since FY '17.
The company has a small supply of only 30.3 million shares outstanding. That can lead to greater price volatility in the event of institutional buying or selling. The number of top rated funds owning its shares rose from 337 in Dec '21 to 343 in Dec '22. Its current Up/Down Volume Ratio of 1.1 is an unbiased indication its shares have been under slight accumulation over the past 50 days.
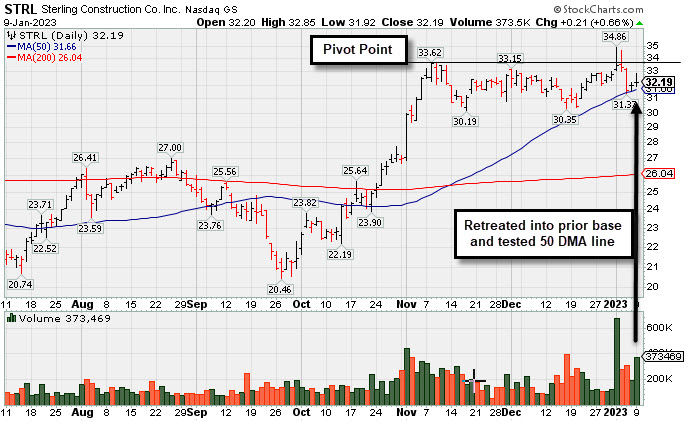
Finding Support Near 50-Day Moving Average After Failed Breakout Attempt - Monday, January 9, 2023
Sterling Infrastructure (STRL+$0.21 or +0.66% to $32.19) abruptly retreated from its 52-week high with 2 consecutive losses backed by above average volume, negating the recent breakout attempt and testing support at its 50-day moving average (DMA) line. It was highlighted in yellow with pivot point cited based on its 11/08/22 high plus 10 cents in the 12/14/22 mid-day report.
Although it faces no resistance due to overhead supply, it reversed most of its early gain on 1/03/22 and closed near the session low - action indicative of distributional pressure rather than that of hearty institutional buying demand. Subsequent gains and a close above the pivot point backed by at least +40% above average volume are needed to trigger a proper technical buy signal. Some of the recent action may rightly be attributed to the broader market's weakness as the market (M criteria) made a noted shift to a "correction". Disciplined investors will watch for a new confirmed uptrend with follow-through day to be noted.
STRL was highlighted in yellow with pivot point cited based on its 11/08/22 high plus 10 cents in the 12/14/22 mid-day report (read here) and is was covered in greater detail that evening with an annotated graph under the headline, "Sterling Infrastructure Forming Orderly Base Pattern".
STRL hails from the Building - Heavy Construction industry group which is ranked 53rd on the 197 Industry Groups list (L criteria). It has a 99 Earnings Per Share Rating. It reported Sep '22 quarterly earnings +35% on +20% sales revenues versus the year ago period, its 5th quarterly comparison at or above the +25% minimum earnings guideline (C criteria). Annual earnings (A criteria) growth has been strong and steady since FY '17.
The company has a small supply of only 30.3 million shares outstanding. That can lead to greater price volatility in the event of institutional buying or selling. The number of top rated funds owning its shares only rose from 337 in Dec '21 to 338 in Sep '22. However, its current Up/Down volume ratio of 1.2 is an unbiased indication its shares have been under accumulation over the past 50 days.
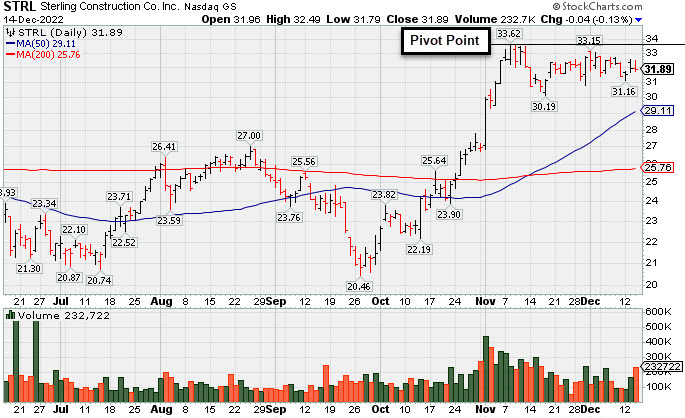
Sterling Infrastructure Forming Orderly Base Pattern - Wednesday, December 14, 2022
Sterling Infrastructure (STRL -$0.04 or -0.13% to $31.89) was highlighted in yellow with pivot point cited based on its 11/08/22 high plus 10 cents in the earlier mid-day report (read here). It has been consolidating for about 5 weeks in a tight range near its all-time high with volume totals cooling. It faces very little resistance due to overhead supply. Subsequent gains above the pivot point backed by at least +40% above average volume are needed to trigger a proper technical buy signal.
STRL hails from the Building - Heavy Construction industry group which is ranked 61st on the 197 Industry Groups list (L criteria). It has a 96 Earnings Per Share Rating. It reported Sep '22 quarterly earnings +35% on +20% sales revenues versus the year ago period, its 5th quarterly comparison at or above the +25% minimum earnings guideline (C criteria). Annual earnings (A criteria) growth has been strong and steady since FY '17.
The company has a small supply of only 30.3 million shares outstanding. That can lead to greater price volatility in the event of institutional buying or selling. The number of top rated funds owning its shares only rose from 337 in Dec '21 to 340 in Sep '22. However, its current Up/Down volume ratio of 1.6 is an unbiased indication its shares have been under accumulation over the past 50 days.
The company has a small supply of only 30.3 million shares outstanding. That can lead to greater price volatility in the event of institutional buying or selling. The number of top rated funds owning its shares only rose from 337 in Dec '21 to 340 in Sep '22. However, its current Up/Down volume ratio of 1.6 is an unbiased indication its shares have been under accumulation over the past 50 days.