You are not logged in.
This means you
CAN ONLY VIEW reports that were published prior to Tuesday, March 25, 2025.
You
MUST UPGRADE YOUR MEMBERSHIP if you want to see any current reports.
AFTER MARKET UPDATE - WEDNESDAY, DECEMBER 14TH, 2022
Previous After Market Report Next After Market Report >>>
|
|
|
|
DOW |
-142.29 |
33,966.35 |
-0.42% |
|
Volume |
1,060,206,668 |
-11% |
|
Volume |
5,480,252,900 |
-10% |
|
NASDAQ |
-85.93 |
11,170.89 |
-0.76% |
|
Advancers |
1,209 |
41% |
|
Advancers |
1,890 |
41% |
|
S&P 500 |
-24.33 |
3,995.32 |
-0.61% |
|
Decliners |
1,714 |
59% |
|
Decliners |
2,664 |
58% |
|
Russell 2000 |
-11.91 |
1,820.45 |
-0.65% |
|
52 Wk Highs |
46 |
|
|
52 Wk Highs |
103 |
|
|
S&P 600 |
-9.72 |
1,193.59 |
-0.81% |
|
52 Wk Lows |
92 |
|
|
52 Wk Lows |
249 |
|
|
 |
Indices Reversed Early Gains to Close Lower After Fed Rate Hike
Kenneth J. Gruneisen - Passed the CAN SLIM® Master's Exam
The Dow shed 142 points, while the Nasdaq Composite fell 0.8%. The S&P 500 declined 0.6%, with 10 sectors ending in negative territory. Volume totals were lighter than the prior session on the NYSE and on the Nasdaq exchange. Breadth was negative as decliners led advancers by almost a 3-2 margin on the NYSE and on the Nasdaq exchange. There were 20 high-ranked companies from the Leaders List that hit new 52-week highs and were listed on the BreakOuts Page, versus the total of 40 on the prior session. New 52-week lows totals expanded and solidly outnumbered shrinking new 52-week highs on the NYSE and on the Nasdaq exchange. The market is in an uptrend (M criteria). Healthy leadership (new 52-week highs totals) must continue for the rally be productive, but new highs totals have recently contracted. Only stocks meeting all key-criteria of the fact-based investment system should be considered as buy candidates.
Chart courtesy of www.stockcharts.com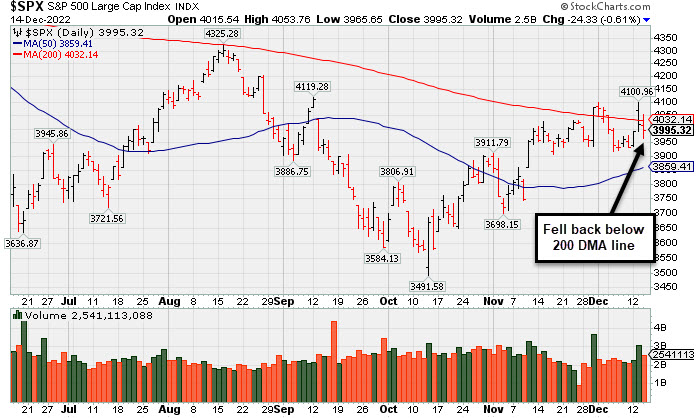 PICTURED: The S&P 500 Index fell back below its 200-day moving average (DMA) line after rallying above it on the prior session. Subsequent gains and a rebound back above the 200 DMA could help to signal that the benchmark index is in healthier shape.
U.S. equities finished lower Wednesday in volatile trading as investors digested the latest Federal Reserve (Fed) monetary policy decision. The central bank has unanimously decided to raise rates by a widely expected 50 basis points (0.50%) to bring the benchmark rate to 4.25%-4.5%. The median forecasts for future rate hikes has been raised to 5.1% in 2023 and 4.1% in 2024. The statement following release reiterated the need for ongoing interest rate hikes to curb inflation. In his post-meeting press conference, Fed Chairman Jerome Powell adopted a more hawkish tone, saying the labor market remains “extremely tight” and the central bank “will stay the course until the job is done.”
On the data front, import prices fell 0.6% month-over-month in November, while export prices fell by a less-than-expected 0.3%. Elsewhere, MBA mortgage applications climbed 3.2% in the week ended December 9. Treasuries were little changed following the rate hike announcement, with the yield on the benchmark 10-year note down three basis points (0.03%) to 3.48%, while the 30-year bond yield dipped one basis point (0.01%) to 3.53%. The yield on the two-year note, which is more sensitive to changes in Fed policy, declined one basis point (0.01%) to 4.22%. In commodities, West Texas Intermediate (WTI) crude climbed 2.7% to $77.42/barrel amid reports of an uptick in 2023 crude demand. The Organization of Petroleum Exporting Countries (OPEC) and International Energy Agency (IEA) both reported more upbeat demand forecasts for the upcoming year.
|
 Kenneth J. Gruneisen started out as a licensed stockbroker in August 1987, a couple of months prior to the historic stock market crash that took the Dow Jones Industrial Average down -22.6% in a single day. He has published daily fact-based fundamental and technical analysis on high-ranked stocks online for two decades. Through FACTBASEDINVESTING.COM, Kenneth provides educational articles, news, market commentary, and other information regarding proven investment systems that work in good times and bad.
Comments contained in the body of this report are technical opinions only and are not necessarily those of Gruneisen Growth Corp. The material herein has been obtained from sources believed to be reliable and accurate, however, its accuracy and completeness cannot be guaranteed. Our firm, employees, and customers may effect transactions, including transactions contrary to any recommendation herein, or have positions in the securities mentioned herein or options with respect thereto. Any recommendation contained in this report may not be suitable for all investors and it is not to be deemed an offer or solicitation on our part with respect to the purchase or sale of any securities. |
|
 |
Biotech Index Edged Higher on Mostly Negative Session
Kenneth J. Gruneisen - Passed the CAN SLIM® Master's Exam
The Bank Index ($BKX -1.69%) and Broker/Dealer Index ($XBD -1.64%) lost ground and created a drag on the major indices while the Retail Index ($RLX -0.34%) suffered a smaller loss. The Semiconductor Index($SOX -1.57%) outpaced the Networking Index ($NWX -0.51%) to the downside while the Biotech Index ($BTK +0.55%) eked out a small gain. Commodity-linked groups had a slightly negative bias as the Gold & Silver Index ($XAU -0.65%), Oil Services Index ($OSX -0.64%), and Integrated Oil Index ($XOI -0.65%) unanimously edged lower.
PICTURED: The Oil Services Index ($OSX -0.64%) nearly tested its 200-day moving average (DMA) line then rebounded above its 50 DMA line.
| Oil Services |
$OSX |
80.49 |
-0.52 |
-0.64% |
+52.67% |
| Integrated Oil |
$XOI |
1,739.14 |
-11.32 |
-0.65% |
+47.61% |
| Semiconductor |
$SOX |
2,777.27 |
-44.26 |
-1.57% |
-29.62% |
| Networking |
$NWX |
824.23 |
-4.19 |
-0.51% |
-15.12% |
| Broker/Dealer |
$XBD |
459.75 |
-7.65 |
-1.64% |
-5.57% |
| Retail |
$RLX |
2,905.66 |
-9.86 |
-0.34% |
-31.25% |
| Gold & Silver |
$XAU |
122.02 |
-0.80 |
-0.65% |
-7.87% |
| Bank |
$BKX |
100.32 |
-1.73 |
-1.69% |
-24.12% |
| Biotech |
$BTK |
5,420.50 |
+29.45 |
+0.55% |
-1.77% |
|
|
|
 |
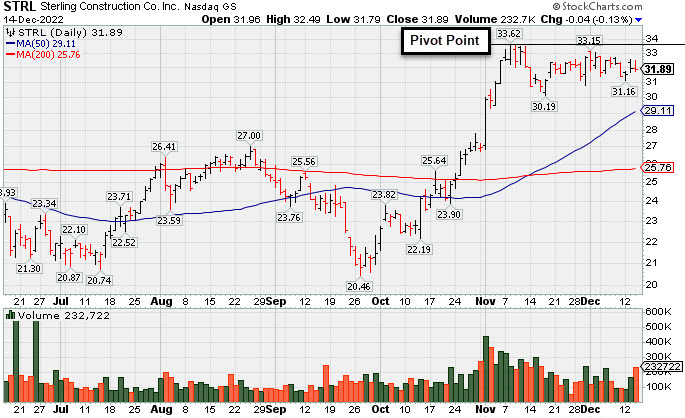
Sterling Infrastructure Forming Orderly Base Pattern
Kenneth J. Gruneisen - Passed the CAN SLIM® Master's Exam
Sterling Infrastructure (STRL -$0.04 or -0.13% to $31.89) was highlighted in yellow with pivot point cited based on its 11/08/22 high plus 10 cents in the earlier mid-day report (read here). It has been consolidating for about 5 weeks in a tight range near its all-time high with volume totals cooling. It faces very little resistance due to overhead supply. Subsequent gains above the pivot point backed by at least +40% above average volume are needed to trigger a proper technical buy signal.
STRL hails from the Building - Heavy Construction industry group which is ranked 61st on the 197 Industry Groups list (L criteria). It has a 96 Earnings Per Share Rating. It reported Sep '22 quarterly earnings +35% on +20% sales revenues versus the year ago period, its 5th quarterly comparison at or above the +25% minimum earnings guideline (C criteria). Annual earnings (A criteria) growth has been strong and steady since FY '17.
The company has a small supply of only 30.3 million shares outstanding. That can lead to greater price volatility in the event of institutional buying or selling. The number of top rated funds owning its shares only rose from 337 in Dec '21 to 340 in Sep '22. However, its current Up/Down volume ratio of 1.6 is an unbiased indication its shares have been under accumulation over the past 50 days.
|
|
|
Color Codes Explained :
Y - Better candidates highlighted by our
staff of experts.
G - Previously featured
in past reports as yellow but may no longer be buyable under the
guidelines.
***Last / Change / Volume data in this table is the closing quote data***
Symbol/Exchange
Company Name
Industry Group |
PRICE |
CHANGE
(%Change) |
Day High |
Volume
(% DAV)
(% 50 day avg vol) |
52 Wk Hi
% From Hi |
Featured
Date |
Price
Featured |
Pivot Featured |
|
Max Buy |
 ESQ
-
NASDAQ
ESQ
-
NASDAQ
Esquire Financial Hldgs
Finance-Commercial Loans
|
$41.68
|
-0.14
-0.33% |
$41.98
|
29,673
109.90% of 50 DAV
50 DAV is 27,000
|
$48.13
-13.40%
|
10/18/2022
|
$40.02
|
PP = $39.95
|
|
MB = $41.95
|
Most Recent Note - 12/12/2022 6:09:28 PM
G - Managed a positive reversal today after early weakness below its 50 DMA line, testing prior highs and its 50 DMA line ($42.43) defining important near-term support to watch.
>>> FEATURED STOCK ARTICLE : Pulled Back Following "Negative Reversal" at All-Time High - 11/25/2022 |
View all notes |
Set NEW NOTE alert |
Company Profile |
SEC
News |
Chart |
Request a new note
C
A
S
I |
CMC
-
NYSE
Commercial Metals Co
METALS and MINING - Steel and Iron
|
$48.85
|
+0.05
0.10% |
$49.35
|
1,243,107
125.06% of 50 DAV
50 DAV is 994,000
|
$50.83
-3.90%
|
10/14/2022
|
$41.61
|
PP = $44.45
|
|
MB = $46.67
|
Most Recent Note - 12/13/2022 6:52:27 PM
G - Posted a 2nd consecutive gain today but ended near the session low. Remains perched near its 52-week high after breaking a streak of 9 consecutive weekly gains. Fundamentals remain strong. Prior highs define initial support to watch above its 50 DMA line ($45.38).
>>> FEATURED STOCK ARTICLE : Wedging Higher With Recent Gains Lacking Great Volume - 12/2/2022 |
View all notes |
Set NEW NOTE alert |
Company Profile |
SEC
News |
Chart |
Request a new note
C
A
S
I |
VRTX
-
NASDAQ
Vertex Pharmaceuticals
Medical-Biomed/Biotech
|
$312.09
|
+5.00
1.63% |
$314.80
|
1,402,447
95.34% of 50 DAV
50 DAV is 1,471,000
|
$324.75
-3.90%
|
10/24/2022
|
$308.47
|
PP = $306.05
|
|
MB = $321.35
|
Most Recent Note - 12/13/2022 6:47:26 PM
Y - Pulled back today with above average volume after wedging to new highs with light volume, testing support near its 50 DMA line ($307.36) and prior pivot point. Recently reported Sep '22 quarterly earnings +14% on +18% sales revenues versus the year ago period, below the +25% minimum earnings guideline raising fundamental concerns (C criteria). See the latest FSU analysis for more details and a new annotated graph.
>>> FEATURED STOCK ARTICLE : Testing Support Near 50-Day Moving Average Line and Prior Pivot - 12/13/2022 |
View all notes |
Set NEW NOTE alert |
Company Profile |
SEC
News |
Chart |
Request a new note
C
A
S
I |
GPK
-
NYSE
Graphic Packaging Hldg
CONSUMER NON-DURABLES - Packaging and Containers
|
$22.31
|
+0.12
0.54% |
$22.65
|
2,655,803
90.18% of 50 DAV
50 DAV is 2,945,100
|
$24.07
-7.31%
|
10/25/2022
|
$22.75
|
PP = $24.17
|
|
MB = $25.38
|
Most Recent Note - 12/13/2022 6:54:02 PM
Y - Posted a 2nd consecutive gain today but ended near the session low, consolidating just above its 50 DMA line ($22.04). More damaging losses would raise concerns and trigger a technical sell signal. Subsequent gains above the pivot point backed by at least +40% above average volume may trigger a technical buy signal. Fundamentals remain strong.
>>> FEATURED STOCK ARTICLE : Consolidating Above 50-Day Moving Average Still Perched Near High - 11/17/2022 |
View all notes |
Set NEW NOTE alert |
Company Profile |
SEC
News |
Chart |
Request a new note
C
A
S
I |
CBZ
-
NYSE
C B I Z Inc
Comml Svcs-Consulting
|
$49.97
|
-0.54
-1.07% |
$51.02
|
232,631
89.13% of 50 DAV
50 DAV is 261,000
|
$51.67
-3.29%
|
10/26/2022
|
$47.83
|
PP = $48.57
|
|
MB = $51.00
|
Most Recent Note - 12/12/2022 6:41:39 PM
Y - Posted a 3rd consecutive small gain today with +22% above average volume, hovering near its 52-week high. Its 50 DMA line ($47.45) and recent low define important near-term support. It has formed an orderly new 6-week flat base but a new pivot point is not cited because it has made little headway from the prior base and remains below the "max buy" level. Recently reported Sep '22 quarterly earnings +24% on +28% sales revenues versus the year ago period.
>>> FEATURED STOCK ARTICLE : Gapped Up and Rebounded Above Pivot Point - 11/18/2022 |
View all notes |
Set NEW NOTE alert |
Company Profile |
SEC
News |
Chart |
Request a new note
C
A
S
I |
Symbol/Exchange
Company Name
Industry Group |
PRICE |
CHANGE
(%Change) |
Day High |
Volume
(% DAV)
(% 50 day avg vol) |
52 Wk Hi
% From Hi |
Featured
Date |
Price
Featured |
Pivot Featured |
|
Max Buy |
ENPH
-
NASDAQ
Enphase Energy Inc
Energy-Solar
|
$332.80
|
+6.81
2.09% |
$338.10
|
2,745,484
69.68% of 50 DAV
50 DAV is 3,940,000
|
$339.92
-2.09%
|
10/26/2022
|
$301.55
|
PP = $324.94
|
|
MB = $341.19
|
 Most Recent Note - 12/14/2022 6:18:38 PM
Y - Posted a 3rd consecutive gain with below average volume while wedging above its pivot point. Stalled after hitting a new all-time high on 12/02/22 with a volume-driven gain above its pivot point. Faces no resistance due to overhead supply. Its 50 DMA line ($290) defines near-term support to watch on pullbacks. Fundamentals remain strong.
>>> FEATURED STOCK ARTICLE : Perched Near High Still Awaiting Technical Breakout - 11/21/2022 |
View all notes |
Set NEW NOTE alert |
Company Profile |
SEC
News |
Chart |
Request a new note
C
A
S
I |
HRMY
-
NASDAQ
Harmony Biosciences Holdings
Medical-Biomed/Biotech
|
$58.65
|
-0.64
-1.08% |
$60.00
|
334,327
71.00% of 50 DAV
50 DAV is 470,900
|
$62.09
-5.54%
|
11/1/2022
|
$55.31
|
PP = $57.23
|
|
MB = $60.09
|
Most Recent Note - 12/13/2022 7:00:05 PM
Y - Still hovering below its "max buy" level with below average volume totals. Its 50 DMA line ($54.92) and 11/17/22 low ($53.06) define important near-term support to watch.
>>> FEATURED STOCK ARTICLE : Harmony Still Hovering Near All-Time High - 11/28/2022 |
View all notes |
Set NEW NOTE alert |
Company Profile |
SEC
News |
Chart |
Request a new note
C
A
S
I |
CLH
-
NYSE
Clean Harbors Inc
Pollution Control
|
$118.76
|
-1.44
-1.20% |
$120.62
|
281,710
69.39% of 50 DAV
50 DAV is 406,000
|
$125.41
-5.30%
|
11/2/2022
|
$121.59
|
PP = $124.59
|
|
MB = $130.82
|
Most Recent Note - 12/13/2022 6:49:47 PM
Y - Posted a gain today with average volume. Still consolidating back below its pivot point yet remaining above its 50 DMA line ($117) and recent low ($114.86 on 11/29/22) which define important near-term support to watch. Fundamentals remain strong.
>>> FEATURED STOCK ARTICLE : Volume-Driven Losses Undercut 50-Day Moving Average - 11/29/2022 |
View all notes |
Set NEW NOTE alert |
Company Profile |
SEC
News |
Chart |
Request a new note
C
A
S
I |
NPO
-
NYSE
Enpro Industries Inc
Machinery-Gen Industrial
|
$107.94
|
-3.53
-3.17% |
$111.29
|
97,089
97.09% of 50 DAV
50 DAV is 100,000
|
$127.67
-15.45%
|
11/4/2022
|
$119.06
|
PP = $117.73
|
|
MB = $123.62
|
Most Recent Note - 12/14/2022 6:20:38 PM
G - It violated its 50 DMA line ($108.63) with today's loss on average volume triggering a technical sell signal and its color code is changed to green. A prompt rebound above the 50 DMA line is needed for its outlook to improve. Fundamentals remain strong.
>>> FEATURED STOCK ARTICLE : Consolidating Near Old Highs Following Recent Breakout - 12/1/2022 |
View all notes |
Set NEW NOTE alert |
Company Profile |
SEC
News |
Chart |
Request a new note
C
A
S
I |
DGII
-
NASDAQ
Digi International Inc
COMPUTER HARDWARE - Networking and Communication Dev
|
$39.57
|
-0.96
-2.37% |
$40.93
|
235,176
62.38% of 50 DAV
50 DAV is 377,000
|
$43.68
-9.41%
|
11/10/2022
|
$41.82
|
PP = $40.96
|
|
MB = $43.01
|
Most Recent Note - 12/14/2022 6:16:52 PM
Y - Suffered a loss today with lighter than average volume, slumping near its 50 DMA line ($38.83) and prior lows defining important near-term support to watch. Fundamentals remain strong.
>>> FEATURED STOCK ARTICLE : Sputtering After Recently Wedging to New Highs - 12/6/2022 |
View all notes |
Set NEW NOTE alert |
Company Profile |
SEC
News |
Chart |
Request a new note
C
A
S
I |
Symbol/Exchange
Company Name
Industry Group |
PRICE |
CHANGE
(%Change) |
Day High |
Volume
(% DAV)
(% 50 day avg vol) |
52 Wk Hi
% From Hi |
Featured
Date |
Price
Featured |
Pivot Featured |
|
Max Buy |
GFF
-
NYSE
Griffon Corporation
MATERIALS and CONSTRUCTION - General Building Materials
|
$35.99
|
-0.34
-0.94% |
$36.54
|
292,017
79.57% of 50 DAV
50 DAV is 367,000
|
$37.69
-4.51%
|
11/10/2022
|
$34.13
|
PP = $35.02
|
|
MB = $36.77
|
Most Recent Note - 12/13/2022 12:42:54 PM
Y - Hit a new 52-week high today with a 2nd consecutive volume-driven gain. Recently consolidating near prior highs in the $34 area which define initial support to watch above its 50 DMA line ($32.99). Reported Sep '22 quarterly earnings +230% on +24% sales revenues versus the year ago period.
>>> FEATURED STOCK ARTICLE : No Meaningful Progress After Breakout 3 Weeks Ago - 12/7/2022 |
View all notes |
Set NEW NOTE alert |
Company Profile |
SEC
News |
Chart |
Request a new note
C
A
S
I |
ANET
-
NYSE
Arista Networks Inc
Computer-Networking
|
$130.99
|
-2.03
-1.53% |
$135.29
|
2,148,486
88.63% of 50 DAV
50 DAV is 2,424,000
|
$148.57
-11.83%
|
11/14/2022
|
$132.05
|
PP = $133.70
|
|
MB = $140.39
|
Most Recent Note - 12/12/2022 6:56:11 PM
Y - Posted a gain today with below average volume. Its 50-day moving average (DMA) line ($123) defines near-term support to watch. Subsequent gains and a close above the pivot point must be backed by at least +40% above average volume to trigger a proper technical buy signal. Faces some resistance due to overhead supply up to the $148 level. Fundamentals are strong.
>>> FEATURED STOCK ARTICLE : Sputtered Back Below Prior High Hurting Outlook - 12/9/2022 |
View all notes |
Set NEW NOTE alert |
Company Profile |
SEC
News |
Chart |
Request a new note
C
A
S
I |
CPRX
-
NASDAQ
Catalyst Pharma Inc
Medical-Biomed/Biotech
|
$17.71
|
-0.09
-0.51% |
$18.38
|
2,342,871
105.96% of 50 DAV
50 DAV is 2,211,000
|
$18.39
-3.70%
|
11/22/2022
|
$17.38
|
PP = $16.66
|
|
MB = $17.49
|
Most Recent Note - 12/12/2022 6:51:14 PM
Y - Posted a big volume-driven gain today approaching its "max buy" level. Recently consolidating near the prior high and well above its 50 DMA line ($14.70).
>>> FEATURED STOCK ARTICLE : Breakout From Cup-With-Handle With 90% Above Average Volume - 11/22/2022 |
View all notes |
Set NEW NOTE alert |
Company Profile |
SEC
News |
Chart |
Request a new note
C
A
S
I |
TITN
-
NASDAQ
Titan Machinery Inc
SPECIALTY RETAIL
|
$40.94
|
+0.80
1.99% |
$41.15
|
307,599
163.62% of 50 DAV
50 DAV is 188,000
|
$44.35
-7.69%
|
11/30/2022
|
$40.10
|
PP = $38.68
|
|
MB = $40.61
|
Most Recent Note - 12/12/2022 6:48:53 PM
Y - Consolidating in an orderly fashion above the prior high in the $38 area which defines initial support to watch. Fundamentals remain strong after reporting Oct '22 quarterly earnings +91% on +47% sales revenues.
>>> FEATURED STOCK ARTICLE : Gap Up and Big Volume-Driven Breakout Gain - 11/30/2022 |
View all notes |
Set NEW NOTE alert |
Company Profile |
SEC
News |
Chart |
Request a new note
C
A
S
I |
MYE
-
NYSE
Myers Industries Inc
Containers/Packaging
|
$23.30
|
-0.47
-1.98% |
$23.91
|
191,306
150.63% of 50 DAV
50 DAV is 127,000
|
$25.55
-8.81%
|
12/8/2022
|
$23.94
|
PP = $25.65
|
|
MB = $26.93
|
Most Recent Note - 12/13/2022 6:56:07 PM
Y - Posted a gain today with above average volume but ended near the session low. Highlighted in yellow with pivot point cited based on its 6/06/22 high plus 10 cents in the 12/08/22 mid-day report. It is -6.9% off its 52-week high. Subsequent gains above the pivot point backed by at least +40% above average volume may trigger a technical buy signal. The Sep '22 quarter showed +78% earnings on +14% sales revenues versus the year ago period. The past 4 quarterly comparisons were above the +25% minimum guideline (C criteria), however, its sales revenues growth rate has shown deceleration in sequential comparisons +45%, +29%, +24%, to +14%. Annual earnings (A criteria) history had a slight downturn in FY '19 but growth has been otherwise strong and steady.
>>> FEATURED STOCK ARTICLE : Myers Industries on Track for 9th Straight Weekly Gain - 12/8/2022 |
View all notes |
Set NEW NOTE alert |
Company Profile |
SEC
News |
Chart |
Request a new note
C
A
S
I |
Symbol/Exchange
Company Name
Industry Group |
PRICE |
CHANGE
(%Change) |
Day High |
Volume
(% DAV)
(% 50 day avg vol) |
52 Wk Hi
% From Hi |
Featured
Date |
Price
Featured |
Pivot Featured |
|
Max Buy |
BOX
-
NYSE
Box Inc Cl A
Computer Sftwr-Database
|
$31.69
|
+0.41
1.31% |
$32.00
|
2,126,408
194.90% of 50 DAV
50 DAV is 1,091,000
|
$33.04
-4.09%
|
12/12/2022
|
$29.83
|
PP = $29.57
|
|
MB = $31.05
|
Most Recent Note - 12/13/2022 12:20:23 PM
Y - Gapped up for a 2nd consecutive session and it is trading near its "max buy" level. Color code was changed to yellow with pivot point cited based on its 11/01/22 high plus 10 cents in the prior mid-day report while noted - "It formed an orderly base and recently found support near its 50 and 200 DMA lines. Faces some additional resistance due to overhead supply up to the $33 level. Quarterly and annual earnings increases have been strong and steady." See the latest FSU analysis for more details and an annotated graph.
>>> FEATURED STOCK ARTICLE : Volume Heavy Behind Breakout for Box Inc - 12/12/2022 |
View all notes |
Set NEW NOTE alert |
Company Profile |
SEC
News |
Chart |
Request a new note
C
A
S
I |
STRL
-
NASDAQ
Sterling Infrastructure
MATERIALS and; CONSTRUCTION - Heavy Construction
|
$31.89
|
-0.04
-0.13% |
$32.49
|
232,722
130.01% of 50 DAV
50 DAV is 179,000
|
$33.62
-5.15%
|
12/14/2022
|
$32.41
|
PP = $33.72
|
|
MB = $35.41
|
Most Recent Note - 12/14/2022 6:15:20 PM
Y - Highlighted in yellow with pivot point cited based on its 11/08/22 high plus 10 cents in the earlier mid-day report. Consolidating for about 5 weeks in a tight range near its all-time high with volume totals cooling. Faces very little resistance due to overhead supply. Subsequent gains above the pivot point backed by at least +40% above average volume are needed to trigger a proper technical buy signal. Reported Sep '22 quarterly earnings +35% on +20% sales revenues versus the year ago period, its 5th quarterly comparison at or above the +25% minimum earnings guideline (C criteria). After years of losses it has shown improving annual earnings (A criteria) since FY '17. See the latest FSU analysis for more details and an annotated graph.
>>> FEATURED STOCK ARTICLE : Sterling Infrastructure Forming Orderly Base Pattern - 12/14/2022 |
View all notes |
Set NEW NOTE alert |
Company Profile |
SEC
News |
Chart |
Request a new note
C
A
S
I |
|
|
|
THESE ARE NOT BUY RECOMMENDATIONS!
Comments contained in the body of this report are technical
opinions only. The material herein has been obtained
from sources believed to be reliable and accurate, however,
its accuracy and completeness cannot be guaranteed.
This site is not an investment advisor, hence it does
not endorse or recommend any securities or other investments.
Any recommendation contained in this report may not
be suitable for all investors and it is not to be deemed
an offer or solicitation on our part with respect to
the purchase or sale of any securities. All trademarks,
service marks and trade names appearing in this report
are the property of their respective owners, and are
likewise used for identification purposes only.
This report is a service available
only to active Paid Premium Members.
You may opt-out of receiving report notifications
at any time. Questions or comments may be submitted
by writing to Premium Membership Services 665 S.E. 10 Street, Suite 201 Deerfield Beach, FL 33441-5634 or by calling 1-800-965-8307
or 954-785-1121.
|
|
|