You are not logged in.
This means you
CAN ONLY VIEW reports that were published prior to Thursday, April 10, 2025.
You
MUST UPGRADE YOUR MEMBERSHIP if you want to see any current reports.
AFTER MARKET UPDATE - WEDNESDAY, AUGUST 9TH, 2023
Previous After Market Report Next After Market Report >>>
|
|
|
|
DOW |
-191.13 |
35,123.36 |
-0.54% |
|
Volume |
829,629,049 |
-2% |
|
Volume |
5,638,612,200 |
+6% |
|
NASDAQ |
-162.31 |
13,722.02 |
-1.17% |
|
Advancers |
1,253 |
44% |
|
Advancers |
1,608 |
37% |
|
S&P 500 |
-31.67 |
4,467.71 |
-0.70% |
|
Decliners |
1,573 |
56% |
|
Decliners |
2,709 |
63% |
|
Russell 2000 |
-16.65 |
1,930.77 |
-0.86% |
|
52 Wk Highs |
75 |
|
|
52 Wk Highs |
80 |
|
|
S&P 600 |
-8.85 |
1,249.55 |
-0.70% |
|
52 Wk Lows |
34 |
|
|
52 Wk Lows |
187 |
|
|
 |
Losses Pushed Nasdaq Composite Below 50-Day Moving Average
Kenneth J. Gruneisen - Passed the CAN SLIM® Master's Exam
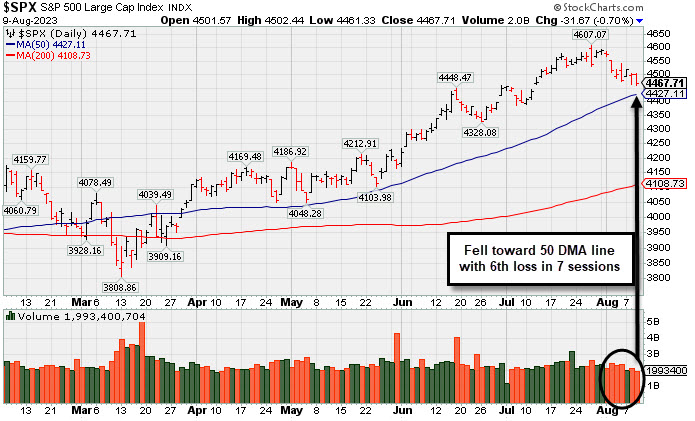
The major averages suffered unanimous losses on Wednesday and the Nasdaq Composite Index closed the session below its 50-day moving average line. Volume totals reported were mixed, lighter than the prior session total on the NYSE and higher on the Nasdaq exchange. Decliners led advancers by a narrow margin on the NYSE and by 3-2 on the Nasdaq exchange. There were 25 high-ranked companies from the Leaders List that hit a new 52-week high and were listed on the BreakOuts Page, down from the total of 32 on the prior session. New 52-week highs outnumbered new 52-week lows on the NYSE, but for a 6th consecutive session new lows convincingly outnumbered new highs on the Nasdaq exchange. The major indices are in an uptrend that is under pressure (M criteria), Healthy leadership is crucial to any sustained rally. Appropriate new buying efforts may still be considered under the fact-based investment system. Greater caution may be necessary in the event of a more serious correction.
PICTURED: The S&P 500 Index suffered a 6th loss in the span of 7 sessions, slumping toward its 50-day moving average (DMA) line.
The major indices turned lower ahead of the close and settled near the worst levels of the day. Mega cap losses had an outsized impact on index performance. The S&P 500 energy sector (+1.2%) was the top performer. The information technology sector (-1.5%) closed with the steepest loss.
Twilio (TWLO +2.2%), Duolingo (DUOL +6.6%), and Akamai Tech (AKAM +8.5%) each rose after reporting earnings. Penn Entertainment (PENN +9.1%) was a standout gainer after announcing a 10-year exclusive U.S. online sports betting agreement with ESPN.
Treasuries settled mixed ahead of Thursday's release of the July Consumer Price Index. The 2-yr note yield rose five basis points to 4.80% and the 10-yr note yield fell one basis point to 4.01%.
|
 Kenneth J. Gruneisen started out as a licensed stockbroker in August 1987, a couple of months prior to the historic stock market crash that took the Dow Jones Industrial Average down -22.6% in a single day. He has published daily fact-based fundamental and technical analysis on high-ranked stocks online for two decades. Through FACTBASEDINVESTING.COM, Kenneth provides educational articles, news, market commentary, and other information regarding proven investment systems that work in good times and bad.
Comments contained in the body of this report are technical opinions only and are not necessarily those of Gruneisen Growth Corp. The material herein has been obtained from sources believed to be reliable and accurate, however, its accuracy and completeness cannot be guaranteed. Our firm, employees, and customers may effect transactions, including transactions contrary to any recommendation herein, or have positions in the securities mentioned herein or options with respect thereto. Any recommendation contained in this report may not be suitable for all investors and it is not to be deemed an offer or solicitation on our part with respect to the purchase or sale of any securities. |
|
 |
Energy-Linked Indexes and Biotech Index Rose
Kenneth J. Gruneisen - Passed the CAN SLIM® Master's Exam
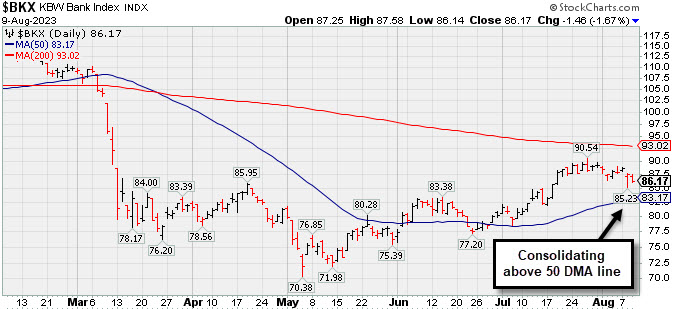
The Retail Index ($RLX -0.89%), Bank Index ($BKX -1.67%) and the Broker/Dealer Index ($XBD -1.16%) each lost ground. The tech sector was led lower by the Semiconductor Index ($SOX -1.87%) and the Networking Index ($NWX -1.21%) while the Biotech Index ($BTK +0.49%) eked out a small gain. The Gold & Silver Index ($XAU -0.43%) ended slightly in the red while the Oil Services Index ($OSX +1.08%) and the Integrated Oil Index ($XOI +1.34%) both posted solid gains.
PICTURED: The Bank Index ($BKX -1.67%) has been recently consolidating above its 50-day moving average (DMA) line but it remains below its 200 DMA line.
| Oil Services |
$OSX |
94.09 |
+1.00 |
+1.08% |
+12.20% |
| Integrated Oil |
$XOI |
1,871.56 |
+24.68 |
+1.34% |
+4.72% |
| Semiconductor |
$SOX |
3,610.47 |
-68.95 |
-1.87% |
+42.59% |
| Networking |
$NWX |
781.91 |
-9.57 |
-1.21% |
-0.18% |
| Broker/Dealer |
$XBD |
497.78 |
-5.82 |
-1.16% |
+10.83% |
| Retail |
$RLX |
3,606.27 |
-32.47 |
-0.89% |
+30.95% |
| Gold & Silver |
$XAU |
117.89 |
-0.51 |
-0.43% |
-2.46% |
| Bank |
$BKX |
86.17 |
-1.46 |
-1.67% |
-14.55% |
| Biotech |
$BTK |
5,204.44 |
+25.39 |
+0.49% |
-1.45% |
|
|
|
 |
Volume-Driven Gains Leave Construction Firm at All-Time High
Kenneth J. Gruneisen - Passed the CAN SLIM® Master's Exam
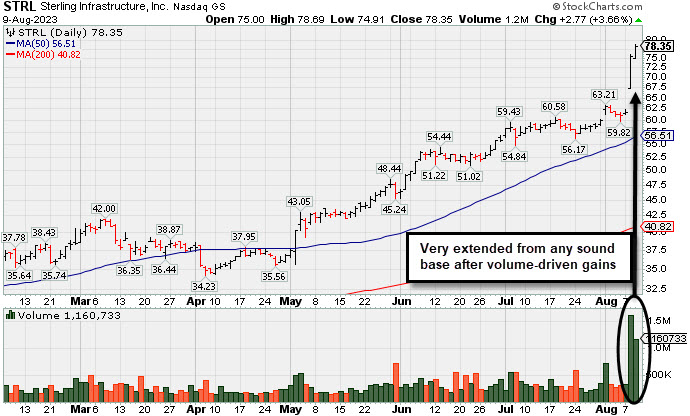
Sterling Infrastructure (STRL +$2.77 or +3.66% to $78.35) posted a 3rd consecutive volume-driven gain today hitting yet another new all-time high. It is very extended from any sound base. Bullish action came after it reported Jun '23 quarterly earnings +37% on +13% sales revenues versus the year-ago period, a solid increase after the Mar '23 earnings were below the +25% minimum guideline (C criteria).
STRL hails from the Building - Heavy Construction industry group which is currently ranked 25th on the 197 Industry Groups list (L criteria). It has a 97 Earnings Per Share Rating and 7 of the last 8 quarterly comparisons were well above the +25% minimum earnings guideline (C criteria). Annual earnings (A criteria) growth has been strong and steady since FY '17.
The company has a small supply of only 30.8 million shares outstanding. That can lead to greater price volatility in the event of institutional buying or selling. The number of top-rated funds owning its shares rose from 337 in Dec '21 to 414 in Jun '23. Its current Up/Down Volume Ratio of 1.7 is an unbiased indication its shares have been under accumulation over the past 50 days.
|
|
|
Color Codes Explained :
Y - Better candidates highlighted by our
staff of experts.
G - Previously featured
in past reports as yellow but may no longer be buyable under the
guidelines.
***Last / Change / Volume data in this table is the closing quote data***
|
|
|
THESE ARE NOT BUY RECOMMENDATIONS!
Comments contained in the body of this report are technical
opinions only. The material herein has been obtained
from sources believed to be reliable and accurate, however,
its accuracy and completeness cannot be guaranteed.
This site is not an investment advisor, hence it does
not endorse or recommend any securities or other investments.
Any recommendation contained in this report may not
be suitable for all investors and it is not to be deemed
an offer or solicitation on our part with respect to
the purchase or sale of any securities. All trademarks,
service marks and trade names appearing in this report
are the property of their respective owners, and are
likewise used for identification purposes only.
This report is a service available
only to active Paid Premium Members.
You may opt-out of receiving report notifications
at any time. Questions or comments may be submitted
by writing to Premium Membership Services 665 S.E. 10 Street, Suite 201 Deerfield Beach, FL 33441-5634 or by calling 1-800-965-8307
or 954-785-1121.
|
|
|