You are not logged in.
This means you
CAN ONLY VIEW reports that were published prior to Sunday, March 23, 2025.
You
MUST UPGRADE YOUR MEMBERSHIP if you want to see any current reports.
AFTER MARKET UPDATE - MONDAY, MAY 15TH, 2023
Previous After Market Report Next After Market Report >>>
|
|
|
|
DOW |
+47.98 |
33,348.60 |
+0.14% |
|
Volume |
806,807,408 |
+3% |
|
Volume |
4,031,756,000 |
-4% |
|
NASDAQ |
+80.47 |
12,365.21 |
+0.66% |
|
Advancers |
1,925 |
67% |
|
Advancers |
2,873 |
64% |
|
S&P 500 |
+12.20 |
4,136.28 |
+0.30% |
|
Decliners |
968 |
33% |
|
Decliners |
1,593 |
36% |
|
Russell 2000 |
+20.70 |
1,761.55 |
+1.19% |
|
52 Wk Highs |
38 |
|
|
52 Wk Highs |
78 |
|
|
S&P 600 |
+11.66 |
1,131.27 |
+1.04% |
|
52 Wk Lows |
57 |
|
|
52 Wk Lows |
160 |
|
|
 |
Major Indices Inched Higher With Lighter Volume Totals
Kenneth J. Gruneisen - Passed the CAN SLIM® Master's Exam
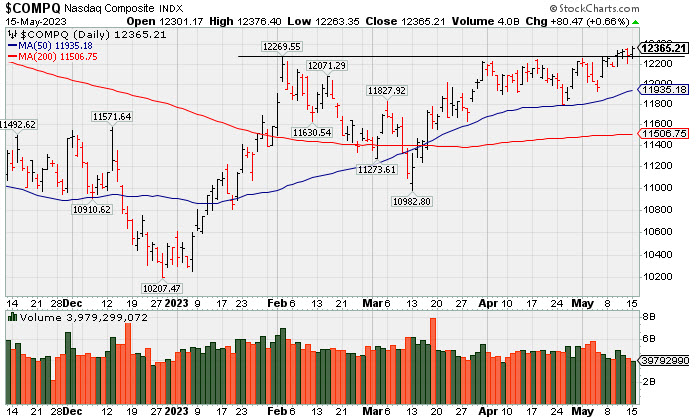
The Dow climbed 48 points (0.1%), while the Nasdaq Composite advanced 0.7% and the S&P 500 added 0.3%. Volume totals reported were mixed, higher on the NYSE and lighter on the Nasdaq exchange versus the prior session. Advancers led decliners by a 2-1 margin on the NYSE and nearly 2-1 on the Nasdaq exchange. There were 24 high-ranked companies from the Leaders List that hit a new 52-week high and were listed on the BreakOuts Page, versus the total of 29 on the prior session. New 52-week lows outnumbered new 52-week highs on the NYSE and on the Nasdaq exchange. The major indices are in a confirmed uptrend (M criteria). Appropriate new buying efforts may be considered under the fact-based investment system.
PICTURED: The Nasdaq Composite Index wedged to a new 2023 high with a gain on Monday backed by lackluster volume.
Six of 11 sectors ended in positive territory as U.S. equities finished higher Monday. Investors are waiting for further progress on the U.S. debt ceiling negotiations. Over the weekend, U.S. Treasury Secretary Janet Yellen indicated it was likely the U.S. would avoid a default. President Biden, House Speaker Kevin McCarthy, and other congressional leaders are set to meet tomorrow to discuss the matter further.
Meanwhile, investors also digested economic data and commentary from Federal Reserve (Fed) officials. On the data front, the New York Fed Empire Manufacturing Survey fell further than expected, down to -31.8 from April’s 10.8 print, as orders and shipments shrank rapidly. In the central bank space today, Atlanta Fed President Raphael Bostic indicated that it would be unlikely for the Fed to cut interest rates this year, while Minneapolis Fed President Neel Kashkari stated that the Fed probably has more work to do to bring inflation down.
Treasuries weakened, with the yield on the benchmark 10-year note up three basis points (0.03%) to 3.49%, while the 30-year bond yield climbed six basis points (0.06%) to 3.84%. The yield on the two-year note, which is more sensitive to changes in Fed policy, advanced 1 basis point (0.01%) to 4.00%. Over in the commodity pits, West Texas Intermediate (WTI) crude added 1.6% to $71.13/barrel on concerns of tighter supply amid wildfires in Canada and as the Organization of Petroleum Exporting Countries (OPEC) implements production cuts.
|
 Kenneth J. Gruneisen started out as a licensed stockbroker in August 1987, a couple of months prior to the historic stock market crash that took the Dow Jones Industrial Average down -22.6% in a single day. He has published daily fact-based fundamental and technical analysis on high-ranked stocks online for two decades. Through FACTBASEDINVESTING.COM, Kenneth provides educational articles, news, market commentary, and other information regarding proven investment systems that work in good times and bad.
Comments contained in the body of this report are technical opinions only and are not necessarily those of Gruneisen Growth Corp. The material herein has been obtained from sources believed to be reliable and accurate, however, its accuracy and completeness cannot be guaranteed. Our firm, employees, and customers may effect transactions, including transactions contrary to any recommendation herein, or have positions in the securities mentioned herein or options with respect thereto. Any recommendation contained in this report may not be suitable for all investors and it is not to be deemed an offer or solicitation on our part with respect to the purchase or sale of any securities. |
|
 |
Tech, Financial, and Commodity-Linked Groups Rose
Kenneth J. Gruneisen - Passed the CAN SLIM® Master's Exam
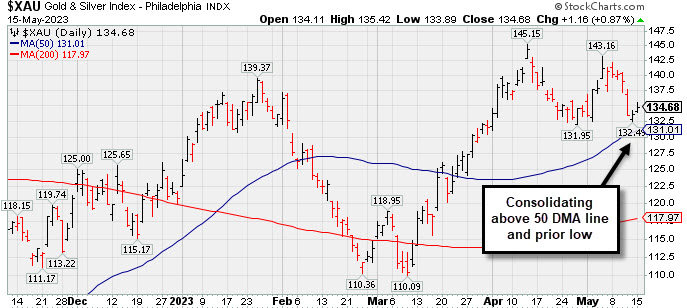
Financials posted solid gains as the Bank Index ($BKX +2.56%) outpaced the Broker/Dealer Index ($XBD +1.49%). The tech sector had a positive bias as the Semiconductor Index ($SOX +2.68%) and Biotech Index ($BTK +2.11%) both outpaced the Networking Index ($NWX +1.05%). The Retail Index ($RLX +0.23%) edged higher. The Oil Services Index ($OSX +1.51%), Integrated Oil Index ($XOI +0.91%), and Gold & Silver Index ($XAU +0.87%) each posted gains.
PICTURED: The Gold & Silver Index ($XAU +0.87%) posted a gain while consolidating above its 50-day and prior low.
| Oil Services |
$OSX |
72.82 |
+1.08 |
+1.51% |
-13.17% |
| Integrated Oil |
$XOI |
1,642.76 |
+14.75 |
+0.91% |
-8.08% |
| Semiconductor |
$SOX |
3,052.64 |
+79.80 |
+2.68% |
+20.56% |
| Networking |
$NWX |
734.34 |
+7.64 |
+1.05% |
-6.25% |
| Broker/Dealer |
$XBD |
436.60 |
+6.41 |
+1.49% |
-2.79% |
| Retail |
$RLX |
3,114.48 |
+7.06 |
+0.23% |
+13.09% |
| Gold & Silver |
$XAU |
134.68 |
+1.16 |
+0.87% |
+11.43% |
| Bank |
$BKX |
74.51 |
+1.86 |
+2.56% |
-26.12% |
| Biotech |
$BTK |
5,422.11 |
+112.07 |
+2.11% |
+2.67% |
|
|
|
 |
Weak Finish After Early Gain When Perched Near All-Time High
Kenneth J. Gruneisen - Passed the CAN SLIM® Master's Exam
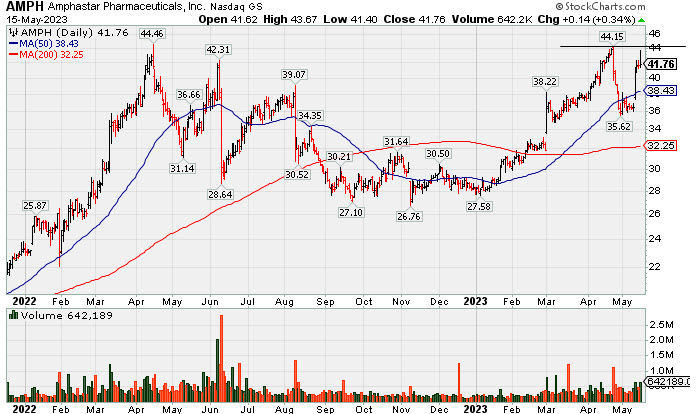
Amphastar Pharm (AMPH +$0.14 or +0.34% to $41.76) finished near the session low after an early gain. It was highlighted in yellow with pivot point cited based on its 4/24/23 high in the earlier mid-day report (read here). It rebounded near its 52-week and all-time highs with today's gain backed by +61% above average volume. Subsequent gains and a strong close above the pivot point backed by at least +40% above average volume may clinch a technical buy signal. Disciplined investors know to be patient and watch for proof of fresh institutional buying demand that can lead to a sustained and meaningful advance in price.
It hails from the Medical-Biomed/Biotech group which is currently ranked 12th on the 197 Industry Groyups list (L cvriteria). It has a 99 Earnings Per Share Rating, well above the 80+ minimum guideline for buy candidates. Three of the 4 latest quarterly comparisons through Mar '23 versus the year-ago periods have been strong and well above the +25% minimum earnings guideline (C criteria). Annual earnings history (A criteria) has been strong.
The number of top-rated funds owning its shares reported fell from 454 in Jun '22 to 430 in Mar '23, not a reassuring sign concerning the I criteria. Its current Up/Down Volume Ratio of 0.9 is an unbiased indication its shares have been under slight distributional pressure over the past 50 days.
|
|
|
Color Codes Explained :
Y - Better candidates highlighted by our
staff of experts.
G - Previously featured
in past reports as yellow but may no longer be buyable under the
guidelines.
***Last / Change / Volume data in this table is the closing quote data***
Symbol/Exchange
Company Name
Industry Group |
PRICE |
CHANGE
(%Change) |
Day High |
Volume
(% DAV)
(% 50 day avg vol) |
52 Wk Hi
% From Hi |
Featured
Date |
Price
Featured |
Pivot Featured |
|
Max Buy |
 GPK
-
NYSE
GPK
-
NYSE
Graphic Packaging
CONSUMER NON-DURABLES - Packaging and Containers
|
$25.83
|
-0.12
-0.46% |
$26.07
|
2,650,705
87.83% of 50 DAV
50 DAV is 3,018,000
|
$26.16
-1.26%
|
10/25/2022
|
$22.75
|
PP = $24.17
|
|
MB = $25.38
|
Most Recent Note - 5/12/2023 5:35:34 PM
G - Volume totals have been cooling while quietly perched near its all-time high. Reported Mar '23 quarterly earnings +60% on +9% sales revenues versus the year-ago period. Its 50 DMA line ($24.74) defines important near-term support to watch on pullbacks.
>>> FEATURED STOCK ARTICLE : Packaging Firm Due to Report Earnings News - 5/1/2023 |
View all notes |
Set NEW NOTE alert |
Company Profile |
SEC
News |
Chart |
Request a new note
C
A
S
I |
STRL
-
NASDAQ
Sterling Infrastructure
MATERIALS and; CONSTRUCTION - Heavy Construction
|
$43.04
|
+0.39
0.91% |
$43.23
|
192,350
79.16% of 50 DAV
50 DAV is 243,000
|
$43.60
-1.28%
|
12/14/2022
|
$32.41
|
PP = $33.72
|
|
MB = $35.41
|
Most Recent Note - 5/11/2023 6:26:45 PM
G - Perched at its all-time high with volume totals cooling. Reported Mar '23 quarterly earnings +0% on +10% sales revenues versus the year-ago period, below the +25% minimum earnings guideline (C criteria) raising fundamental concerns.
>>> FEATURED STOCK ARTICLE : 50-Day Moving Average Line Acted as Recent Resistance - 4/28/2023 |
View all notes |
Set NEW NOTE alert |
Company Profile |
SEC
News |
Chart |
Request a new note
C
A
S
I |
FIX
-
NYSE
Comfort Systems USA
MATERIALS and CONSTRUCTION - General Contractors
|
$151.45
|
+1.16
0.77% |
$152.15
|
253,179
86.41% of 50 DAV
50 DAV is 293,000
|
$154.15
-1.75%
|
4/27/2023
|
$148.85
|
PP = $152.23
|
|
MB = $159.84
|
Most Recent Note - 5/12/2023 5:38:55 PM
Y - Perched near its all-time high. No resistance remains due to overhead supply, however, it has made little headway in recent weeks while churning above-average volume. Subsequent gains and new highs backed by at least +40% above average volume may help reconfirm a technical buy signal. See the latest FSU analysis for more details and a new annotated graph.
>>> FEATURED STOCK ARTICLE : Churning Action While Recently Hovering Near All-Time High - 5/12/2023 |
View all notes |
Set NEW NOTE alert |
Company Profile |
SEC
News |
Chart |
Request a new note
C
A
S
I |
KOF
-
NYSE
Coca-Cola Femsa ADR
FOOD and BEVERAGE - Beverages - Soft Drinks
|
$88.84
|
+0.11
0.12% |
$89.81
|
161,233
81.43% of 50 DAV
50 DAV is 198,000
|
$91.23
-2.62%
|
3/7/2023
|
$76.63
|
PP = $77.11
|
|
MB = $80.97
|
Most Recent Note - 5/12/2023 5:39:59 PM
G - Pulled back from its all-time high with lighter volume today. Reported Mar '23 quarterly earnings +53% on +24% sales revenues versus the year-ago period. On pullbacks, prior highs in the $79-$77 area define initial support to watch along with its 50 DMA line ($81.51).
>>> FEATURED STOCK ARTICLE : Posted Gain Afrer Reporting Strong Mar '23 Quarterly Results - 5/2/2023 |
View all notes |
Set NEW NOTE alert |
Company Profile |
SEC
News |
Chart |
Request a new note
C
A
S
I |
CLH
-
NYSE
Clean Harbors
Pollution Control
|
$139.53
|
+1.02
0.74% |
$140.39
|
250,080
58.16% of 50 DAV
50 DAV is 430,000
|
$147.76
-5.57%
|
3/10/2023
|
$136.89
|
PP = $136.74
|
|
MB = $143.58
|
Most Recent Note - 5/10/2023 5:47:17 PM
Y - Found support near its 50 DMA line ($138.24) after a big loss last week triggered a technical sell signal. More damaging losses would raise greater concerns. Reported Mar '23 quarterly earnings +64% on +12% sales revenues versus the year-ago period. Recently wedged up above its "max buy" level with gains backed by lackluster volume, not action considered indicative of fresh institutional buying demand. Fundamentals remain strong. See the latest FSU analysis for more details and a new annotated graph.
>>> FEATURED STOCK ARTICLE : Showed Resilience Near 50-Day Moving Average Following Sell-Off - 5/10/2023 |
View all notes |
Set NEW NOTE alert |
Company Profile |
SEC
News |
Chart |
Request a new note
C
A
S
I |
Symbol/Exchange
Company Name
Industry Group |
PRICE |
CHANGE
(%Change) |
Day High |
Volume
(% DAV)
(% 50 day avg vol) |
52 Wk Hi
% From Hi |
Featured
Date |
Price
Featured |
Pivot Featured |
|
Max Buy |
MTRN
-
NYSE
Materion
METALS and MINING - Industrial Metals and Minerals
|
$102.94
|
+1.31
1.29% |
$104.21
|
54,915
53.32% of 50 DAV
50 DAV is 103,000
|
$121.29
-15.13%
|
4/18/2023
|
$114.52
|
PP = $118.30
|
|
MB = $124.22
|
Most Recent Note - 5/9/2023 6:54:29 PM
G - Fell with lighter volume after abruptly retreating on 5/04/23 for damaging loss with above-average volume as it again violated its 50 DMA line ($110.75) raising concerns. Disciplined investors may note that it did not quite produce a gain and a strong close above the pivot point backed by at least +40% above average volume to trigger a proper technical buy signal. Reported Mar '23 quarterly earnings +13% versus the year-ago period, below the +25% minimum guideline (C criteria) raising fundamental concerns. See the latest FSU analysis for more details and a new annotated graph.
>>> FEATURED STOCK ARTICLE : Materion Sputtering Below 50 DMA Line After Subpar Earnings - 5/9/2023 |
View all notes |
Set NEW NOTE alert |
Company Profile |
SEC
News |
Chart |
Request a new note
C
A
S
I |
SPSC
-
NASDAQ
SPS Commerce
COMPUTER SOFTWARE and SERVICES - Application Software
|
$155.84
|
+0.12
0.08% |
$156.90
|
134,113
90.62% of 50 DAV
50 DAV is 148,000
|
$159.65
-2.39%
|
4/24/2023
|
$150.01
|
PP = $157.56
|
|
MB = $165.44
|
Most Recent Note - 5/10/2023 5:31:28 PM
Y - Hit a new 52-week high with today's 4th consecutive gain backed by average volume. Subsequent gains above the pivot point backed by at least +40% above average volume may trigger a technical buy signal. Reported Mar '23 quarterly earnings +22% on +20% versus the year-ago period, below the +25% minimum earnings guideline (C criteria) raising some fundamental concerns.
>>> FEATURED STOCK ARTICLE : Sputtered While Perched in Striking Distance of 52-Week HIgh - 4/24/2023 |
View all notes |
Set NEW NOTE alert |
Company Profile |
SEC
News |
Chart |
Request a new note
C
A
S
I |
HUBB
-
NYSE
Hubbell
Electrical-Power/Equipmt
|
$273.58
|
+0.06
0.02% |
$274.82
|
457,261
116.65% of 50 DAV
50 DAV is 392,000
|
$282.19
-3.05%
|
4/25/2023
|
$262.85
|
PP = $257.51
|
|
MB = $270.39
|
Most Recent Note - 5/9/2023 3:04:04 PM
G - Holding its ground near its all-time high with volume totals cooling. Bullish action came after its strong Mar '23 quarterly results. Prior highs in the $263 area define initial support to watch on pullbacks.
>>> FEATURED STOCK ARTICLE : Gap Up Following Earnings Triggered Technical Buy Signal - 4/25/2023 |
View all notes |
Set NEW NOTE alert |
Company Profile |
SEC
News |
Chart |
Request a new note
C
A
S
I |
NVR
-
NYSE
NVR Inc
MATERIALS and CONSTRUCTION - Residential Construction
|
$5,898.82
|
+76.41
1.31% |
$5,900.00
|
22,406
101.85% of 50 DAV
50 DAV is 22,000
|
$5,986.96
-1.47%
|
4/25/2023
|
$5,882.18
|
PP = $5,978.25
|
|
MB = $6,277.16
|
Most Recent Note - 5/10/2023 5:53:37 PM
G - Still hovering near its all-time high with volume totals cooling. Reported Mar '23 quarterly earnings -14% on -3% sales revenues versus the year-ago period, below the +25% minimum earnings guideline (C criteria) raising fundamental concerns, and its color code was changed to green. Confirming gains and a close above the pivot point backed by at least +40% above average volume may clinch a proper technical buy signal. Prior quarterly comparisons were well above the +25% minimum earnings guideline (C criteria). Annual earnings (A criteria) growth has been very strong.
>>> FEATURED STOCK ARTICLE : Fell From High and Raised Concern With Subpar Mar '23 Report - 4/27/2023 |
View all notes |
Set NEW NOTE alert |
Company Profile |
SEC
News |
Chart |
Request a new note
C
A
S
I |
PHM
-
NYSE
PulteGroup
MATERIALS and CONSTRUCTION - Residential Construction
|
$68.55
|
+0.12
0.18% |
$68.70
|
2,431,124
80.63% of 50 DAV
50 DAV is 3,015,000
|
$68.88
-0.48%
|
4/25/2023
|
$65.17
|
PP = $64.01
|
|
MB = $67.21
|
Most Recent Note - 5/10/2023 5:59:32 PM
G - Perched at its all-time high and "max buy" level and its color code is changed to green. Reported earnings +28% for the Mar '23 quarter versus the year-ago period. Prior highs in the $64-60 area define initial support to watch above its 50 DMA line ($59.61).
>>> FEATURED STOCK ARTICLE : Recently Rallying to New All-Time Highs - 4/26/2023 |
View all notes |
Set NEW NOTE alert |
Company Profile |
SEC
News |
Chart |
Request a new note
C
A
S
I |
Symbol/Exchange
Company Name
Industry Group |
PRICE |
CHANGE
(%Change) |
Day High |
Volume
(% DAV)
(% 50 day avg vol) |
52 Wk Hi
% From Hi |
Featured
Date |
Price
Featured |
Pivot Featured |
|
Max Buy |
COKE
-
NASDAQ
Coca-Cola Consolidated
FOOD and BEVERAGE - Beverages - Soft Drinks
|
$633.05
|
+1.05
0.17% |
$634.85
|
29,980
85.66% of 50 DAV
50 DAV is 35,000
|
$694.20
-8.81%
|
5/4/2023
|
$646.66
|
PP = $656.21
|
|
MB = $689.02
|
Most Recent Note - 5/9/2023 3:09:26 PM
Y - Pulling back today for a 3rd consecutive loss, raising concerns while slumping back below the pivot point cited. Solid gain on 5/04/23 backed by +128% above average volume as it closed above the new pivot point cited based on its 6/07/22 high plus 10 cents triggered a technical buy signal. Bullish action came after it reported Mar '23 quarterly earnings +93% on +12% sales revenues versus the year-ago period, continuing its strong earnings track record.
>>> FEATURED STOCK ARTICLE : COKE is Showing Real Strength - 5/4/2023 |
View all notes |
Set NEW NOTE alert |
Company Profile |
SEC
News |
Chart |
Request a new note
C
A
S
I |
AMPH
-
NASDAQ
Amphastar Pharm
Medical-Biomed/Biotech
|
$41.76
|
+0.14
0.34% |
$43.67
|
642,189
164.66% of 50 DAV
50 DAV is 390,000
|
$44.15
-5.41%
|
5/15/2023
|
$43.56
|
PP = $44.15
|
|
MB = $46.36
|
 Most Recent Note - 5/15/2023 8:26:24 PM
Y - Finished near the session low with a small gain today while churning above-average volume, action indicative of distributional pressure, after highlighted in the mid-day report in yellow with pivot point cited based on its 4/24/23 high. Rebounded near its 52-week and all-time highs with today's early gain. Subsequent gains and a strong close above the pivot point backed by at least +40% above average volume may clinch a technical buy signal. Three of the 4 latest quarterly comparisons through Mar '23 versus the year-ago periods have been strong and well above the +25% minimum earnings guideline (C criteria). Annual earnings history (A criteria) has been strong. See the latest FSU analysis for more details and a new annotated graph.
There are no Featured Stock Updates™ available for this stock at this time. You may request one by clicking the Request a New Note link below |
View all notes |
Set NEW NOTE alert |
Company Profile |
SEC
News |
Chart |
Request a new note
C
A
S
I |
|
|
|
THESE ARE NOT BUY RECOMMENDATIONS!
Comments contained in the body of this report are technical
opinions only. The material herein has been obtained
from sources believed to be reliable and accurate, however,
its accuracy and completeness cannot be guaranteed.
This site is not an investment advisor, hence it does
not endorse or recommend any securities or other investments.
Any recommendation contained in this report may not
be suitable for all investors and it is not to be deemed
an offer or solicitation on our part with respect to
the purchase or sale of any securities. All trademarks,
service marks and trade names appearing in this report
are the property of their respective owners, and are
likewise used for identification purposes only.
This report is a service available
only to active Paid Premium Members.
You may opt-out of receiving report notifications
at any time. Questions or comments may be submitted
by writing to Premium Membership Services 665 S.E. 10 Street, Suite 201 Deerfield Beach, FL 33441-5634 or by calling 1-800-965-8307
or 954-785-1121.
|
|
|