You are not logged in.
This means you
CAN ONLY VIEW reports that were published prior to Thursday, March 20, 2025.
You
MUST UPGRADE YOUR MEMBERSHIP if you want to see any current reports.
AFTER MARKET UPDATE - TUESDAY, JUNE 6TH, 2023
Previous After Market Report Next After Market Report >>>
|
|
|
|
DOW |
+10.42 |
33,573.28 |
+0.03% |
|
Volume |
857,578,543 |
+1% |
|
Volume |
4,847,854,000 |
+11% |
|
NASDAQ |
+46.99 |
13,276.42 |
+0.36% |
|
Advancers |
2,273 |
78% |
|
Advancers |
3,153 |
71% |
|
S&P 500 |
+10.06 |
4,283.85 |
+0.24% |
|
Decliners |
630 |
22% |
|
Decliners |
1,286 |
29% |
|
Russell 2000 |
+48.69 |
1,855.40 |
+2.69% |
|
52 Wk Highs |
109 |
|
|
52 Wk Highs |
130 |
|
|
S&P 600 |
+32.84 |
1,190.54 |
+2.84% |
|
52 Wk Lows |
13 |
|
|
52 Wk Lows |
83 |
|
|
 |
Leadership Improved as Major Indices Posted Small Gains
Kenneth J. Gruneisen - Passed the CAN SLIM® Master's Exam
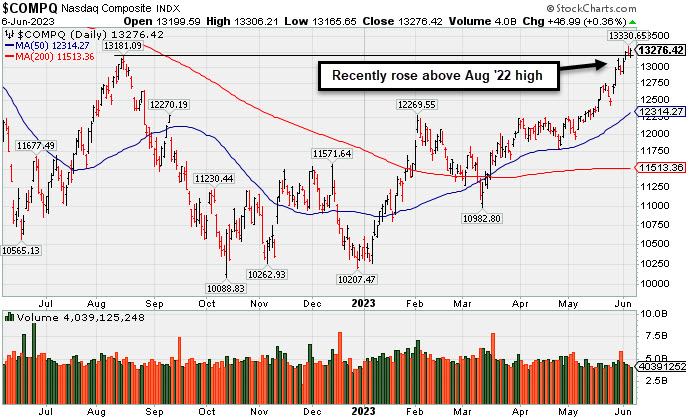
The Dow rose 10 points (0.03%), while the Nasdaq Composite climbed 0.4% and the S&P 500 advanced 0.2%. Volume totals reported were higher on the NYSE and on the Nasdaq exchange versus the prior session. Breadth was positive as advancers led decliners by more than a 3-1 margin on the NYSE and by 5-2 on the Nasdaq exchange. There were 77 high-ranked companies from the Leaders List that hit a new 52-week high and were listed on the BreakOuts Page, more than doubling the total of 32 on the prior session. New 52-week highs totals expanded and outnumbered new 52-week lows totals on the NYSE and on the Nasdaq exchange. The major indices are in a confirmed uptrend (M criteria). Appropriate new buying efforts may be considered under the fact-based investment system.
PICTURED: The Nasdaq Composite Index, the notoriously tech-heavy index, recently rose above its August 2022 high. It is up +26.8% year-to-date.
Seven of 11 sectors finished in positive territory as U.S. equities ended higher on Tuesday. It was a choppy day of trading as regional bank shares led the Financial sector higher. Meanwhile, last week’s tech rally continued to lose steam. Treasuries were mixed as investors evaluated the economic outlook amid a strong labor market and signs of economic weakness in other parts of the economy. Recent economic data showed softness in service-sector activity, an area of the economy that had previously shown resilience. The futures market is pricing in a high likelihood of one rate hike by July, with more bets that the Federal Reserve (Fed) will pause in June and hike in July. The yield on the 10-year note was down one basis point (0.01%) to 3.68%, while the 30-year bond yield fell four basis points (0.04%) to 3.85%. Meanwhile, the yield on the two-year note, which is more sensitive to changes in monetary policy, rose four basis points (0.04%) to 4.51%.
In commodities, West Texas Intermediate (WTI) crude fell 0.6% to $71.49/barrel as demand concerns amid slowing economic activity outweighed recent news that Saudi Arabia pledged additional oil production cuts and the Organization of the Petroleum Exporting Countries and its allies (OPEC+) extended current productions cuts through the end of next year.
|
 Kenneth J. Gruneisen started out as a licensed stockbroker in August 1987, a couple of months prior to the historic stock market crash that took the Dow Jones Industrial Average down -22.6% in a single day. He has published daily fact-based fundamental and technical analysis on high-ranked stocks online for two decades. Through FACTBASEDINVESTING.COM, Kenneth provides educational articles, news, market commentary, and other information regarding proven investment systems that work in good times and bad.
Comments contained in the body of this report are technical opinions only and are not necessarily those of Gruneisen Growth Corp. The material herein has been obtained from sources believed to be reliable and accurate, however, its accuracy and completeness cannot be guaranteed. Our firm, employees, and customers may effect transactions, including transactions contrary to any recommendation herein, or have positions in the securities mentioned herein or options with respect thereto. Any recommendation contained in this report may not be suitable for all investors and it is not to be deemed an offer or solicitation on our part with respect to the purchase or sale of any securities. |
|
 |
Financial, Retail, Semiconductor, and Commodity-Linked Groups Rose
Kenneth J. Gruneisen - Passed the CAN SLIM® Master's Exam
The Bank ($BKX +2.97%) posted a standout gain and the Broker/Dealer ($XBD +1.51%) also rose. The Retail ($RLX +0.85%) posted a smaller gain. The tech sector was mixed as the Semiconductor ($SOX +1.28%) led the tech sector higher and the Biotech ($BTK +0.23%) also inched higher, meanwhile the Networking ($NWX -0.45%) edged lower. The Oil Services ($OSX +0.94%) and Integrated Oil ($XOI +0.66%) Indexes each posted modest gains followed by a smaller gain from the Gold & Silver $XAU +0.34%).
PICTURED: The Broker/Dealer ($XBD +1.51%) posted a gain on Tuesday challenging its 200-day moving average (DMA) line while recovering from its May '23 low. Since financial stocks have been reliable "leading indicators", any further improvement would be a reassuring sign for the broader market outlook.
| Oil Services |
$OSX |
75.26 |
+0.70 |
+0.94% |
-10.26% |
| Integrated Oil |
$XOI |
1,641.88 |
+10.76 |
+0.66% |
-8.13% |
| Semiconductor |
$SOX |
3,488.34 |
+44.23 |
+1.28% |
+37.76% |
| Networking |
$NWX |
790.75 |
-3.54 |
-0.45% |
+0.95% |
| Broker/Dealer |
$XBD |
456.38 |
+6.79 |
+1.51% |
+1.62% |
| Retail |
$RLX |
3,328.56 |
+28.14 |
+0.85% |
+20.86% |
| Gold & Silver |
$XAU |
125.74 |
+0.43 |
+0.34% |
+4.04% |
| Bank |
$BKX |
81.74 |
+2.35 |
+2.97% |
-18.95% |
| Biotech |
$BTK |
5,402.47 |
+12.28 |
+0.23% |
+2.30% |
|
|
|
 |
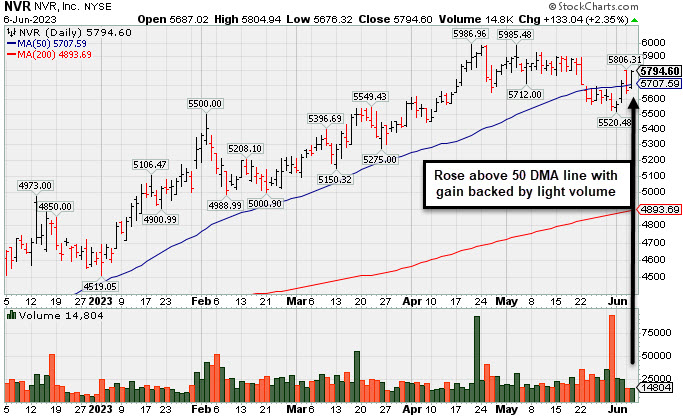
Rebounded Above 50 Day Average With Light Volume Gains
Kenneth J. Gruneisen - Passed the CAN SLIM® Master's Exam
NVR Inc (NVR +$133.04 or +2.35% to $5,794.60) rebounded above its 50-day moving average (DMA) line ($5,707) with today's gain backed by light volume helping its technical stance. It has sputtered since last shown in this FSU section in detail on 4/27/23 with an annotated graph under the headline, "Fell From High and Raised Concern With Subpar Mar '23 Report".
NVR was highlighted in yellow in the 4/25/23 mid-day report (read here) with pivot point cited based on its 12/30/21 high plus 10 cents. Concerns were soon raised, however, after it reported Mar '23 quarterly earnings -14% on -8% sales revenues, a noted fundamental flaw. Earnings had risen +50% on +23% sales revenues for the Dec '22 quarter versus the year-ago period, and prior quarterly comparisons were above the +25% minimum earnings guideline (C criteria). Annual earnings (A criteria) growth has been very strong. Despite the latest subpar quarter it still has a 91 Earnings Per Share Rating, well abov the 80+ minimum for buy candidates.
The Building - Residential/Commercial industry group is currently ranked 5th on the 197 Industry Groups list (L criteria). The number of top-rated funds owning its shares rose from 1,548 in Dec '22 to 1,630 in Mar '23. Its current Up/Down Volume Ratio of 1.4 is an unbiased indication its shares have been under accumulation over the past 50 days.
Symbol/Exchange
Company Name
Industry Group | PRICE | CHANGE
(%Change) | Day High | Volume
(% DAV)
(% 50 day avg vol) | 52 Wk Hi
% From Hi | Featured
Date | Price
Featured | Pivot Featured | | Max Buy |  GPK - NYSE GPK - NYSE
Graphic Packaging
Paper and Paper Products | $25.84 | +0.39
1.53% | $26.01 | 3,180,957
114.75% of 50 DAV
50 DAV is 2,772,000 | $26.16
-1.22%
| 10/25/2022 | $22.75 | PP = $24.17 | | MB = $25.38 |  Most Recent Note - 6/6/2023 3:24:17 PM Most Recent Note - 6/6/2023 3:24:17 PM
G - Rebounded above its 50 DMA line ($25.11) and it is perched within close striking distance of its all-time high with today's 4th consecutive gain. It has not formed a sound new base of sufficient length. Quickly recovered after testing its 4/27/23 low last week. Reported Mar '23 quarterly earnings +60% on +9% sales revenues versus the year-ago period.
>>> FEATURED STOCK ARTICLE : Packaging Firm Due to Report Earnings News - 5/1/2023 | View all notes | Set NEW NOTE alert | Company Profile | SEC News | Chart | Request a new note C A S I | STRL - NASDAQ
Sterling Infrastructure
Bldg-Heavy Construction | $51.68 | +1.76
3.53% | $51.73 | 345,312
142.10% of 50 DAV
50 DAV is 243,000 | $49.97
3.42%
| 12/14/2022 | $32.41 | PP = $33.72 | | MB = $35.41 | Most Recent Note - 6/6/2023 3:18:40 PM
G - Hitting yet another new all-time high today, getting more extended from any sound base with today's 13th base in the span of 14 sessions. Bullish action has continued although it reported Mar '23 quarterly earnings +0% on +10% sales revenues versus the year-ago period, below the +25% minimum earnings guideline (C criteria) raising fundamental concerns.
>>> FEATURED STOCK ARTICLE : 50-Day Moving Average Line Acted as Recent Resistance - 4/28/2023 | View all notes | Set NEW NOTE alert | Company Profile | SEC News | Chart | Request a new note C A S I | FIX - NYSE
Comfort Systems USA
Bldg-A/C and Heating Prds | $158.84 | +6.56
4.31% | $159.50 | 310,920
113.06% of 50 DAV
50 DAV is 275,000 | $156.19
1.70%
| 4/27/2023 | $148.85 | PP = $152.23 | | MB = $159.84 | Most Recent Note - 6/6/2023 3:10:24 PM
Y - Hitting a new all-time high and approaching its "max buy" level with today's big gain backed by light volume. No resistance remains due to overhead supply, however, it has made very little headway in recent weeks. It was repeatedly noted - "Subsequent gains and new highs backed by at least +40% above average volume may help reconfirm a technical buy signal."
>>> FEATURED STOCK ARTICLE : Churning Action While Recently Hovering Near All-Time High - 5/12/2023 | View all notes | Set NEW NOTE alert | Company Profile | SEC News | Chart | Request a new note C A S I | KOF - NYSE
Coca-Cola Femsa ADR
Beverages-Non-Alcoholic | $85.11 | +0.46
0.54% | $85.25 | 147,789
75.79% of 50 DAV
50 DAV is 195,000 | $91.23
-6.71%
| 3/7/2023 | $76.63 | PP = $77.11 | | MB = $80.97 | Most Recent Note - 6/2/2023 1:30:12 PM
G - Finding support near its 50 DMA line ($84.35) with today's 2nd gain backed by lighter volume following 7 consecutive losses marked by higher volume. More damaging losses would trigger a technical sell signal. Reported Mar '23 quarterly earnings +53% on +24% sales revenues versus the year-ago period. Prior highs in the $79-$77 area define the next support to watch below its 50 DMA line.
>>> FEATURED STOCK ARTICLE : Posted Gain Afrer Reporting Strong Mar '23 Quarterly Results - 5/2/2023 | View all notes | Set NEW NOTE alert | Company Profile | SEC News | Chart | Request a new note C A S I | CLH - NYSE
Clean Harbors
Pollution Control | $153.28 | +4.22
2.83% | $153.87 | 540,608
143.02% of 50 DAV
50 DAV is 378,000 | $151.30
1.31%
| 3/10/2023 | $136.89 | PP = $136.74 | | MB = $143.58 | Most Recent Note - 6/6/2023 3:20:35 PM
G - Hitting yet another new all-time high with today's big gain backed by below average volume. Its 50 DMA line ($141) defines near-term support to watch on pullbacks. Reported Mar '23 quarterly earnings +64% on +12% sales revenues versus the year-ago period. Fundamentals remain strong.
>>> FEATURED STOCK ARTICLE : Showed Resilience Near 50-Day Moving Average Following Sell-Off - 5/10/2023 | View all notes | Set NEW NOTE alert | Company Profile | SEC News | Chart | Request a new note C A S I | Symbol/Exchange
Company Name
Industry Group | PRICE | CHANGE
(%Change) | Day High | Volume
(% DAV)
(% 50 day avg vol) | 52 Wk Hi
% From Hi | Featured
Date | Price
Featured | Pivot Featured | | Max Buy | SPSC - NASDAQ
SPS Commerce
Comp Sftwr-Spec Enterprs | $169.76 | +6.07
3.71% | $170.90 | 199,096
141.20% of 50 DAV
50 DAV is 141,000 | $164.69
3.08%
| 4/24/2023 | $150.01 | PP = $157.56 | | MB = $165.44 | Most Recent Note - 6/6/2023 3:16:49 PM
G - Color code is changed to green while rising above its "max buy" level and hitting a new 52-week high with today's 4th consecutive gain backed by near average volume. Gains above the pivot point were not backed by +40% above average volume, so it did not trigger a proper technical buy signal. Reported Mar '23 quarterly earnings +22% on +20% versus the year-ago period, below the +25% minimum earnings guideline (C criteria) raising some fundamental concerns.
>>> FEATURED STOCK ARTICLE : Pulled Back After Quietly Wedging to New Highs - 5/31/2023 | View all notes | Set NEW NOTE alert | Company Profile | SEC News | Chart | Request a new note C A S I | HUBB - NYSE
Hubbell
Electrical-Power/Equipmt | $296.17 | +1.93
0.66% | $297.46 | 206,829
50.94% of 50 DAV
50 DAV is 406,000 | $296.28
-0.04%
| 4/25/2023 | $262.85 | PP = $257.51 | | MB = $270.39 | Most Recent Note - 6/2/2023 4:03:47 PM
G - Gapped up today and posted a solid gain with lighter volume for another new all-time high, getting more extended from the prior base. Prior highs in the $263 area define initial support to watch on pullbacks. Fundamentals remain strong. See the latest FSU analysis for more details and an annotated graph.
>>> FEATURED STOCK ARTICLE : Extended From Prior Base and Perched Near High - 6/1/2023 | View all notes | Set NEW NOTE alert | Company Profile | SEC News | Chart | Request a new note C A S I | NVR - NYSE
NVR
Bldg-Resident/Comml | $5,794.60 | +133.04
2.35% | $5,804.94 | 14,804
64.37% of 50 DAV
50 DAV is 23,000 | $5,986.96
-3.21%
| 4/25/2023 | $5,882.18 | PP = $5,978.25 | | MB = $6,277.16 | Most Recent Note - 6/6/2023 5:16:26 PM
G - Rebounded further above its 50 DMA line ($5,707) with today's light volume gain helping its technical stance. Reported Mar '23 quarterly earnings -14% on -3% sales revenues versus the year-ago period, below the +25% minimum earnings guideline (C criteria) raising fundamental concerns, and its color code was changed to green. Prior quarterly comparisons were well above the +25% minimum earnings guideline (C criteria). Annual earnings (A criteria) growth has been very strong. See the latest FSU analysis for more details and a new annotated graph.
>>> FEATURED STOCK ARTICLE : Rebounded Above 50 Day Average With Light Volume Gains - 6/6/2023 | View all notes | Set NEW NOTE alert | Company Profile | SEC News | Chart | Request a new note C A S I | PHM - NYSE
PulteGroup
Bldg-Resident/Comml | $72.18 | +2.76
3.98% | $72.25 | 3,159,189
111.12% of 50 DAV
50 DAV is 2,843,000 | $70.54
2.32%
| 4/25/2023 | $65.17 | PP = $64.01 | | MB = $67.21 | Most Recent Note - 6/6/2023 3:13:08 PM
G - Hitting another new high with today's 4th consecutive gain backed by light volume, getting extended from any sound base. Reported earnings +28% for the Mar '23 quarter versus the year-ago period. Important support to watch is its 50 DMA line ($64.31). See the latest FSU analysis for more details and an annotated graph.
>>> FEATURED STOCK ARTICLE : Rebounded Above "Max Buy" Level Toward Recent High - 6/2/2023 | View all notes | Set NEW NOTE alert | Company Profile | SEC News | Chart | Request a new note C A S I | COKE - NASDAQ
Coca-Cola Consolidated
Beverages-Non-Alcoholic | $682.60 | +17.02
2.56% | $683.50 | 44,749
131.61% of 50 DAV
50 DAV is 34,000 | $694.20
-1.67%
| 5/4/2023 | $646.66 | PP = $656.21 | | MB = $689.02 | Most Recent Note - 6/5/2023 2:47:33 PM
Y - Color code is changed to yellow today after pulling back below its "max buy" level. Bullish action came after it reported Mar '23 quarterly earnings +93% on +12% sales revenues versus the year-ago period, continuing its strong earnings track record.
>>> FEATURED STOCK ARTICLE : COKE is Showing Real Strength - 5/4/2023 | View all notes | Set NEW NOTE alert | Company Profile | SEC News | Chart | Request a new note C A S I | Symbol/Exchange
Company Name
Industry Group | PRICE | CHANGE
(%Change) | Day High | Volume
(% DAV)
(% 50 day avg vol) | 52 Wk Hi
% From Hi | Featured
Date | Price
Featured | Pivot Featured | | Max Buy | AMPH - NASDAQ
Amphastar Pharm
Medical-Biomed/Biotech | $45.88 | -0.13
-0.28% | $46.43 | 478,209
121.37% of 50 DAV
50 DAV is 394,000 | $46.86
-2.09%
| 5/15/2023 | $43.56 | PP = $44.15 | | MB = $46.36 | Most Recent Note - 6/2/2023 1:24:42 PM
Y - Hitting a new all-time high and trading near its "max buy" level with today's 5th consecutive gain backed by ever-increasing volume but still below the +40% above average volume guideline. Subsequent gains and a strong close above the pivot point backed by at least +40% above average volume may clinch a technical buy signal. Fundamentals remain strong.
>>> FEATURED STOCK ARTICLE : Weak Finish After Early Gain When Perched Near All-Time High - 5/15/2023 | View all notes | Set NEW NOTE alert | Company Profile | SEC News | Chart | Request a new note C A S I | ANET - NYSE
Arista Networks
Computer-Networking | $159.68 | -2.95
-1.81% | $161.41 | 3,005,643
93.34% of 50 DAV
50 DAV is 3,220,000 | $178.36
-10.47%
| 5/30/2023 | $176.35 | PP = $171.54 | | MB = $180.12 | Most Recent Note - 6/2/2023 3:58:23 PM
Y - Pulling back again today. Stalled this week after a streak of 4 consecutive volume-driven gains hitting a new high triggered a technical buy signal. Color code was changed to yellow with new pivot point cited based on its 3/23/23 high plus 10 cents in the 5/30/23 mid-day report. Reported Mar '23 quarterly earnings +70% on +54% sales revenues versus the year-ago period and fundamentals remain strong.
>>> FEATURED STOCK ARTICLE : Technical Sell Signal Triggered by Damaging Volume-Driven Loss - 5/3/2023 | View all notes | Set NEW NOTE alert | Company Profile | SEC News | Chart | Request a new note C A S I | PANW - NASDAQ
Palo Alto Networks
Computer Sftwr-Security | $224.72 | -2.07
-0.91% | $226.86 | 5,373,228
130.93% of 50 DAV
50 DAV is 4,104,000 | $230.18
-2.37%
| 6/5/2023 | $228.35 | PP = $213.73 | | MB = $224.42 | Most Recent Note - 6/5/2023 5:02:14 PM
Y - Color code was changed to yellow in the earlier mid-day report with new pivot point cited based on its 4/20/22 high plus 10 cents. It powered to a new all-time high with today's gap up and 8th consecutive volume-driven gain, however, it is quickly getting extended from the lengthy new base. Share price was impacted by a 3:1 split on 9/14/22. Reported Apr '23 quarterly earnings +83% on +24% sales revenues versus the year-ago period, and prior quarterly comparisons were above the +25% minimum earnings guideline (C criteria). See the latest FSU analysis for more details and a new annotated graph.
>>> FEATURED STOCK ARTICLE : Palo Alto Powers to New Highs Again - 6/5/2023 | View all notes | Set NEW NOTE alert | Company Profile | SEC News | Chart | Request a new note C A S I |
|
|
|
Color Codes Explained :
Y - Better candidates highlighted by our
staff of experts.
G - Previously featured
in past reports as yellow but may no longer be buyable under the
guidelines.
***Last / Change / Volume data in this table is the closing quote data***
|
|
|
THESE ARE NOT BUY RECOMMENDATIONS!
Comments contained in the body of this report are technical
opinions only. The material herein has been obtained
from sources believed to be reliable and accurate, however,
its accuracy and completeness cannot be guaranteed.
This site is not an investment advisor, hence it does
not endorse or recommend any securities or other investments.
Any recommendation contained in this report may not
be suitable for all investors and it is not to be deemed
an offer or solicitation on our part with respect to
the purchase or sale of any securities. All trademarks,
service marks and trade names appearing in this report
are the property of their respective owners, and are
likewise used for identification purposes only.
This report is a service available
only to active Paid Premium Members.
You may opt-out of receiving report notifications
at any time. Questions or comments may be submitted
by writing to Premium Membership Services 665 S.E. 10 Street, Suite 201 Deerfield Beach, FL 33441-5634 or by calling 1-800-965-8307
or 954-785-1121.
|
|
|