You are not logged in.
This means you
CAN ONLY VIEW reports that were published prior to Saturday, April 5, 2025.
You
MUST UPGRADE YOUR MEMBERSHIP if you want to see any current reports.
AFTER MARKET UPDATE - MONDAY, JULY 3RD, 2023
Previous After Market Report Next After Market Report >>>
|
|
|
|
DOW |
+10.87 |
34,418.47 |
+0.03% |
|
Volume |
467,038,750 |
-54% |
|
Volume |
2,941,857,100 |
-37% |
|
NASDAQ |
+28.85 |
13,816.77 |
+0.21% |
|
Advancers |
1,992 |
69% |
|
Advancers |
2,646 |
60% |
|
S&P 500 |
+5.21 |
4,455.59 |
+0.12% |
|
Decliners |
898 |
31% |
|
Decliners |
1,751 |
40% |
|
Russell 2000 |
+8.05 |
1,896.78 |
+0.43% |
|
52 Wk Highs |
86 |
|
|
52 Wk Highs |
84 |
|
|
S&P 600 |
+7.53 |
1,223.88 |
+0.62% |
|
52 Wk Lows |
7 |
|
|
52 Wk Lows |
60 |
|
|
 |
Major Indices Posted Small Gains on Quiet Session
Kenneth J. Gruneisen - Passed the CAN SLIM® Master's Exam
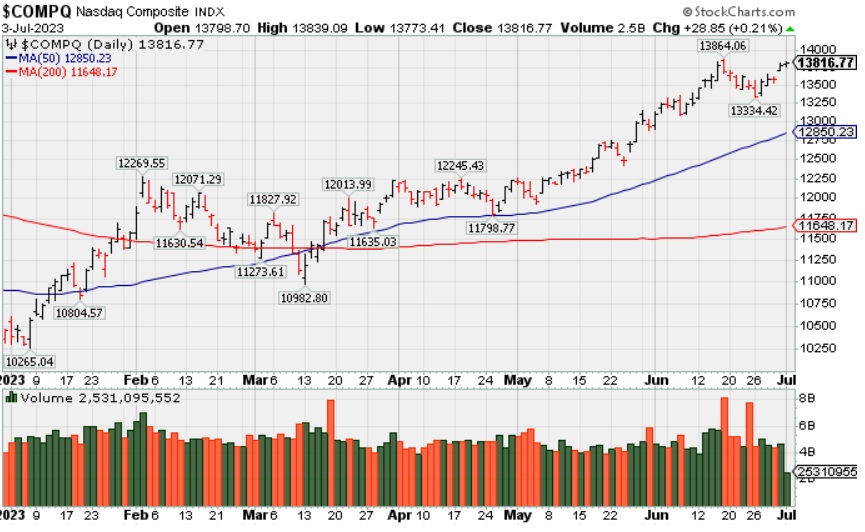
The volume totals reported were lower on the NYSE and on the Nasdaq exchange versus the prior session, naturally lighter due to the early close ahead of the Fourth of July holiday, but decent for a shortened day of trading. Breadth was positive as advancers led decliners by more than a 2-1 margin on the NYSE and by a 3-2 margin on the Nasdaq exchange. Leadership thinned as there were 30 high-ranked companies from the Leaders List that hit a new 52-week high and were listed on the BreakOuts Page, versus the total of 128 on the prior session. New 52-week highs outnumbered new 52-week lows on the NYSE and on the Nasdaq exchange. The major indices are in a confirmed uptrend (M criteria). Appropriate new buying efforts may be considered under the fact-based investment system.
PICTURED: The Nasdaq Composite Index is perched near its 2023 high and is up +32% year-to-date.
Nine of the 11 S&P 500 sectors closed with gains. There were some notable pockets of strength in the market with specific catalysts. EV makers Tesla (TSLA +6.90%) and Rivian (RIVN +17.41%) were standouts after impressive Q2 delivery numbers.
Another pocket of strength was the banking industry. Morgan Stanley (MS +1.19%) rose after it announced a dividend increase and the reauthorization of a multi-year stock repurchase program up to $20 billion.
The June ISM Manufacturing Index fell to 46.0% from 46.9% in May. The dividing line between expansion and contraction is 50.0%, so the sub-50.0% reading for June reflected a general contraction in manufacturing activity for the eighth straight month.
|
 Kenneth J. Gruneisen started out as a licensed stockbroker in August 1987, a couple of months prior to the historic stock market crash that took the Dow Jones Industrial Average down -22.6% in a single day. He has published daily fact-based fundamental and technical analysis on high-ranked stocks online for two decades. Through FACTBASEDINVESTING.COM, Kenneth provides educational articles, news, market commentary, and other information regarding proven investment systems that work in good times and bad.
Comments contained in the body of this report are technical opinions only and are not necessarily those of Gruneisen Growth Corp. The material herein has been obtained from sources believed to be reliable and accurate, however, its accuracy and completeness cannot be guaranteed. Our firm, employees, and customers may effect transactions, including transactions contrary to any recommendation herein, or have positions in the securities mentioned herein or options with respect thereto. Any recommendation contained in this report may not be suitable for all investors and it is not to be deemed an offer or solicitation on our part with respect to the purchase or sale of any securities. |
|
 |
Financial, Semi, Networking, and Commodity-Linked Groups Rose
Kenneth J. Gruneisen - Passed the CAN SLIM® Master's Exam
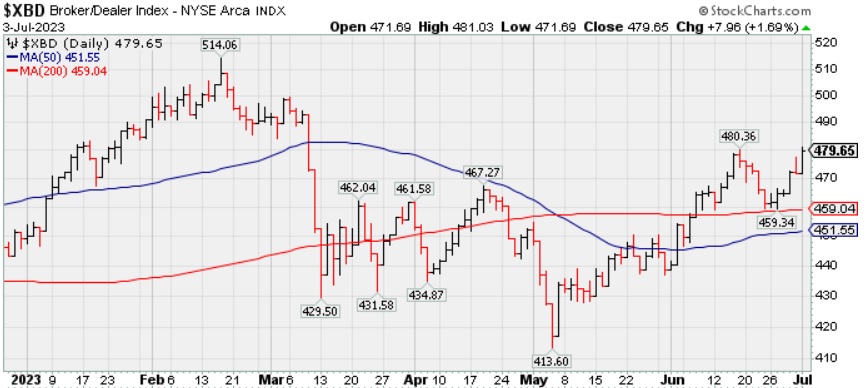
The Bank Index ($BKX +1.76%) and the Broker/Dealer Index ($XBD +1.69%) posted influential gains while the Retail Index ($RLX -0.19%) inched lower. The tech sector had a positive bias as the Networking Index ($NWX +0.52%) and the Semiconductor Index ($SOX +0.83%) posted small gains but the Biotech Index ($BTK -0.10%) ended slightly in the red. The Gold & Silver Index ($XAU +1.61%), Oil Services Index ($OSX +0.86%) and the Integrated Oil Index ($XOI +0.48%) rounded out the positive session with solid gains.
PICTURED: The Broker/Dealer Index ($XBD +1.69%) posted a gain and traded above its June high. It has been consolidating above its 50-day and 200-day moving average (DMA) lines.
| Oil Services |
$OSX |
79.76 |
+0.68 |
+0.86% |
-4.89% |
| Integrated Oil |
$XOI |
1,687.43 |
+8.13 |
+0.48% |
-5.59% |
| Semiconductor |
$SOX |
3,703.62 |
+30.56 |
+0.83% |
+46.27% |
| Networking |
$NWX |
854.77 |
+4.43 |
+0.52% |
+9.12% |
| Broker/Dealer |
$XBD |
479.65 |
+7.96 |
+1.69% |
+6.79% |
| Retail |
$RLX |
3,468.96 |
-6.59 |
-0.19% |
+25.96% |
| Gold & Silver |
$XAU |
121.97 |
+1.94 |
+1.61% |
+0.91% |
| Bank |
$BKX |
81.63 |
+1.42 |
+1.76% |
-19.06% |
| Biotech |
$BTK |
5,220.20 |
-5.03 |
-0.10% |
-1.15% |
|
|
|
 |
Streak of Gains Lifts Sterling Infrastructure to New Highs
Kenneth J. Gruneisen - Passed the CAN SLIM® Master's Exam
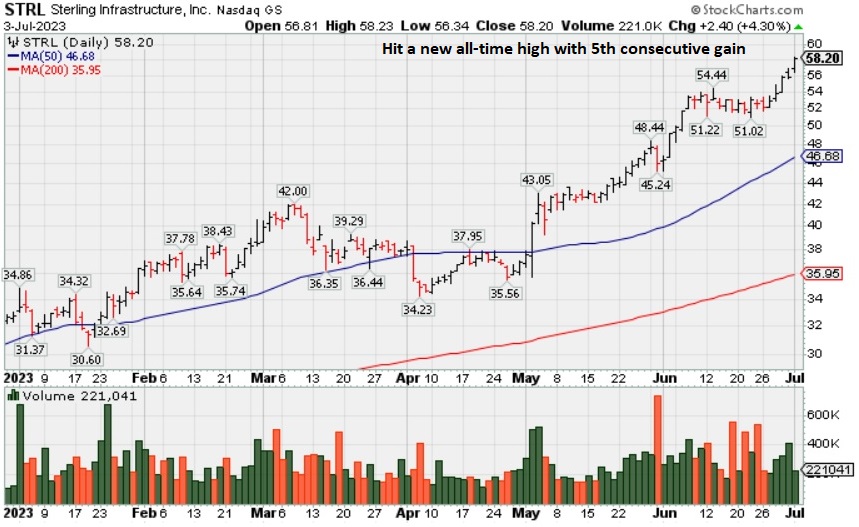
Sterling Infrastructure (STRL +$2.40 or +4.30% to $58.20) hit yet another new all-time high today, getting more extended from any sound base. Bullish action has continued although it reported Mar '23 quarterly earnings +0% on +10% sales revenues versus the year-ago period, below the +25% minimum earning guideline (C criteria) raising fundamental concerns.
STRL was highlighted in yellow with pivot point cited based on its 11/08/22 high plus 10 cents in the 12/14/22 mid-day report (read here). It was last covered in detail on 6/07/23 with an annotated graph under the headline, "Impressive Streak of Gains for New Highs".
STRL hails from the Building - Heavy Construction industry group which is currently ranked 45th on the 197 Industry Groups list (L criteria). It has a 96 Earnings Per Share Rating, down from 99 when recently featured. Through Dec '22 it had 6 quarterly comparisons at or above the +25% minimum earnings guideline (C criteria). Annual earnings (A criteria) growth has been strong and steady since FY '17.
The company has a small supply of only 30.8 million shares outstanding. That can lead to greater price volatility in the event of institutional buying or selling. The number of top-rated funds owning its shares rose from 337 in Dec '21 to 403 in Jun '23. Its current Up/Down Volume Ratio of 1.9 is an unbiased indication its shares have been under accumulation over the past 50 days.
|
|
|
Color Codes Explained :
Y - Better candidates highlighted by our
staff of experts.
G - Previously featured
in past reports as yellow but may no longer be buyable under the
guidelines.
***Last / Change / Volume data in this table is the closing quote data***
Symbol/Exchange
Company Name
Industry Group |
PRICE |
CHANGE
(%Change) |
Day High |
Volume
(% DAV)
(% 50 day avg vol) |
52 Wk Hi
% From Hi |
Featured
Date |
Price
Featured |
Pivot Featured |
|
Max Buy |
 GPK
-
NYSE
GPK
-
NYSE
Graphic Packaging Hldg
CONSUMER NON-DURABLES - Packaging and Containers
|
$24.39
|
+0.36
1.50% |
$24.53
|
1,540,495
34.01% of 50 DAV
50 DAV is 4,530,000
|
$27.56
-11.50%
|
10/25/2022
|
$22.75
|
PP = $24.17
|
|
MB = $25.38
|
Most Recent Note - 6/29/2023 12:49:41 PM
G - Gapped down today violating its 200 DMA line ($23.35) then rebounded above that important long-term average. A rebound above the 50 DMA line ($25.17) is needed to help its outlook improve. Its Relative Strength Rating has slumped to 64, below the 80+ minimum guideline for buy candidates.
>>> FEATURED STOCK ARTICLE : Graphic Packaging Hits New High With 6th Consecutive Gain - 6/8/2023 |
View all notes |
Set NEW NOTE alert |
Company Profile |
SEC
News |
Chart |
Request a new note
C
A
S
I |
STRL
-
NASDAQ
Sterling Infrastructure
Bldg-Heavy Construction
|
$58.20
|
+2.40
4.30% |
$58.23
|
220,907
75.39% of 50 DAV
50 DAV is 293,000
|
$57.25
1.66%
|
12/14/2022
|
$32.41
|
PP = $33.72
|
|
MB = $35.41
|
 Most Recent Note - 7/3/2023 5:40:03 PM
G - Posted a 5th consecutive gain today with below-average volume, wedging to another new all-time high, very extended from any sound base. Mar '23 quarterly earnings were below the +25% minimum guideline (C criteria) raising fundamental concerns. See the latest FSU analysis for more details and a new annotated graph.
>>> FEATURED STOCK ARTICLE : Streak of Gains Lifts Sterling Infrastructure to New Highs - 7/3/2023 |
View all notes |
Set NEW NOTE alert |
Company Profile |
SEC
News |
Chart |
Request a new note
C
A
S
I |
FIX
-
NYSE
Comfort Systems USA
Bldg-A/C and Heating Prds
|
$164.44
|
+0.24
0.15% |
$165.88
|
94,326
33.57% of 50 DAV
50 DAV is 281,000
|
$167.53
-1.84%
|
4/27/2023
|
$148.85
|
PP = $152.23
|
|
MB = $159.84
|
Most Recent Note - 6/27/2023 5:37:17 PM
G - Volume totals have been cooling while hovering near its all-time high. Extended from the prior base and no resistance remains due to overhead supply. Prior highs in the $152-156 area define initial support to watch above its 50 DMA line ($150.54).
>>> FEATURED STOCK ARTICLE : "Negative Reversal" Following Recent Volume-Driven Gains - 6/16/2023 |
View all notes |
Set NEW NOTE alert |
Company Profile |
SEC
News |
Chart |
Request a new note
C
A
S
I |
KOF
-
NYSE
Coca-Cola Femsa ADR
Beverages-Non-Alcoholic
|
$84.21
|
+0.90
1.08% |
$84.85
|
66,895
38.45% of 50 DAV
50 DAV is 174,000
|
$91.23
-7.69%
|
6/9/2023
|
$88.61
|
PP = $91.33
|
|
MB = $95.90
|
Most Recent Note - 6/27/2023 12:30:58 PM
G - Further undercutting its 50 DMA line ($86.36) with today's 4th consecutive loss raising greater concerns. A prompt rebound above the 50 DMA line is needed to help its outlook improve. The prior low ($81.63 on 5/31/23) defines the next important near-term support to watch. Subsequent gains above the pivot point backed by at least +40% above average volume may trigger a technical buy signal. Fundamentals remain strong.
>>> FEATURED STOCK ARTICLE : Coca-Cola Femsa Posts 7th Consecutive Gain - 6/9/2023 |
View all notes |
Set NEW NOTE alert |
Company Profile |
SEC
News |
Chart |
Request a new note
C
A
S
I |
CLH
-
NYSE
Clean Harbors
Pollution Control
|
$163.17
|
-1.26
-0.77% |
$164.57
|
223,088
56.48% of 50 DAV
50 DAV is 395,000
|
$164.80
-0.99%
|
3/10/2023
|
$136.89
|
PP = $136.74
|
|
MB = $143.58
|
Most Recent Note - 6/27/2023 5:36:07 PM
G - Volume totals have cooled while hovering near its all-time high, extended from any sound base. Its 50 DMA line ($146.56) and prior high define important near-term support to watch on pullbacks. Fundamentals remain strong.
>>> FEATURED STOCK ARTICLE : Extended From Any Sound Base and Hovering Near High - 6/15/2023 |
View all notes |
Set NEW NOTE alert |
Company Profile |
SEC
News |
Chart |
Request a new note
C
A
S
I |
Symbol/Exchange
Company Name
Industry Group |
PRICE |
CHANGE
(%Change) |
Day High |
Volume
(% DAV)
(% 50 day avg vol) |
52 Wk Hi
% From Hi |
Featured
Date |
Price
Featured |
Pivot Featured |
|
Max Buy |
SPSC
-
NASDAQ
SPS Commerce
Comp Sftwr-Spec Enterprs
|
$189.05
|
-3.01
-1.57% |
$191.02
|
63,564
35.12% of 50 DAV
50 DAV is 181,000
|
$192.67
-1.88%
|
4/24/2023
|
$150.01
|
PP = $157.56
|
|
MB = $165.44
|
Most Recent Note - 6/28/2023 5:13:52 PM
G - Volume was +46% above average behind today's gain while hitting another new 52-week high, getting very extended from the previously noted base. Reported Mar '23 quarterly earnings +22% on +20% versus the year-ago period, below the +25% minimum earnings guideline (C criteria) raising some fundamental concerns.
>>> FEATURED STOCK ARTICLE : Perched Near High Following Noted Volume-Driven Gains - 6/21/2023 |
View all notes |
Set NEW NOTE alert |
Company Profile |
SEC
News |
Chart |
Request a new note
C
A
S
I |
HUBB
-
NYSE
Hubbell
Electrical-Power/Equipmt
|
$328.99
|
-2.57
-0.78% |
$331.49
|
119,508
27.73% of 50 DAV
50 DAV is 431,000
|
$332.76
-1.13%
|
4/25/2023
|
$262.85
|
PP = $257.51
|
|
MB = $270.39
|
Most Recent Note - 6/28/2023 5:10:08 PM
G - Churning above-average volume while recently hovering near its all-time high, very extended from the prior base. Its 50 DMA line ($284) defines initial support to watch on pullbacks. Fundamentals remain strong.
>>> FEATURED STOCK ARTICLE : Hubbell on Track for 11th Weekly Gain - 6/22/2023 |
View all notes |
Set NEW NOTE alert |
Company Profile |
SEC
News |
Chart |
Request a new note
C
A
S
I |
NVR
-
NYSE
NVR
Bldg-Resident/Comml
|
$6,286.48
|
-64.14
-1.01% |
$6,347.06
|
9,624
37.02% of 50 DAV
50 DAV is 26,000
|
$6,386.62
-1.57%
|
4/25/2023
|
$5,882.18
|
PP = $5,978.25
|
|
MB = $6,277.16
|
Most Recent Note - 6/30/2023 5:37:15 PM
G - Posted a gain today with below-average volume for a new high close, perched near its all-time high. Its 50 DMA line ($5,869) defines near-term support watch on pullbacks. See the latest FSU analysis for more details and a new annotated graph.
>>> FEATURED STOCK ARTICLE : New High Close for Strong Homebuilder - 6/30/2023 |
View all notes |
Set NEW NOTE alert |
Company Profile |
SEC
News |
Chart |
Request a new note
C
A
S
I |
PHM
-
NYSE
PulteGroup
Bldg-Resident/Comml
|
$77.29
|
-0.39
-0.50% |
$78.05
|
1,389,596
45.82% of 50 DAV
50 DAV is 3,033,000
|
$79.15
-2.35%
|
4/25/2023
|
$65.17
|
PP = $64.01
|
|
MB = $67.21
|
Most Recent Note - 7/3/2023 4:11:46 PM
G - Volume totals are cooling while consolidating near its all-time high, very extended from any sound base. Reported earnings +28% for the Mar '23 quarter versus the year-ago period. Important support to watch is defined by its 50 DMA line ($70).
>>> FEATURED STOCK ARTICLE : Negative Reversal After Hitting Another New High - 6/26/2023 |
View all notes |
Set NEW NOTE alert |
Company Profile |
SEC
News |
Chart |
Request a new note
C
A
S
I |
COKE
-
NASDAQ
Coca-Cola Consolidated
Beverages-Non-Alcoholic
|
$639.48
|
+3.46
0.54% |
$641.00
|
25,277
63.19% of 50 DAV
50 DAV is 40,000
|
$694.20
-7.88%
|
5/4/2023
|
$646.66
|
PP = $656.21
|
|
MB = $689.02
|
Most Recent Note - 7/3/2023 4:10:16 PM
Y - Consolidating near its 50 DMA line ($640). More damaging losses would raise concerns and trigger technical sell signals. Fundamentals remain strong.
>>> FEATURED STOCK ARTICLE : Fell Below Pivot Point With Recent Volume-Driven Losses - 6/14/2023 |
View all notes |
Set NEW NOTE alert |
Company Profile |
SEC
News |
Chart |
Request a new note
C
A
S
I |
Symbol/Exchange
Company Name
Industry Group |
PRICE |
CHANGE
(%Change) |
Day High |
Volume
(% DAV)
(% 50 day avg vol) |
52 Wk Hi
% From Hi |
Featured
Date |
Price
Featured |
Pivot Featured |
|
Max Buy |
AMPH
-
NASDAQ
Amphastar Pharm
Medical-Biomed/Biotech
|
$57.63
|
+0.16
0.28% |
$58.80
|
332,141
70.07% of 50 DAV
50 DAV is 474,000
|
$58.80
-1.99%
|
5/15/2023
|
$43.56
|
PP = $44.15
|
|
MB = $46.36
|
Most Recent Note - 6/30/2023 5:39:45 PM
G - Posted a gain today with below-average volume for a 2nd-best-ever close. Very extended from any sound base. Its 50 DMA line ($45.23) and prior highs in the $44 area define important support to watch on pullbacks. Fundamentals remain strong.
>>> FEATURED STOCK ARTICLE : Hit Another New High With 4th Consecutive Volume-Driven Gain - 6/20/2023 |
View all notes |
Set NEW NOTE alert |
Company Profile |
SEC
News |
Chart |
Request a new note
C
A
S
I |
ANET
-
NYSE
Arista Networks
Computer-Networking
|
$159.90
|
-2.16
-1.33% |
$161.86
|
921,649
24.86% of 50 DAV
50 DAV is 3,707,000
|
$178.36
-10.35%
|
5/30/2023
|
$176.35
|
PP = $171.54
|
|
MB = $180.12
|
Most Recent Note - 6/27/2023 5:32:56 PM
G - Rebounded above its 50 DMA line ($152.81) with below-average volume behind today's 2nd consecutive gain helping its outlook improve. Faces near-term resistance due to overhead supply up to the $178 level. Fundamentals remain strong.
>>> FEATURED STOCK ARTICLE : Rebounding Near Recent High With 3 Consecutive Gains - 6/12/2023 |
View all notes |
Set NEW NOTE alert |
Company Profile |
SEC
News |
Chart |
Request a new note
C
A
S
I |
PANW
-
NASDAQ
Palo Alto Networks
Computer Sftwr-Security
|
$254.64
|
-0.87
-0.34% |
$255.44
|
1,744,188
28.30% of 50 DAV
50 DAV is 6,163,000
|
$256.83
-0.85%
|
6/5/2023
|
$228.35
|
PP = $213.73
|
|
MB = $224.42
|
Most Recent Note - 6/27/2023 5:29:16 PM
G - Hit another new all-time high with today's gain. Very extended from the prior high ($213) which defines initial support to watch on pullbacks. Fundamentals remain strong. See the latest FSU analysis for more details and a new annotated graph.
>>> FEATURED STOCK ARTICLE : Strength Continues for Network Security Leader - 6/27/2023 |
View all notes |
Set NEW NOTE alert |
Company Profile |
SEC
News |
Chart |
Request a new note
C
A
S
I |
LSCC
-
NASDAQ
Lattice Semiconductor
Elec-Semicondctor Fablss
|
$95.09
|
-0.98
-1.02% |
$97.27
|
908,743
35.82% of 50 DAV
50 DAV is 2,537,000
|
$97.27
-2.24%
|
6/13/2023
|
$91.73
|
PP = $96.92
|
|
MB = $101.77
|
Most Recent Note - 6/30/2023 5:41:52 PM
Y - Posted a 5th consecutive gain today backed by below-average volume and managed a best-ever close. Its 50 DMA line ($84.55) defines near-term support to watch. Subsequent gains above the pivot point backed by at least +40% above average volume may trigger a technical buy signal. Reported Mar '23 quarterly earnings +38% on +22% sales revenues versus the year-ago period, its 9th consecutive strong quarterly comparison above the +25% minimum earnings guideline (C criteria). Annual earnings history (A criteria) has been strong.
>>> FEATURED STOCK ARTICLE : Lattice Posts Volume-Driven Gains Approaching Prior High - 6/13/2023 |
View all notes |
Set NEW NOTE alert |
Company Profile |
SEC
News |
Chart |
Request a new note
C
A
S
I |
XPEL
-
NASDAQ
XPEL
Auto/Truck-Replace Parts
|
$83.99
|
-0.23
-0.27% |
$84.78
|
80,701
61.60% of 50 DAV
50 DAV is 131,000
|
$87.01
-3.47%
|
6/28/2023
|
$83.14
|
PP = $87.11
|
|
MB = $91.47
|
Most Recent Note - 6/28/2023 5:04:54 PM
Y - Color code was changed to yellow with pivot point cited based on its 8/15/23 high plus 10 cents when featured in the earlier mid-day report. Perched within striking distance of its 52-week high after an orderly 10-month base. Reported Mar '23 quarterly earnings +46% on +19% sales revenues versus the year ago period, its 3rd quarterly comparison above the +25% minimum earnings guideline (C criteria), helping it better match the winning models of the fact-based investment system. Annual earnings growth remained strong while it went through a deep consolidation since dropped from the Featured Stocks list on 8/13/21. See the latest FSU analysis for more details and a new annotated graph.
>>> FEATURED STOCK ARTICLE : XPEL Returns to Featured Stocks List After Long Consolidation - 6/28/2023 |
View all notes |
Set NEW NOTE alert |
Company Profile |
SEC
News |
Chart |
Request a new note
C
A
S
I |
Symbol/Exchange
Company Name
Industry Group |
PRICE |
CHANGE
(%Change) |
Day High |
Volume
(% DAV)
(% 50 day avg vol) |
52 Wk Hi
% From Hi |
Featured
Date |
Price
Featured |
Pivot Featured |
|
Max Buy |
|
|
|
THESE ARE NOT BUY RECOMMENDATIONS!
Comments contained in the body of this report are technical
opinions only. The material herein has been obtained
from sources believed to be reliable and accurate, however,
its accuracy and completeness cannot be guaranteed.
This site is not an investment advisor, hence it does
not endorse or recommend any securities or other investments.
Any recommendation contained in this report may not
be suitable for all investors and it is not to be deemed
an offer or solicitation on our part with respect to
the purchase or sale of any securities. All trademarks,
service marks and trade names appearing in this report
are the property of their respective owners, and are
likewise used for identification purposes only.
This report is a service available
only to active Paid Premium Members.
You may opt-out of receiving report notifications
at any time. Questions or comments may be submitted
by writing to Premium Membership Services 665 S.E. 10 Street, Suite 201 Deerfield Beach, FL 33441-5634 or by calling 1-800-965-8307
or 954-785-1121.
|
|
|